Downloaded 109 times
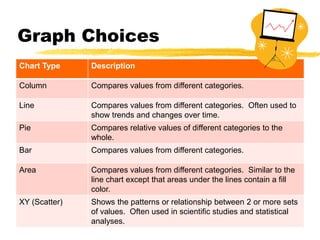
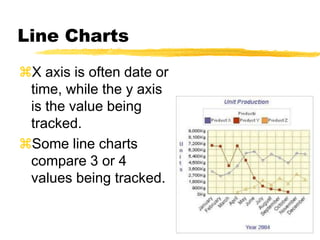
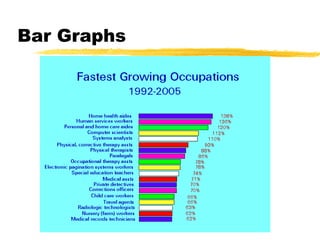
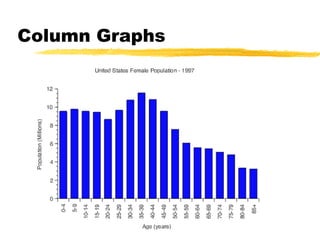
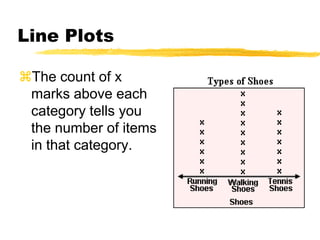
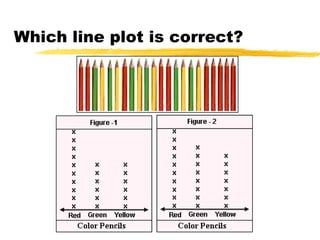
This document discusses different types of graphs, including line graphs, bar graphs, and pie charts. It describes when each graph type is most appropriate based on the data being visualized. Line graphs are best for comparing values over time, while bar graphs compare values across categories. The document also provides examples of correctly formatted line plots and instructs students to complete worksheets to practice creating different graph types.