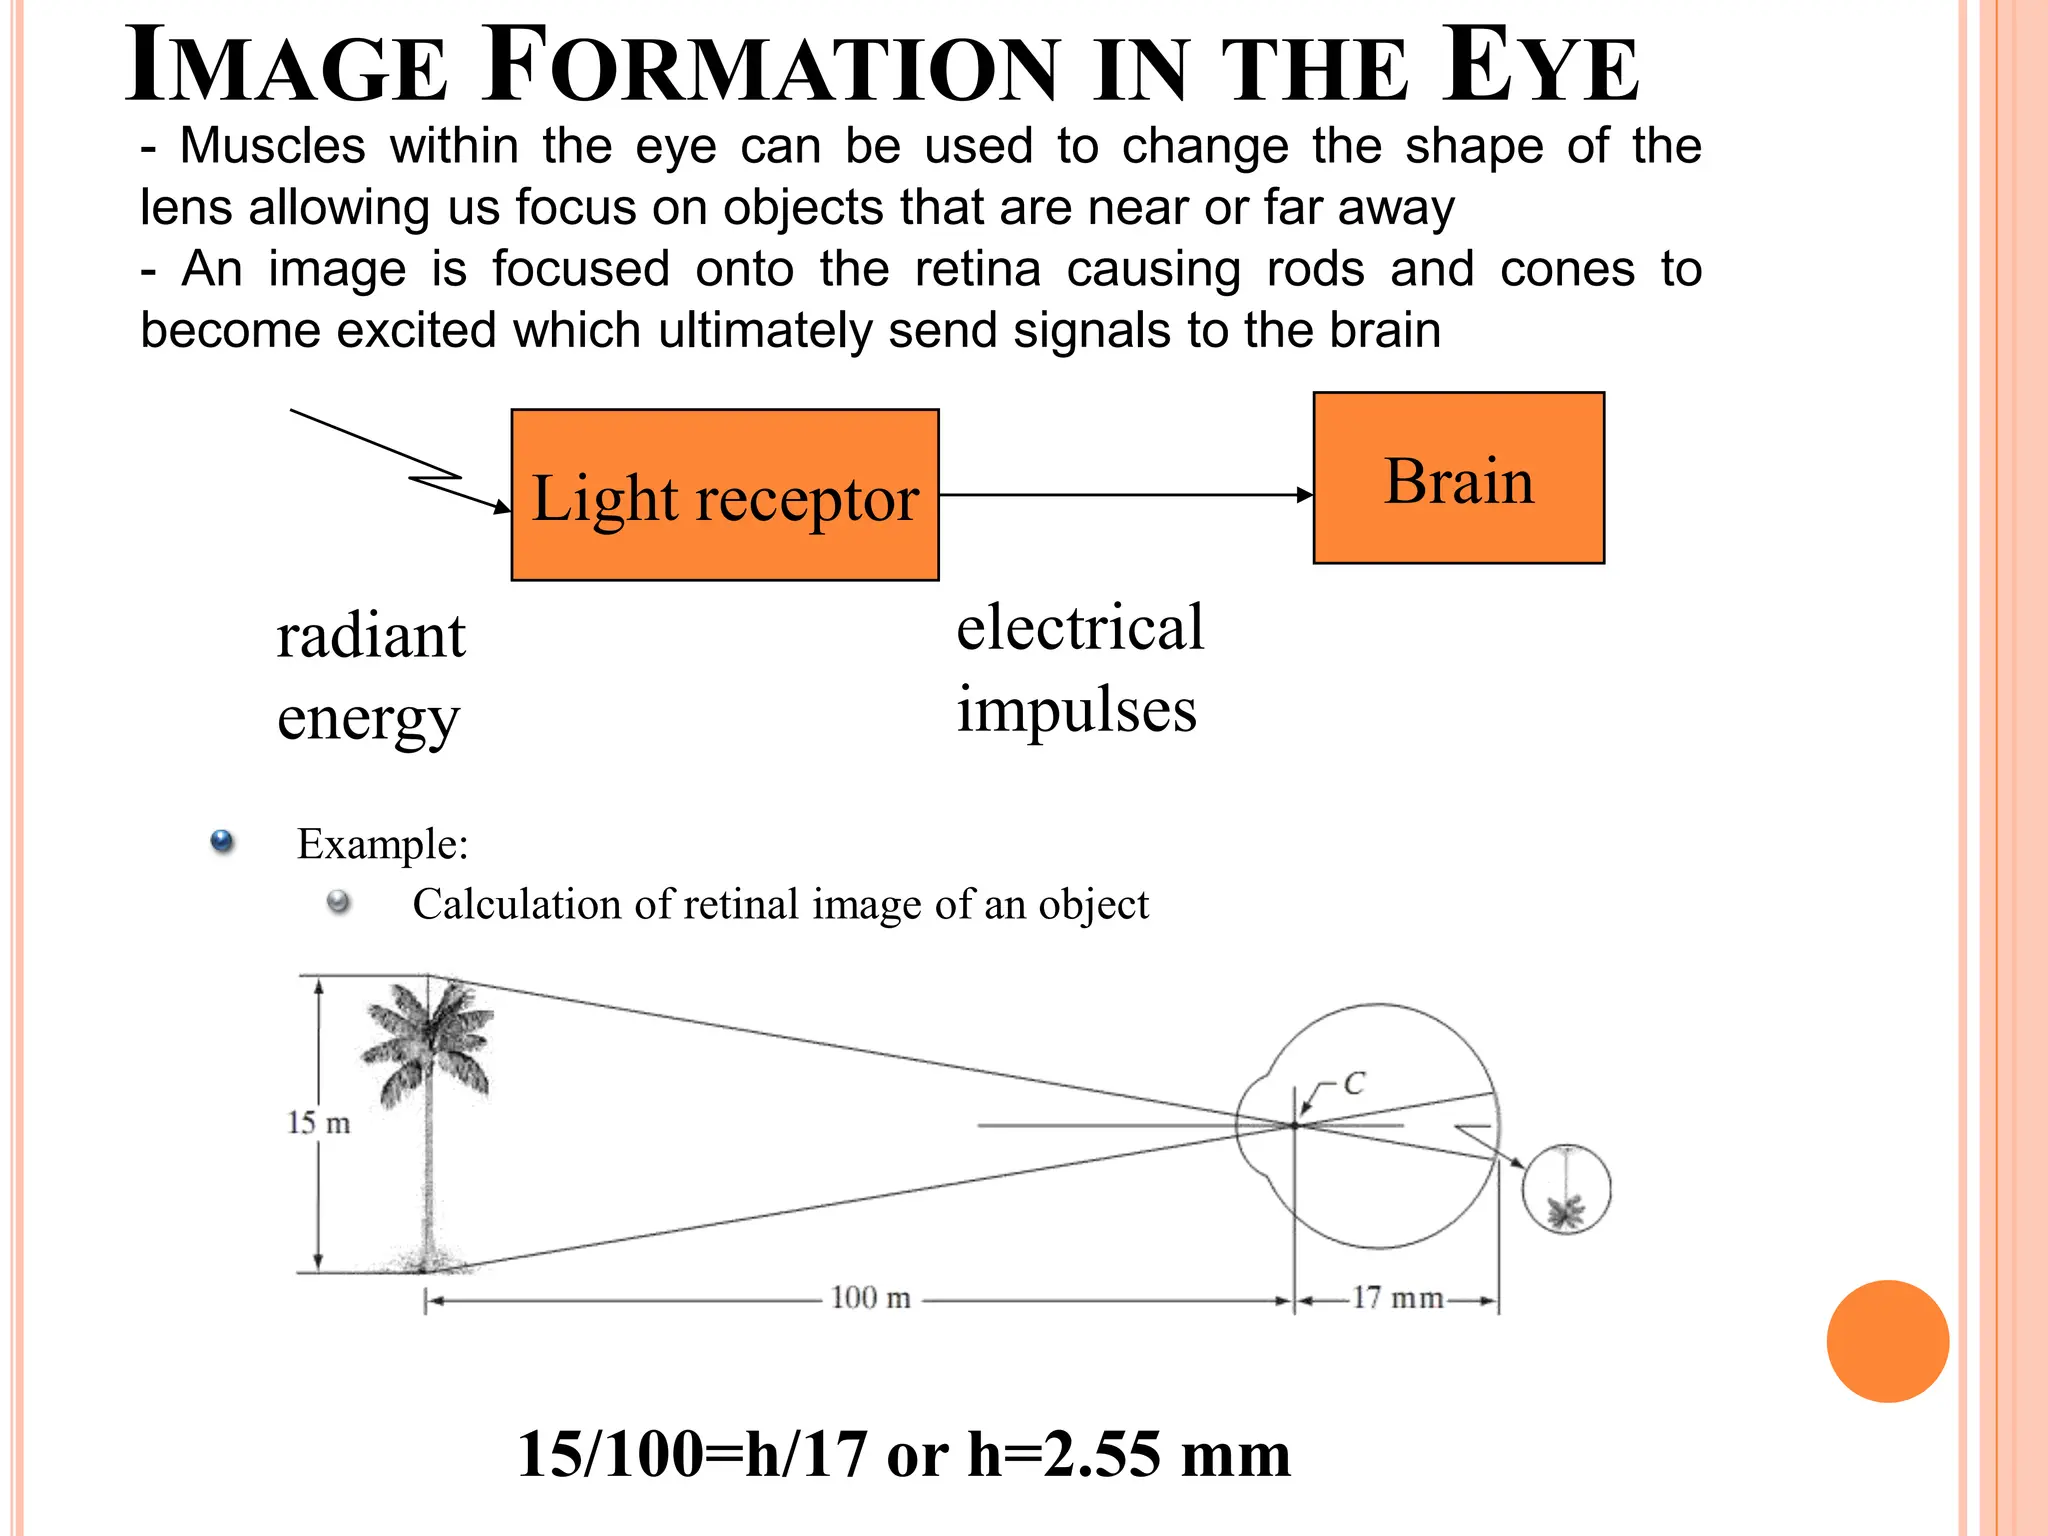
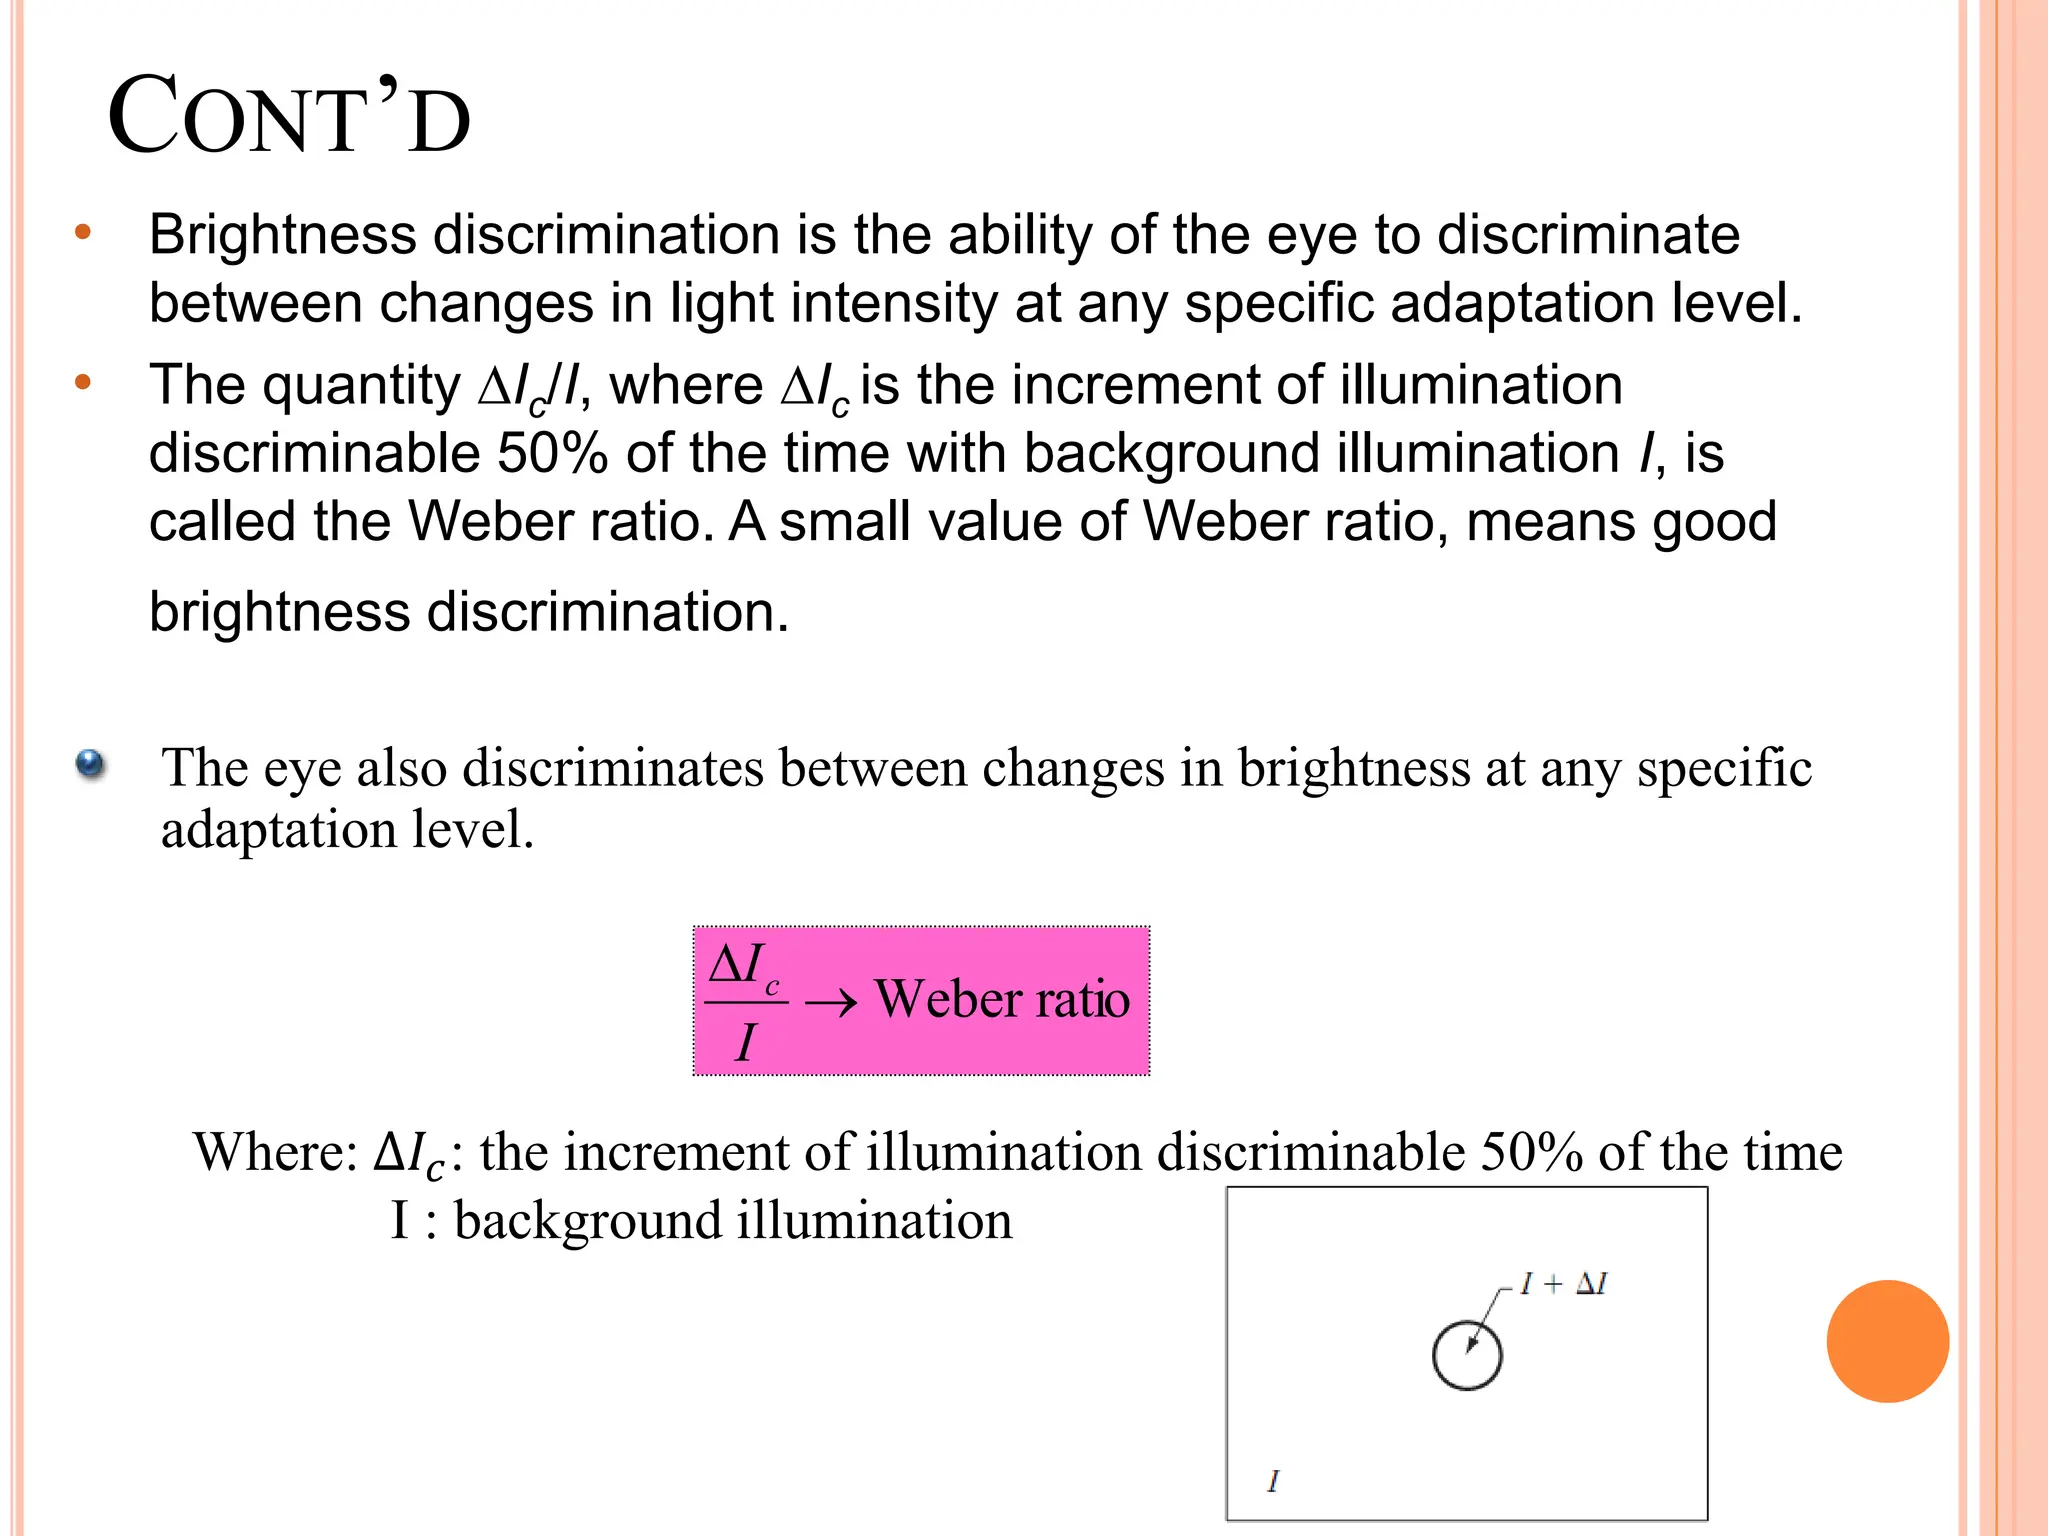
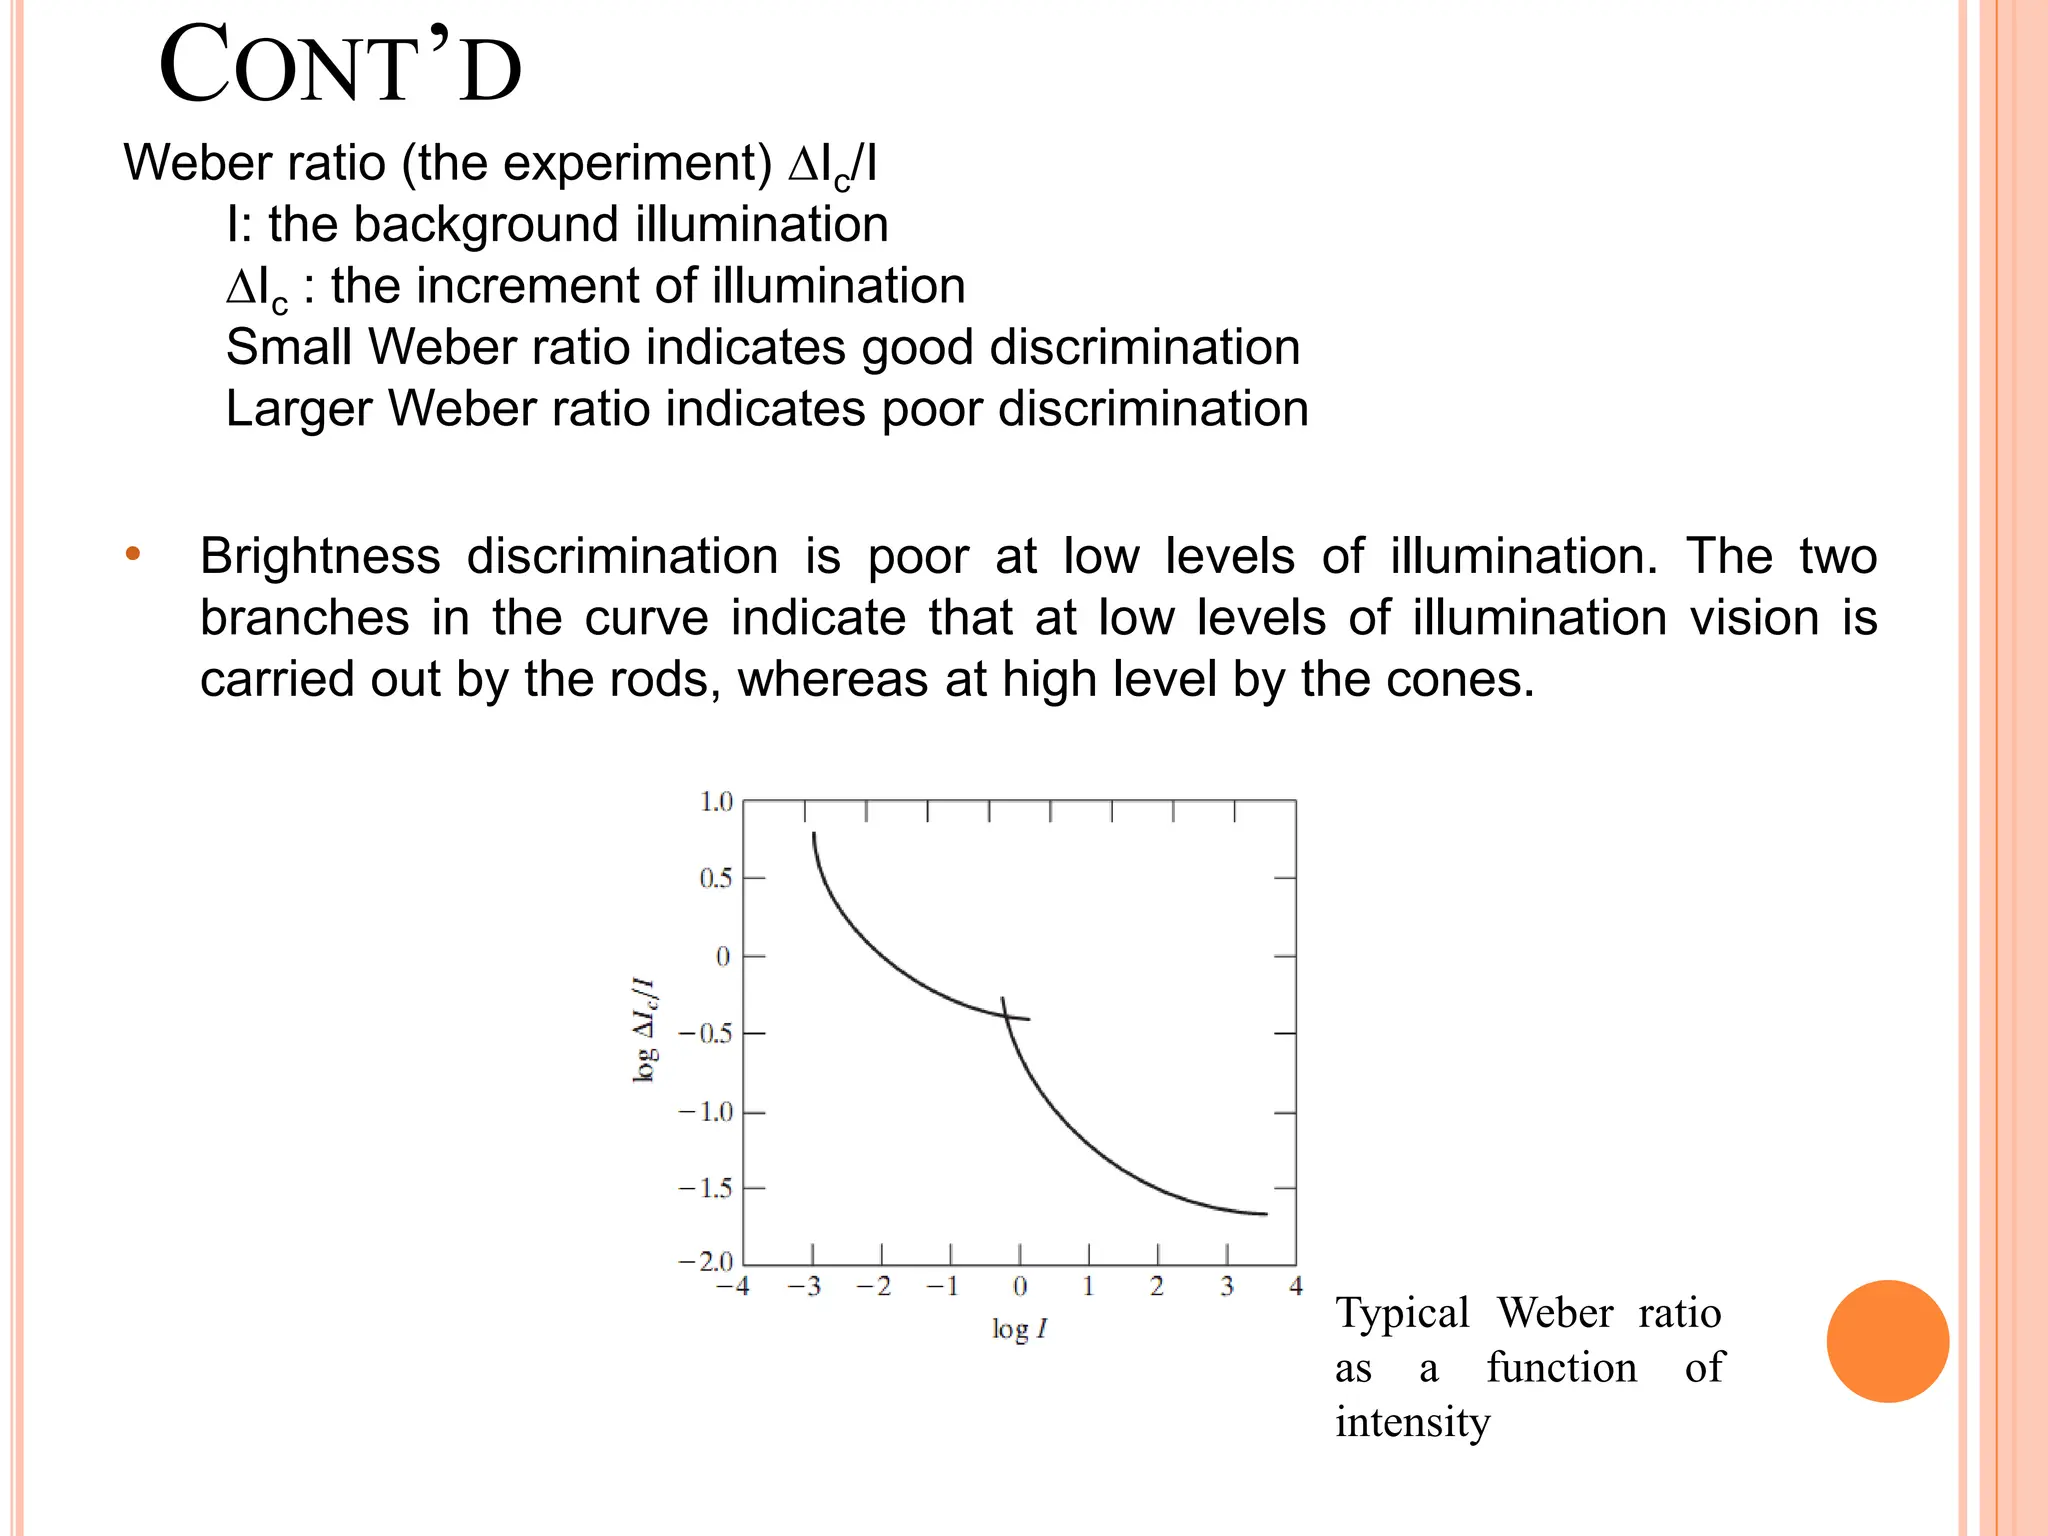
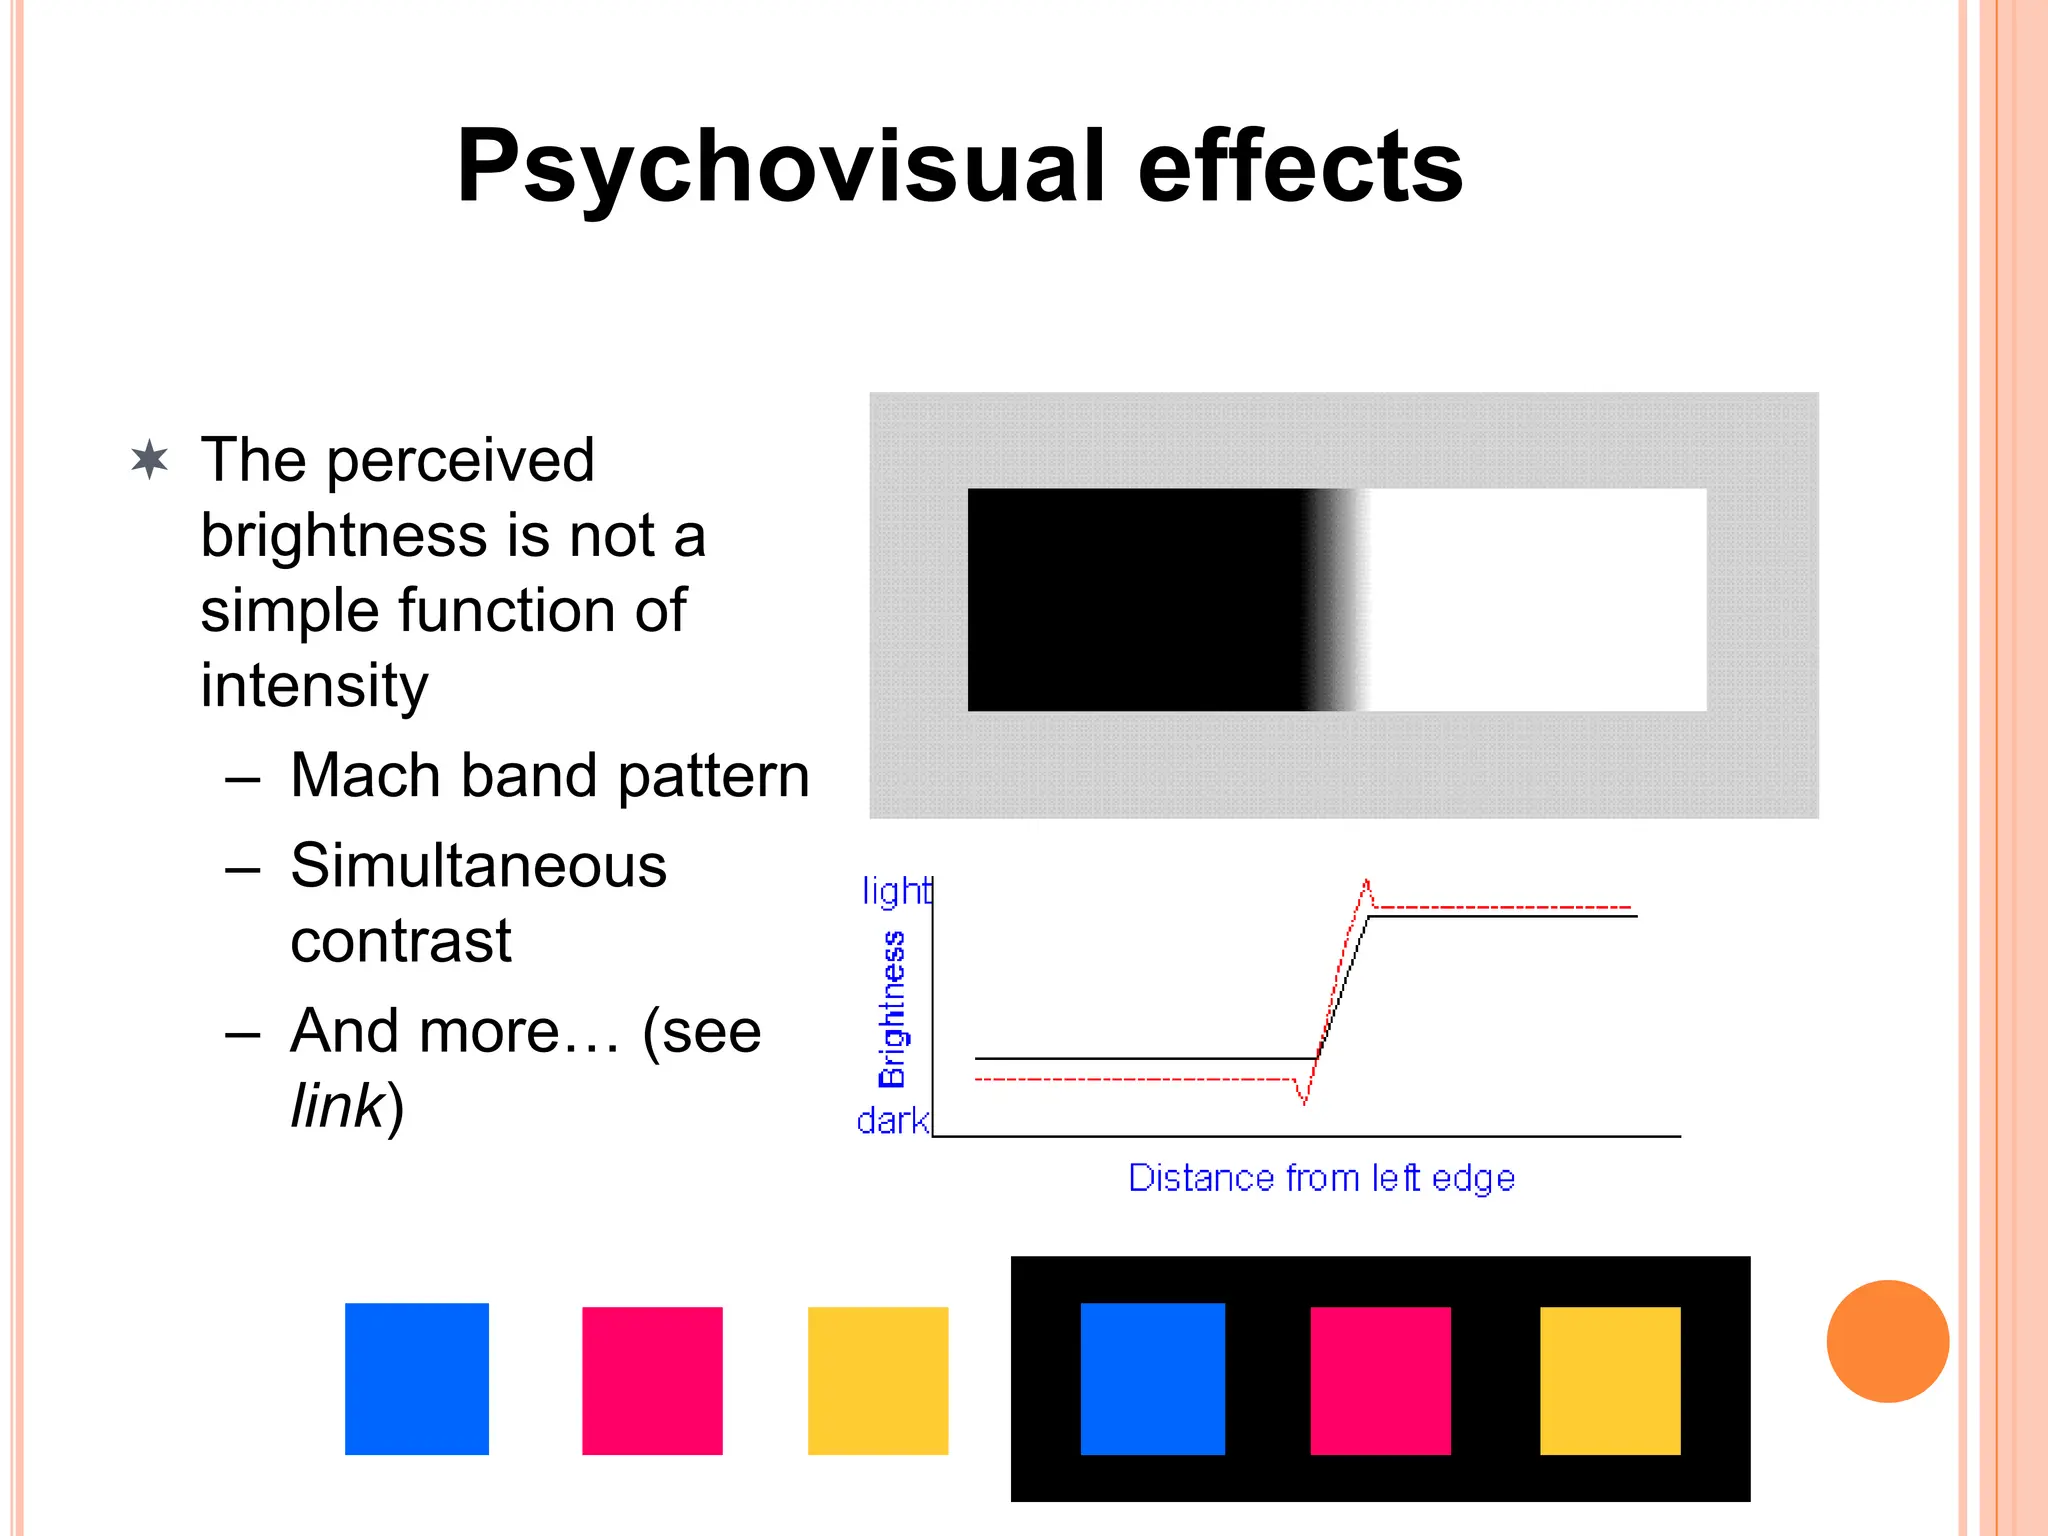
DIGITAL IMAGE PROCESSING
(2ND EDITION)
RAFAEL C. GONZALEZ
RICHARD E.WOODS
1
MISCELLANEA
 Lectures: A
 Monday 1:00 – 3:00
 Tuesday 2:00 – 4:00
 Lectures: B
 Monday 8:00 – 10:00
 Wednesday 1:00 – 3:00
 Slideshare: www.slideshare.net/MoeMoeMyint
 E-mail: moemoemyint@moemyanmar.ml
 Blog: drmoemoemyint.blogspot.com
CONTENTS FOR CHAPTER 2
2.1 Elements of Visual Perception
2.2 Light and the Electromagnetic Spectrum
2.3 Image Sensing and Acquisition
2.4 Image Sampling and Quantization
2.5 Some Basic Relationships Between Pixels
2.6 Linear and Nonlinear Operations
ELEMENTS OF VISUAL PERCEPTION
- Structure of the Human Eye
- Image Formation in the Eye
- Brightness Adaptation and Discrimination
STRUCTURE OF THE HUMAN EYE
Eye characteristics
– nearly spherical
– approximately 20 mm in diameter
– three membranes
• cornea (transparent) & sclera (opaque) outer cover
• choroid contains a network of blood vessels, heavily pigmented to reduce amount
of extraneous light entering the eye. Also contains the iris diaphragm (2-8 mm to
allow variable amount of light into the eye)
• retina is the inner most membrane, objects are imaged on the surface.
RETINAL SURFACE
Retinal surface is covered in discrete light receptors
Two classes
– Cones
• 6-7 million located primarily near the center of the retina (the fovea)
• highly sensitive to color
• can resolve fine details because each is attached to a single nerve ending
• Cone vision is called photopic or bright-light vision
– Rods
• 75-150 million distributed over the retinal surface
• multiple rods connected to a single nerve ending
• give a general overall picture of the field of illumination
• not color sensitive but are sensitive to low levels of illumination
• Rod vision is called scotopic or dim-light vision
Rods are thin cells with slender rodlike projections that are the photoreceptors
for:
Black and white vision
Vision in dim light
Cones are the receptors for:
Color vision
Visual acuity
There are three types of cones, each with a different visual pigment
One sensitive to green light
One sensitive to blue light
One sensitive to red light
The perceived color of an object depends on the quantity and combination of
cones that are stimulated
In very dim light, cones do not function
Color blindness occurs because there is an absence or deficiency of one or
more of the visual pigments in the cones. So the person cannot distinguish
certain colors.
CONT’D…
Pupil allows varying
amounts of light to
enter the eye.
Cornea is a transparent structure that
covers the iris and pupil
Cones are
concentrated in
the center of the
retina - the fovea
Lens helps to focus
light on the retina.
Retina includes
- Rods (94%)
(light sensitive)
- Cones (6%)
(color sensitive)
•Fovea size is 1.5 mm in diameter
•1.5 mm  1.5 mm square contain 337000 cones
5mm  5mm CCD imaging chip
CONT’D…
IMAGE FORMATION IN THE EYE
2.1- Elements of
Visual Perception
2.2- Light and the
Electromagnetic
Spectrum
2.3- Image Sensing
and Acquisition
2.4- Image Sampling
and Quantization
2.5- Some Basic
Relationships
Between Pixels
2.6- An Introduction
to the Mathematical
Tools Used in Digital
Image Processing
The principal difference between the lens of the eyee and an
ordinary optical lens is that the former is flexible.
The radius of curvature of the anterior surface of the lens is
greater than the radius of its posterior or surface.
The shape of the lens is controlled by tension in the fibers of
the ciliary body.
To focus on distant objects, the controlling muscles cause
the lens to be relatively flattened.
Similarly, these muscles allow the lens to become thicker in
order to focus on objects near the eye.
The distance between the center of the lens and the retina
(called the focal length) varies from approximately 17mm to
about 14mm, as the refractive power of the lens increases
from its minimum to its maximum.
When the eye focuses on an object farther away than about
3m, the lens exhibits its lowest refractive power.
When the eye focuses on a nearby object, the lens is most
strongly refractive.
This information makes it easy to calculate the size of the
retinal image of any objects.
Draw an image similar to that below on a piece of paper
(the dot and cross are about 6 inches apart)
Close your right eye and focus on the cross with your left
eye
Hold the image about 20 inches away from your face and
move it slowly towards you
The dot should disappear!
Blind-Spot Experiment
IMAGE FORMATION IN THE EYE
Example:
Calculation of retinal image of an object
15/100=h/17 or h=2.55 mm
- Muscles within the eye can be used to change the shape of the
lens allowing us focus on objects that are near or far away
- An image is focused onto the retina causing rods and cones to
become excited which ultimately send signals to the brain
Light receptor
radiant
energy
electrical
impulses
Brain
BRIGHTNESS ADAPTATION AND
DISCRIMINATION
Range of light intensity levels to which HVS (human
visual system) can adapt: on the order of 1010 _ from the
scotopic threshold to the glare limit.
Subjective brightness (i.e. intensity as perceived by the
HVS) is a logarithmic function of the light intensity
incident on the eye.
• The visual system does not operate simultaneously
over the 1010 range. It accomplishes this large
variation by changes in its overall sensitivity, a
phenomenon known as brightness adaptation.
For any given set of conditions, the current sensitivity
level of HVS is called the brightness adaptation level.
mL = millilambert
CONT’D
• Brightness discrimination is the ability of the eye to discriminate
between changes in light intensity at any specific adaptation level.
• The quantity Ic/I, where Ic is the increment of illumination
discriminable 50% of the time with background illumination I, is
called the Weber ratio. A small value of Weber ratio, means good
brightness discrimination.
The eye also discriminates between changes in brightness at any specific
adaptation level.
ratio
Weber


I
Ic
Where: ∆𝐼𝑐: the increment of illumination discriminable 50% of the time
I : background illumination
Typical Weber ratio
as a function of
intensity
CONT’D
Weber ratio (the experiment) Ic/I
I: the background illumination
Ic : the increment of illumination
Small Weber ratio indicates good discrimination
Larger Weber ratio indicates poor discrimination
• Brightness discrimination is poor at low levels of illumination. The two
branches in the curve indicate that at low levels of illumination vision is
carried out by the rods, whereas at high level by the cones.
Psychovisual effects
 The perceived
brightness is not a
simple function of
intensity
– Mach band pattern
– Simultaneous
contrast
– And more… (see
link)
Two phenomena clearly demonstrate that
perceived brightness is not a simple function of
intensity.
Perceived Brightness
Position
Intensity
AN EXAMPLE OF MACH BAND
First Phenomena
Visual system tends to
undershoot or overshoot
around boundary of
regions of different
intensities.
Intensities of surrounding points
effect perceived brightness at each
point.
In this image, edges between bars
appear brighter on the right side
and darker on the left side.
21
The second phenomena, called simultaneous contrast, a
spot may appears to the eye to become darker as the
background gets lighter.
22
Simultaneous contrast. All small squares have exactly the same intensity
but they appear progressively darker as background becomes lighter.
Brightness Adaptation of Human Eye : Simultaneous Contrast
23
24
OPTICAL ILLUSIONS
25
Optical illusions occurs when the eye fills in non-existing
information or wrongly perceives geometrical properties of
objects.
26
Optical Illusions (cont…)
27
Stare at the cross in
the middle of the
image and think
circles
28
Mind Map Exercise: Mind Mapping For
Note Taking
Beau Lotto: Optical Illusions Show How We See
http://www.ted.com/talks/lang/eng/beau_lotto_optical_illusions_show_how_we_see.html
2.2 LIGHT AND THE ELECTROMAGNETIC
SPECTRUM
29
LIGHT AND THE ELECTROMAGNETIC
SPECTRUM
In 1666, Sir Isaac Newton discovered that when a beam of
sunlight is passed through a glass prism, the emerging beam of
light is not white but consists instead of a continuous spectrum
of colors ranging from violet at one end to red at the other.
The range of colors we perceive in visible light represents a very
small portion of the electromagnetic spectrum.
On one end of the spectrum are radio waves with wavelengths
billions of times longer than those of visible light.
On the other end of the spectrum are gamma rays with
wavelengths millions of times smaller than those of visible light.
30
31
CONT’D
The Wavelength of an Electromagnetic Wave Required to “SEE” an
Object Must be of the Same Size as or Smaller Than the Object.
Fig. The electromagnetic spectrum arranged according to energy per photon
The Electromagnetic Spectrum
32
Light is just a particular part of the electromagnetic spectrum that can be
sensed by the human eye
The electromagnetic spectrum is split up according to the wavelengths of
different forms of energy
33
Reflected Light
The colours that we perceive are determined by the
nature of the light reflected from an object
For example, if white
light is shone onto a
green object most
wavelengths are
absorbed, while green
light is reflected from
the object.
Colours
Absorbed
34
• The colors that humans perceive in an object are determined
by the nature of the light reflected from the object.
• Achromatic or monochromatic light is void of color, and is
described by its intensity (gray level).
• Chromatic light spans the electromagnetic energy spectrum
from 0.43 to 0.79 m, and is described by
 Radiance: Total amount of energy that flows from the
light source, and measured in watts (W)
 Luminance: Measured in lumens (lm), gives a measure
of the amount of energy an observer perceives from a
light source
 Brightness: Subjective descriptor of light perception that
is practically impossible to measure.
Light and the Electromagnetic Spectrum
The electromagnetic spectrum can be expressed in terms
of wavelength (), frequency (), or energy (E).
• h is Planck’s constant.
• The units of wavelength are meters, with the terms
microns and nanometers being used just as
frequently.
• Frequency is measured in Hertz (Hz), with one
Hertz being equal to one cycle of a sinusoidal wave
per second.
• unit of energy is the electron-volt.
=
35
CONT’D
Wavelength (), frequency (), and
energy (E) are related by the
expressions
Electromagnetic waves can be visualized as propagating
sinusoidal waves with wavelength, or they can be
thought of as a stream of mass-less particles, each
traveling in a wavelike pattern and moving at the speed
of light. Each mass-less particle contains a certain
amount (or bundle) of energy. Each bundle of energy is
called a photon.
Energy is proportional to frequency,
Higher-frequency (shorter wavelength)
electromagnetic phenomena carry more energy per
photon.
Gamma rays are so dangerous to living organisms.
36
CONT’D
Light is a particular type of electromagnetic radiation that
can be seen and sensed by the human eye.
The visible band of the electromagnetic spectrum spans
the range from approximately 0.43 micro m (violet) to
about 0.79 micro m (red).
For convenience, the color spectrum is divided into six
broad regions: Violet, Blue, Green, Yellow, Orange, and
Red.
37
CONT’D
THE ORIGINS OF DIGITAL IMAGE
PROCESSING (COLOR)
The colors that humans perceive in an object are
determined by the nature of the light reflected from the
object.
A body that reflects light and is relatively balanced in all
visible wavelengths appears white to the observer.
A body that favors reflectance in a limited range of the
visible spectrum exhibits some shades of color.
For example, green objects reflect light with
wavelengths primarily in the 500 to 570 nm range
while absorbing most of the energy at other
wavelengths.
38
THE ORIGINS OF DIGITAL IMAGE
PROCESSING (ACHROMATIC OR
MONOCHROMATIC)
Light that is void of color is called achromatic or
monochromatic light.
The only attribute of such light is its intensity, or
amount.
The term gray level generally is used to describe
monochromatic intensity because it ranges from black,
to grays, and finally to white.
39
THE ORIGINS OF DIGITAL IMAGE
PROCESSING (CHROMATIC LIGHT)
Radiance is the total amount of energy that flows from the light
source, and it is usually measured in watts (W).
Luminance, measured in lumens (lm), gives a measure of the
amount of energy an observer perceives from a light source.
For example, light emitted from a source operating in the far
infrared region of the spectrum could have significant
energy (radiance), but an observer would hardly perceive it;
its luminance would be almost zero.
Brightness is a subjective descriptor of light perception that is
practically impossible to measure. It embodies the achromatic
notion of intensity and is one of the key factors in describing
color sensation.
40
REFERENCES
 “Digital Image Processing”, 2/ E, Rafael C. Gonzalez & Richard
E. Woods, www.prenhall.com/gonzalezwoods.
 Only Original Owner has full rights reserved for copied
images.
 This PPT is only for fair academic use.
41
CHAPTER 2 – NEXT SECTION
(COMING SOON)
42
Questions?

Elements of Visual Perceptions Structure

  • 1.
    DIGITAL IMAGE PROCESSING (2NDEDITION) RAFAEL C. GONZALEZ RICHARD E.WOODS 1
  • 2.
    MISCELLANEA  Lectures: A Monday 1:00 – 3:00  Tuesday 2:00 – 4:00  Lectures: B  Monday 8:00 – 10:00  Wednesday 1:00 – 3:00  Slideshare: www.slideshare.net/MoeMoeMyint  E-mail: moemoemyint@moemyanmar.ml  Blog: drmoemoemyint.blogspot.com
  • 3.
    CONTENTS FOR CHAPTER2 2.1 Elements of Visual Perception 2.2 Light and the Electromagnetic Spectrum 2.3 Image Sensing and Acquisition 2.4 Image Sampling and Quantization 2.5 Some Basic Relationships Between Pixels 2.6 Linear and Nonlinear Operations
  • 4.
    ELEMENTS OF VISUALPERCEPTION - Structure of the Human Eye - Image Formation in the Eye - Brightness Adaptation and Discrimination
  • 5.
    STRUCTURE OF THEHUMAN EYE Eye characteristics – nearly spherical – approximately 20 mm in diameter – three membranes • cornea (transparent) & sclera (opaque) outer cover • choroid contains a network of blood vessels, heavily pigmented to reduce amount of extraneous light entering the eye. Also contains the iris diaphragm (2-8 mm to allow variable amount of light into the eye) • retina is the inner most membrane, objects are imaged on the surface.
  • 6.
    RETINAL SURFACE Retinal surfaceis covered in discrete light receptors Two classes – Cones • 6-7 million located primarily near the center of the retina (the fovea) • highly sensitive to color • can resolve fine details because each is attached to a single nerve ending • Cone vision is called photopic or bright-light vision – Rods • 75-150 million distributed over the retinal surface • multiple rods connected to a single nerve ending • give a general overall picture of the field of illumination • not color sensitive but are sensitive to low levels of illumination • Rod vision is called scotopic or dim-light vision
  • 7.
    Rods are thincells with slender rodlike projections that are the photoreceptors for: Black and white vision Vision in dim light Cones are the receptors for: Color vision Visual acuity There are three types of cones, each with a different visual pigment One sensitive to green light One sensitive to blue light One sensitive to red light The perceived color of an object depends on the quantity and combination of cones that are stimulated In very dim light, cones do not function Color blindness occurs because there is an absence or deficiency of one or more of the visual pigments in the cones. So the person cannot distinguish certain colors. CONT’D…
  • 9.
    Pupil allows varying amountsof light to enter the eye. Cornea is a transparent structure that covers the iris and pupil Cones are concentrated in the center of the retina - the fovea Lens helps to focus light on the retina. Retina includes - Rods (94%) (light sensitive) - Cones (6%) (color sensitive)
  • 10.
    •Fovea size is1.5 mm in diameter •1.5 mm  1.5 mm square contain 337000 cones 5mm  5mm CCD imaging chip CONT’D…
  • 11.
    IMAGE FORMATION INTHE EYE 2.1- Elements of Visual Perception 2.2- Light and the Electromagnetic Spectrum 2.3- Image Sensing and Acquisition 2.4- Image Sampling and Quantization 2.5- Some Basic Relationships Between Pixels 2.6- An Introduction to the Mathematical Tools Used in Digital Image Processing The principal difference between the lens of the eyee and an ordinary optical lens is that the former is flexible. The radius of curvature of the anterior surface of the lens is greater than the radius of its posterior or surface. The shape of the lens is controlled by tension in the fibers of the ciliary body. To focus on distant objects, the controlling muscles cause the lens to be relatively flattened. Similarly, these muscles allow the lens to become thicker in order to focus on objects near the eye. The distance between the center of the lens and the retina (called the focal length) varies from approximately 17mm to about 14mm, as the refractive power of the lens increases from its minimum to its maximum. When the eye focuses on an object farther away than about 3m, the lens exhibits its lowest refractive power. When the eye focuses on a nearby object, the lens is most strongly refractive. This information makes it easy to calculate the size of the retinal image of any objects.
  • 12.
    Draw an imagesimilar to that below on a piece of paper (the dot and cross are about 6 inches apart) Close your right eye and focus on the cross with your left eye Hold the image about 20 inches away from your face and move it slowly towards you The dot should disappear! Blind-Spot Experiment
  • 14.
    IMAGE FORMATION INTHE EYE Example: Calculation of retinal image of an object 15/100=h/17 or h=2.55 mm - Muscles within the eye can be used to change the shape of the lens allowing us focus on objects that are near or far away - An image is focused onto the retina causing rods and cones to become excited which ultimately send signals to the brain Light receptor radiant energy electrical impulses Brain
  • 15.
    BRIGHTNESS ADAPTATION AND DISCRIMINATION Rangeof light intensity levels to which HVS (human visual system) can adapt: on the order of 1010 _ from the scotopic threshold to the glare limit. Subjective brightness (i.e. intensity as perceived by the HVS) is a logarithmic function of the light intensity incident on the eye. • The visual system does not operate simultaneously over the 1010 range. It accomplishes this large variation by changes in its overall sensitivity, a phenomenon known as brightness adaptation. For any given set of conditions, the current sensitivity level of HVS is called the brightness adaptation level. mL = millilambert
  • 16.
    CONT’D • Brightness discriminationis the ability of the eye to discriminate between changes in light intensity at any specific adaptation level. • The quantity Ic/I, where Ic is the increment of illumination discriminable 50% of the time with background illumination I, is called the Weber ratio. A small value of Weber ratio, means good brightness discrimination. The eye also discriminates between changes in brightness at any specific adaptation level. ratio Weber   I Ic Where: ∆𝐼𝑐: the increment of illumination discriminable 50% of the time I : background illumination
  • 17.
    Typical Weber ratio asa function of intensity CONT’D Weber ratio (the experiment) Ic/I I: the background illumination Ic : the increment of illumination Small Weber ratio indicates good discrimination Larger Weber ratio indicates poor discrimination • Brightness discrimination is poor at low levels of illumination. The two branches in the curve indicate that at low levels of illumination vision is carried out by the rods, whereas at high level by the cones.
  • 18.
    Psychovisual effects  Theperceived brightness is not a simple function of intensity – Mach band pattern – Simultaneous contrast – And more… (see link)
  • 19.
    Two phenomena clearlydemonstrate that perceived brightness is not a simple function of intensity. Perceived Brightness Position Intensity
  • 20.
    AN EXAMPLE OFMACH BAND First Phenomena Visual system tends to undershoot or overshoot around boundary of regions of different intensities. Intensities of surrounding points effect perceived brightness at each point. In this image, edges between bars appear brighter on the right side and darker on the left side.
  • 21.
    21 The second phenomena,called simultaneous contrast, a spot may appears to the eye to become darker as the background gets lighter.
  • 22.
    22 Simultaneous contrast. Allsmall squares have exactly the same intensity but they appear progressively darker as background becomes lighter. Brightness Adaptation of Human Eye : Simultaneous Contrast
  • 23.
  • 24.
  • 25.
    OPTICAL ILLUSIONS 25 Optical illusionsoccurs when the eye fills in non-existing information or wrongly perceives geometrical properties of objects.
  • 26.
  • 27.
    27 Stare at thecross in the middle of the image and think circles
  • 28.
    28 Mind Map Exercise:Mind Mapping For Note Taking Beau Lotto: Optical Illusions Show How We See http://www.ted.com/talks/lang/eng/beau_lotto_optical_illusions_show_how_we_see.html
  • 29.
    2.2 LIGHT ANDTHE ELECTROMAGNETIC SPECTRUM 29
  • 30.
    LIGHT AND THEELECTROMAGNETIC SPECTRUM In 1666, Sir Isaac Newton discovered that when a beam of sunlight is passed through a glass prism, the emerging beam of light is not white but consists instead of a continuous spectrum of colors ranging from violet at one end to red at the other. The range of colors we perceive in visible light represents a very small portion of the electromagnetic spectrum. On one end of the spectrum are radio waves with wavelengths billions of times longer than those of visible light. On the other end of the spectrum are gamma rays with wavelengths millions of times smaller than those of visible light. 30
  • 31.
    31 CONT’D The Wavelength ofan Electromagnetic Wave Required to “SEE” an Object Must be of the Same Size as or Smaller Than the Object.
  • 32.
    Fig. The electromagneticspectrum arranged according to energy per photon The Electromagnetic Spectrum 32 Light is just a particular part of the electromagnetic spectrum that can be sensed by the human eye The electromagnetic spectrum is split up according to the wavelengths of different forms of energy
  • 33.
    33 Reflected Light The coloursthat we perceive are determined by the nature of the light reflected from an object For example, if white light is shone onto a green object most wavelengths are absorbed, while green light is reflected from the object. Colours Absorbed
  • 34.
    34 • The colorsthat humans perceive in an object are determined by the nature of the light reflected from the object. • Achromatic or monochromatic light is void of color, and is described by its intensity (gray level). • Chromatic light spans the electromagnetic energy spectrum from 0.43 to 0.79 m, and is described by  Radiance: Total amount of energy that flows from the light source, and measured in watts (W)  Luminance: Measured in lumens (lm), gives a measure of the amount of energy an observer perceives from a light source  Brightness: Subjective descriptor of light perception that is practically impossible to measure. Light and the Electromagnetic Spectrum
  • 35.
    The electromagnetic spectrumcan be expressed in terms of wavelength (), frequency (), or energy (E). • h is Planck’s constant. • The units of wavelength are meters, with the terms microns and nanometers being used just as frequently. • Frequency is measured in Hertz (Hz), with one Hertz being equal to one cycle of a sinusoidal wave per second. • unit of energy is the electron-volt. = 35 CONT’D Wavelength (), frequency (), and energy (E) are related by the expressions
  • 36.
    Electromagnetic waves canbe visualized as propagating sinusoidal waves with wavelength, or they can be thought of as a stream of mass-less particles, each traveling in a wavelike pattern and moving at the speed of light. Each mass-less particle contains a certain amount (or bundle) of energy. Each bundle of energy is called a photon. Energy is proportional to frequency, Higher-frequency (shorter wavelength) electromagnetic phenomena carry more energy per photon. Gamma rays are so dangerous to living organisms. 36 CONT’D
  • 37.
    Light is aparticular type of electromagnetic radiation that can be seen and sensed by the human eye. The visible band of the electromagnetic spectrum spans the range from approximately 0.43 micro m (violet) to about 0.79 micro m (red). For convenience, the color spectrum is divided into six broad regions: Violet, Blue, Green, Yellow, Orange, and Red. 37 CONT’D
  • 38.
    THE ORIGINS OFDIGITAL IMAGE PROCESSING (COLOR) The colors that humans perceive in an object are determined by the nature of the light reflected from the object. A body that reflects light and is relatively balanced in all visible wavelengths appears white to the observer. A body that favors reflectance in a limited range of the visible spectrum exhibits some shades of color. For example, green objects reflect light with wavelengths primarily in the 500 to 570 nm range while absorbing most of the energy at other wavelengths. 38
  • 39.
    THE ORIGINS OFDIGITAL IMAGE PROCESSING (ACHROMATIC OR MONOCHROMATIC) Light that is void of color is called achromatic or monochromatic light. The only attribute of such light is its intensity, or amount. The term gray level generally is used to describe monochromatic intensity because it ranges from black, to grays, and finally to white. 39
  • 40.
    THE ORIGINS OFDIGITAL IMAGE PROCESSING (CHROMATIC LIGHT) Radiance is the total amount of energy that flows from the light source, and it is usually measured in watts (W). Luminance, measured in lumens (lm), gives a measure of the amount of energy an observer perceives from a light source. For example, light emitted from a source operating in the far infrared region of the spectrum could have significant energy (radiance), but an observer would hardly perceive it; its luminance would be almost zero. Brightness is a subjective descriptor of light perception that is practically impossible to measure. It embodies the achromatic notion of intensity and is one of the key factors in describing color sensation. 40
  • 41.
    REFERENCES  “Digital ImageProcessing”, 2/ E, Rafael C. Gonzalez & Richard E. Woods, www.prenhall.com/gonzalezwoods.  Only Original Owner has full rights reserved for copied images.  This PPT is only for fair academic use. 41
  • 42.
    CHAPTER 2 –NEXT SECTION (COMING SOON) 42 Questions?

Editor's Notes

  • #7 Rods are thin cells with slender rodlike projections that are the photoreceptors for: Black and white vision Vision in dim light
  • #16 The visual system does not operate simultaneously over the 1010 range. It accomplishes this large variation by changes in its overall sensitivity, a phenomenon known as brightness adaptation. The human visual system can perceive approximately 1010 different light intensity levels However, at any one time we can only discriminate between a much smaller number – brightness adaptation Similarly, the perceived intensity of a region is related to the light intensities of the regions surrounding it