library(tidyr) and library(ggplot2)
•Download as DOCX, PDF•
0 likes•104 views

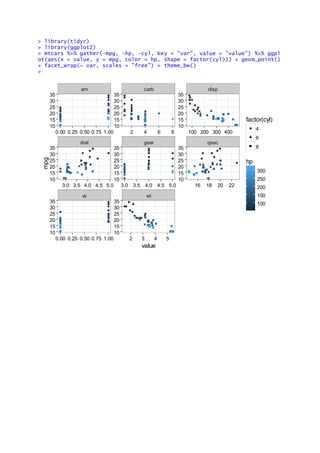
The document loads libraries and plots data from the mtcars dataset. It uses gather() to reshape the data and plot mpg vs other variables like hp, cyl, and wt, facetted by each variable. It then plots mpg vs each variable with stat_smooth() added.
Report
Share
Report
Share

Recommended
Jordina Vidal, Oriol Vidal Enginyeria, Barcelona, Spain.
This document summarizes research on building simulations and monitoring of two research buildings at UAB campus. Active strategies were used to optimize energy demand including daylight analysis, comfort simulations, and CFD ventilation simulations. A holistic approach considered energy, materials, water, and waste. Results from building management systems and sensors were analyzed regarding energy and water consumption and compared to simulations. Ongoing work involves using consumption data to optimize building performance.
Tugasan 9: PISAH RAGAMAN
The document discusses modeling the probability of public transportation use based on parking rates using a logistic function. It presents the logistic function model, plots the logistic curve of probability versus parking rate, transforms the data to linearize it for regression, fits a regression line with an R-squared value of 0.9834, and extracts the alpha and C parameters from the regression equation to complete the logistic function model.
Tugasan 9 Pisah Ragaman (A168202)
1. The document presents the results of a study modeling the probability of switching to public transportation based on parking rates. Logistic regression was used to develop a model linking the log odds of switching to parking rates.
2. A logistic regression model was also developed relating the probability of switching to public transportation to mining costs and time savings from using public transit. The model found parking rates had a positive effect while time savings had a negative effect on the log odds of switching.
3. The parameters estimated for both logistic regression models - including the coefficients for each predictor variable - are presented to allow calculation of the probability of switching to public transportation based on the developed models.
A169571 tugasan pisah ragaman
1. The document describes building a logistic regression model to predict the probability of commuters switching to public transportation based on parking rates. Data is plotted and transformed, and a logistic regression equation is fitted with parameters α=-0.9623 and C=3.5107. This model is used to predict probabilities for various parking rates.
2. A multiple logistic regression model is built to predict the probability of commuters switching to buses based on parking rates and bus subsidies. Data is transformed and separate regressions are performed on parking rates and subsidies. The final multiple logistic regression model is reported with parameters α=-0.0705, β=0.982, and C=2.4976.
3.
1
This document contains two MATLAB programs. The first program calculates the optimal cross-sectional area of an electrical conductor by plotting resistance, capacitance, and total cost against varying area. The second program plots fuel cost, heat rate, and incremental cost against changing power plant output to find the minimum incremental cost.
Adder Presentation
The document discusses different types of single-bit adders and multi-bit adders built from them. It describes half adders, full adders, ripple carry adders and their delay properties. It then discusses different advanced adder circuits like carry lookahead adders, carry skip adders, carry select adders and carry save adders to reduce the delay. Verilog code examples are provided for full adders, ripple carry adders, carry lookahead adders and carry skip adders.
as400 built in function- %HOURS
The %HOURS function converts a number into a duration that can be added to or subtracted from a time or timestamp value. It is used to add or subtract a specified number of hours. The example shows initializing two timestamp variables, adding 2 hours to one and subtracting 2 hours from the other using %HOURS, and displaying the results.
Carry save addition
Carry-save addition allows three n-bit numbers to be added together in O(1) time by computing the sum and carry independently and in parallel. It works by using a carry-save adder (CSA) block for each bit position. A CSA block takes in three bits and outputs their sum and carry without propagating the carry. Multiple CSA blocks can be chained or arranged in a Wallace tree to add many numbers. Using a chain takes O(m + lg(n+m)) time while a Wallace tree takes O(logm + lg(n+logm)) time to add m n-bit numbers.
calculo de espaciamiento de pozos petroleros por el método de Tozzini
This document calculates the optimal spacing between wells using the Tozzini method. It provides calculations for two scenarios:
1) With a present value of water of $170.52/m3, the optimal well spacing is 522.69 meters on a surface area of 21.4575 hectares.
2) With a present value of $629/m3, the optimal spacing is 341.44 meters on a surface area of 9.1562 hectares.
Queuing theory 5
Written while studying the course Advanced Computer Networks:
Queuing theory 5
Queueing theory is the mathematical study of waiting lines, or queues.[1] A queueing model is constructed so that queue lengths and waiting time can be predicted.[1] Queueing theory is generally considered a branch of operations research because the results are often used when making business decisions about the resources needed to provide a service.
as400 built in function- %MINUTES
The %MINUTES function converts a number to a duration in minutes that can be added to or subtracted from a time or timestamp value. In the example, %MINUTES(2) is used to add 2 minutes to the TIME0 variable and subtract 2 minutes from the TIMESTP0 variable, demonstrating how %MINUTES can adjust time values.
Queuing theory 6 : Notes
Written while studying the course Advanced Computer Networks:
Queuing theory 6
Queueing theory is the mathematical study of waiting lines, or queues.[1] A queueing model is constructed so that queue lengths and waiting time can be predicted.[1] Queueing theory is generally considered a branch of operations research because the results are often used when making business decisions about the resources needed to provide a service.
program on Function overloading in java
The document defines a Sum class with three overloaded add() methods that take in different parameter types (two ints, three ints, and an int and float) and return the sum. It then creates a main method in an Overloading class that creates a Sum object and calls each add() method, passing different parameters to demonstrate function overloading.
Digital logic circuit
This document discusses types of adders and provides details on half adders and full adders. It begins by identifying half adders and full adders as types of adders. It explains that digital computers perform arithmetic operations like addition and the basic operation is adding two binary digits. When adding more than two bits, the operation is called a full adder. Truth tables are provided for half adders and full adders. The document then shows the simplified sum of products form for a full adder using K-maps and provides the logic diagram. It concludes with assigning short notes on topics like manufacturing testing, functional testing, files and text I/O, and differentiating CPLD and FPGA architectures.
Gssl
final Year Projects, Final Year Projects in Chennai, Software Projects, Embedded Projects, Microcontrollers Projects, DSP Projects, VLSI Projects, Matlab Projects, Java Projects, .NET Projects, IEEE Projects, IEEE 2009 Projects, IEEE 2009 Projects, Software, IEEE 2009 Projects, Embedded, Software IEEE 2009 Projects, Embedded IEEE 2009 Projects, Final Year Project Titles, Final Year Project Reports, Final Year Project Review, Robotics Projects, Mechanical Projects, Electrical Projects, Power Electronics Projects, Power System Projects, Model Projects, Java Projects, J2EE Projects, Engineering Projects, Student Projects, Engineering College Projects, MCA Projects, BE Projects, BTech Projects, ME Projects, MTech Projects, Wireless Networks Projects, Network Security Projects, Networking Projects, final year projects, ieee projects, student projects, college projects, ieee projects in chennai, java projects, software ieee projects, embedded ieee projects, "ieee2009projects", "final year projects", "ieee projects", "Engineering Projects", "Final Year Projects in Chennai", "Final year Projects at Chennai", Java Projects, ASP.NET Projects, VB.NET Projects, C# Projects, Visual C++ Projects, Matlab Projects, NS2 Projects, C Projects, Microcontroller Projects, ATMEL Projects, PIC Projects, ARM Projects, DSP Projects, VLSI Projects, FPGA Projects, CPLD Projects, Power Electronics Projects, Electrical Projects, Robotics Projects, Solor Projects, MEMS Projects, J2EE Projects, J2ME Projects, AJAX Projects, Structs Projects, EJB Projects, Real Time Projects, Live Projects, Student Projects, Engineering Projects, MCA Projects, MBA Projects, College Projects, BE Projects, BTech Projects, ME Projects, MTech Projects, M.Sc Projects, Final Year Java Projects, Final Year ASP.NET Projects, Final Year VB.NET Projects, Final Year C# Projects, Final Year Visual C++ Projects, Final Year Matlab Projects, Final Year NS2 Projects, Final Year C Projects, Final Year Microcontroller Projects, Final Year ATMEL Projects, Final Year PIC Projects, Final Year ARM Projects, Final Year DSP Projects, Final Year VLSI Projects, Final Year FPGA Projects, Final Year CPLD Projects, Final Year Power Electronics Projects, Final Year Electrical Projects, Final Year Robotics Projects, Final Year Solor Projects, Final Year MEMS Projects, Final Year J2EE Projects, Final Year J2ME Projects, Final Year AJAX Projects, Final Year Structs Projects, Final Year EJB Projects, Final Year Real Time Projects, Final Year Live Projects, Final Year Student Projects, Final Year Engineering Projects, Final Year MCA Projects, Final Year MBA Projects, Final Year College Projects, Final Year BE Projects, Final Year BTech Projects, Final Year ME Projects, Final Year MTech Projects, Final Year M.Sc Projects, IEEE Java Projects, ASP.NET Projects, VB.NET Projects, C# Projects, Visual C++ Projects, Matlab Projects, NS2 Projects, C Projects, Microcontroller Projects, ATMEL Projects, PIC Projects, ARM Projects, DSP Projects, VLSI Projects, FPGA Projects, CPLD Projects, Power Electronics Projects, Electrical Projects, Robotics Projects, Solor Projects, MEMS Projects, J2EE Projects, J2ME Projects, AJAX Projects, Structs Projects, EJB Projects, Real Time Projects, Live Projects, Student Projects, Engineering Projects, MCA Projects, MBA Projects, College Projects, BE Projects, BTech Projects, ME Projects, MTech Projects, M.Sc Projects, IEEE 2009 Java Projects, IEEE 2009 ASP.NET Projects, IEEE 2009 VB.NET Projects, IEEE 2009 C# Projects, IEEE 2009 Visual C++ Projects, IEEE 2009 Matlab Projects, IEEE 2009 NS2 Projects, IEEE 2009 C Projects, IEEE 2009 Microcontroller Projects, IEEE 2009 ATMEL Projects, IEEE 2009 PIC Projects, IEEE 2009 ARM Projects, IEEE 2009 DSP Projects, IEEE 2009 VLSI Projects, IEEE 2009 FPGA Projects, IEEE 2009 CPLD Projects, IEEE 2009 Power Electronics Projects, IEEE 2009 Electrical Projects, IEEE 2009 Robotics Projects, IEEE 2009 Solor Projects, IEEE 2009 MEMS Projects, IEEE 2009 J2EE P
Operational management of a centrifugal slurry pump
Keywords: centrifugal pumps; CFD; computational fluid dynamics; FLUENT; one way ANOVA; meshing; GAMBIT; head; large eddy simulation; LES; k-epsilon; k-omega; simulation; operations management; slurry pumps; strategic modelling; turbulence models; fluid flow.
Peak shaving of an EV Aggregator Using Quadratic Programming
This document provides an overview of a project in Daegu, Korea that uses an electric vehicle (EV) aggregator to reduce peak energy demand through quadratic programming algorithms. The project involves an energy storage system, photovoltaics, EV fast and slow chargers, and integrated smart metering. Simulation case studies show the algorithms can reduce energy costs by an average of 62% and peak demand by 61% compared to no scheduling. Future work will upgrade the algorithms to consider probabilistic forecasting and add new charging modes balancing grid and user needs.
Tugasan pisah ragaman (a168892)
1. The document presents a logistic regression model to analyze the probability of individuals switching from private transportation to public transportation based on parking rates.
2. A logistic function is fitted to the data and parameters α and C are estimated. The model shows a high goodness of fit (R2 = 0.9834).
3. The methodology is then applied to analyze switching from private to public transportation based on bus fare discounts and reduced travel time. A multiple logistic regression model is developed relating probability of switching to fare and time.
0861 Differential Efficiencies under the System of Rice Intensification: Prel...
0861 Differential Efficiencies under the System of Rice Intensification: Prel...SRI-Rice, Dept. of Global Development, CALS, Cornell University
This document analyzes the technical, allocative, and economic efficiencies of farmers using the System of Rice Intensification (SRI) method versus conventional rice farming in Tamil Nadu, India. Key findings include:
- SRI farms had higher average technical (92%), allocative (76%), and economic (70%) efficiencies compared to conventional farms (73%, 35%, and 25% respectively).
- While SRI reduced some input costs like seeds, fertilizer, and water use, total production costs were only 6.4% lower for SRI farms. Increased yields of 21.7% primarily made SRI more profitable.
- More research is needed on further reducing SRI costs andA NEW VSAT LINK ABNALYSIS
This document analyzes the link parameters for a new VSAT system used for air defense applications. It describes the transmitter and receiver parameters for the missile, satellite, and ground station. It then calculates the uplink and downlink carrier-to-noise ratios and Eb/No through link budget calculations using the given parameters. The analysis finds that the overall downlink C/N is 87.5 dB and the available Eb/No is 30.5 dB, meeting requirements for the system.
Img 0003
1) The document contains mathematical equations involving variables like x, y, z, a, b.
2) The equations include addition, subtraction, multiplication, division and exponent operations between the variables.
3) Many of the equations set one mathematical expression equal to another more complex expression involving multiple variables.
ggExtra Package-ggMarginal and Example -Shiny and Shinyjs
The document discusses the ggExtra package in R which adds additional geometries and statistical transformations to ggplot2. It provides functions like ggMarginal to add marginal histograms or densities to ggplot2 objects. It also discusses the shinyjs package which allows users to easily improve user interaction and experience in Shiny apps through JavaScript. Examples are provided to demonstrate adding click handlers, toggling elements, and resetting forms using shinyjs functions.
Optimization and Mathematical Programming in R and ROI - R Optimization Infra...
Optimization and Mathematical Programming in R and
ROI - R Optimization Infrastructure.
prepared by Volkan OBAN
Plot3D Package and Example in R.-Data visualizat,on
reference:http://www.sthda.com/english/wiki/impressive-package-for-3d-and-4d-graph-r-software-and-data-visualization
prepared by Volkan OBAN
Ggmap Packages in R
This document provides examples of code using the ggmap package in R to download maps from various online sources and manipulate them. It shows how to:
1. Download static maps from Google Maps and OpenStreetMaps for specified locations and zoom levels.
2. Overlay points on a map of Europe using coordinates from geocoded locations.
3. Extract the bounding box of coordinates and plot a region of the world map within those bounds.
BOXPLOT EXAMPLES in R And An Example for BEESWARM:
This document provides examples of using R code to create boxplots and beeswarm plots from sample datasets. It includes:
1) Code to create a basic boxplot of ozone levels from the airquality dataset and customize aspects like colors, labels, and orientation.
2) Examples demonstrating how to create multiple boxplots for comparison and boxplots using other datasets with different numbers of variables.
3) Code for a beeswarm plot showing three groups of random data with different underlying distributions, customized with colors and labels.
A Shiny Example-- R
shiny Example in R.
source:https://plot.ly/r/shiny-coupled-hover-events/
prepared by Volkan OBAN
Produce nice outputs for graphical, tabular and textual reporting in R-Report...
REFERENCE:
http://davidgohel.github.io/ReporteRs/lists.html
ReporteRs is an R package for creating Microsoft (Word docx and Powerpoint pptx) and html documents. It does not require any Microsoft component to be used. It runs on Windows, Linux, Unix and Mac OS systems. This is the ideal tool to automate reporting generation from R.
Logistic Regression in R-An Exmple.
Logistic Regression in R-An Exmple.
Reference: http://datascienceplus.com/perform-logistic-regression-in-r/
Prepared by VOLKAN OBAN
Plot3D package in R-package-for-3d-and-4d-graph-Data visualization.
This document provides examples of using the Plot3D package in R to create 3D plots and visualizations. It includes examples of plotting 3D text labels, histograms, arrows, scatter plots and adding regression planes to visualize relationships between variables in 3D space. Functions demonstrated include text3D(), hist3D(), arrows3D(), and scatter3D(). Real data sets like iris and mtcars are used for illustrative examples.
More Related Content
What's hot
calculo de espaciamiento de pozos petroleros por el método de Tozzini
This document calculates the optimal spacing between wells using the Tozzini method. It provides calculations for two scenarios:
1) With a present value of water of $170.52/m3, the optimal well spacing is 522.69 meters on a surface area of 21.4575 hectares.
2) With a present value of $629/m3, the optimal spacing is 341.44 meters on a surface area of 9.1562 hectares.
Queuing theory 5
Written while studying the course Advanced Computer Networks:
Queuing theory 5
Queueing theory is the mathematical study of waiting lines, or queues.[1] A queueing model is constructed so that queue lengths and waiting time can be predicted.[1] Queueing theory is generally considered a branch of operations research because the results are often used when making business decisions about the resources needed to provide a service.
as400 built in function- %MINUTES
The %MINUTES function converts a number to a duration in minutes that can be added to or subtracted from a time or timestamp value. In the example, %MINUTES(2) is used to add 2 minutes to the TIME0 variable and subtract 2 minutes from the TIMESTP0 variable, demonstrating how %MINUTES can adjust time values.
Queuing theory 6 : Notes
Written while studying the course Advanced Computer Networks:
Queuing theory 6
Queueing theory is the mathematical study of waiting lines, or queues.[1] A queueing model is constructed so that queue lengths and waiting time can be predicted.[1] Queueing theory is generally considered a branch of operations research because the results are often used when making business decisions about the resources needed to provide a service.
program on Function overloading in java
The document defines a Sum class with three overloaded add() methods that take in different parameter types (two ints, three ints, and an int and float) and return the sum. It then creates a main method in an Overloading class that creates a Sum object and calls each add() method, passing different parameters to demonstrate function overloading.
Digital logic circuit
This document discusses types of adders and provides details on half adders and full adders. It begins by identifying half adders and full adders as types of adders. It explains that digital computers perform arithmetic operations like addition and the basic operation is adding two binary digits. When adding more than two bits, the operation is called a full adder. Truth tables are provided for half adders and full adders. The document then shows the simplified sum of products form for a full adder using K-maps and provides the logic diagram. It concludes with assigning short notes on topics like manufacturing testing, functional testing, files and text I/O, and differentiating CPLD and FPGA architectures.
Gssl
final Year Projects, Final Year Projects in Chennai, Software Projects, Embedded Projects, Microcontrollers Projects, DSP Projects, VLSI Projects, Matlab Projects, Java Projects, .NET Projects, IEEE Projects, IEEE 2009 Projects, IEEE 2009 Projects, Software, IEEE 2009 Projects, Embedded, Software IEEE 2009 Projects, Embedded IEEE 2009 Projects, Final Year Project Titles, Final Year Project Reports, Final Year Project Review, Robotics Projects, Mechanical Projects, Electrical Projects, Power Electronics Projects, Power System Projects, Model Projects, Java Projects, J2EE Projects, Engineering Projects, Student Projects, Engineering College Projects, MCA Projects, BE Projects, BTech Projects, ME Projects, MTech Projects, Wireless Networks Projects, Network Security Projects, Networking Projects, final year projects, ieee projects, student projects, college projects, ieee projects in chennai, java projects, software ieee projects, embedded ieee projects, "ieee2009projects", "final year projects", "ieee projects", "Engineering Projects", "Final Year Projects in Chennai", "Final year Projects at Chennai", Java Projects, ASP.NET Projects, VB.NET Projects, C# Projects, Visual C++ Projects, Matlab Projects, NS2 Projects, C Projects, Microcontroller Projects, ATMEL Projects, PIC Projects, ARM Projects, DSP Projects, VLSI Projects, FPGA Projects, CPLD Projects, Power Electronics Projects, Electrical Projects, Robotics Projects, Solor Projects, MEMS Projects, J2EE Projects, J2ME Projects, AJAX Projects, Structs Projects, EJB Projects, Real Time Projects, Live Projects, Student Projects, Engineering Projects, MCA Projects, MBA Projects, College Projects, BE Projects, BTech Projects, ME Projects, MTech Projects, M.Sc Projects, Final Year Java Projects, Final Year ASP.NET Projects, Final Year VB.NET Projects, Final Year C# Projects, Final Year Visual C++ Projects, Final Year Matlab Projects, Final Year NS2 Projects, Final Year C Projects, Final Year Microcontroller Projects, Final Year ATMEL Projects, Final Year PIC Projects, Final Year ARM Projects, Final Year DSP Projects, Final Year VLSI Projects, Final Year FPGA Projects, Final Year CPLD Projects, Final Year Power Electronics Projects, Final Year Electrical Projects, Final Year Robotics Projects, Final Year Solor Projects, Final Year MEMS Projects, Final Year J2EE Projects, Final Year J2ME Projects, Final Year AJAX Projects, Final Year Structs Projects, Final Year EJB Projects, Final Year Real Time Projects, Final Year Live Projects, Final Year Student Projects, Final Year Engineering Projects, Final Year MCA Projects, Final Year MBA Projects, Final Year College Projects, Final Year BE Projects, Final Year BTech Projects, Final Year ME Projects, Final Year MTech Projects, Final Year M.Sc Projects, IEEE Java Projects, ASP.NET Projects, VB.NET Projects, C# Projects, Visual C++ Projects, Matlab Projects, NS2 Projects, C Projects, Microcontroller Projects, ATMEL Projects, PIC Projects, ARM Projects, DSP Projects, VLSI Projects, FPGA Projects, CPLD Projects, Power Electronics Projects, Electrical Projects, Robotics Projects, Solor Projects, MEMS Projects, J2EE Projects, J2ME Projects, AJAX Projects, Structs Projects, EJB Projects, Real Time Projects, Live Projects, Student Projects, Engineering Projects, MCA Projects, MBA Projects, College Projects, BE Projects, BTech Projects, ME Projects, MTech Projects, M.Sc Projects, IEEE 2009 Java Projects, IEEE 2009 ASP.NET Projects, IEEE 2009 VB.NET Projects, IEEE 2009 C# Projects, IEEE 2009 Visual C++ Projects, IEEE 2009 Matlab Projects, IEEE 2009 NS2 Projects, IEEE 2009 C Projects, IEEE 2009 Microcontroller Projects, IEEE 2009 ATMEL Projects, IEEE 2009 PIC Projects, IEEE 2009 ARM Projects, IEEE 2009 DSP Projects, IEEE 2009 VLSI Projects, IEEE 2009 FPGA Projects, IEEE 2009 CPLD Projects, IEEE 2009 Power Electronics Projects, IEEE 2009 Electrical Projects, IEEE 2009 Robotics Projects, IEEE 2009 Solor Projects, IEEE 2009 MEMS Projects, IEEE 2009 J2EE P
Operational management of a centrifugal slurry pump
Keywords: centrifugal pumps; CFD; computational fluid dynamics; FLUENT; one way ANOVA; meshing; GAMBIT; head; large eddy simulation; LES; k-epsilon; k-omega; simulation; operations management; slurry pumps; strategic modelling; turbulence models; fluid flow.
Peak shaving of an EV Aggregator Using Quadratic Programming
This document provides an overview of a project in Daegu, Korea that uses an electric vehicle (EV) aggregator to reduce peak energy demand through quadratic programming algorithms. The project involves an energy storage system, photovoltaics, EV fast and slow chargers, and integrated smart metering. Simulation case studies show the algorithms can reduce energy costs by an average of 62% and peak demand by 61% compared to no scheduling. Future work will upgrade the algorithms to consider probabilistic forecasting and add new charging modes balancing grid and user needs.
Tugasan pisah ragaman (a168892)
1. The document presents a logistic regression model to analyze the probability of individuals switching from private transportation to public transportation based on parking rates.
2. A logistic function is fitted to the data and parameters α and C are estimated. The model shows a high goodness of fit (R2 = 0.9834).
3. The methodology is then applied to analyze switching from private to public transportation based on bus fare discounts and reduced travel time. A multiple logistic regression model is developed relating probability of switching to fare and time.
0861 Differential Efficiencies under the System of Rice Intensification: Prel...
0861 Differential Efficiencies under the System of Rice Intensification: Prel...SRI-Rice, Dept. of Global Development, CALS, Cornell University
This document analyzes the technical, allocative, and economic efficiencies of farmers using the System of Rice Intensification (SRI) method versus conventional rice farming in Tamil Nadu, India. Key findings include:
- SRI farms had higher average technical (92%), allocative (76%), and economic (70%) efficiencies compared to conventional farms (73%, 35%, and 25% respectively).
- While SRI reduced some input costs like seeds, fertilizer, and water use, total production costs were only 6.4% lower for SRI farms. Increased yields of 21.7% primarily made SRI more profitable.
- More research is needed on further reducing SRI costs andA NEW VSAT LINK ABNALYSIS
This document analyzes the link parameters for a new VSAT system used for air defense applications. It describes the transmitter and receiver parameters for the missile, satellite, and ground station. It then calculates the uplink and downlink carrier-to-noise ratios and Eb/No through link budget calculations using the given parameters. The analysis finds that the overall downlink C/N is 87.5 dB and the available Eb/No is 30.5 dB, meeting requirements for the system.
Img 0003
1) The document contains mathematical equations involving variables like x, y, z, a, b.
2) The equations include addition, subtraction, multiplication, division and exponent operations between the variables.
3) Many of the equations set one mathematical expression equal to another more complex expression involving multiple variables.
What's hot (13)
calculo de espaciamiento de pozos petroleros por el método de Tozzini
calculo de espaciamiento de pozos petroleros por el método de Tozzini
Operational management of a centrifugal slurry pump
Operational management of a centrifugal slurry pump
Peak shaving of an EV Aggregator Using Quadratic Programming
Peak shaving of an EV Aggregator Using Quadratic Programming
0861 Differential Efficiencies under the System of Rice Intensification: Prel...
0861 Differential Efficiencies under the System of Rice Intensification: Prel...
Viewers also liked
ggExtra Package-ggMarginal and Example -Shiny and Shinyjs
The document discusses the ggExtra package in R which adds additional geometries and statistical transformations to ggplot2. It provides functions like ggMarginal to add marginal histograms or densities to ggplot2 objects. It also discusses the shinyjs package which allows users to easily improve user interaction and experience in Shiny apps through JavaScript. Examples are provided to demonstrate adding click handlers, toggling elements, and resetting forms using shinyjs functions.
Optimization and Mathematical Programming in R and ROI - R Optimization Infra...
Optimization and Mathematical Programming in R and
ROI - R Optimization Infrastructure.
prepared by Volkan OBAN
Plot3D Package and Example in R.-Data visualizat,on
reference:http://www.sthda.com/english/wiki/impressive-package-for-3d-and-4d-graph-r-software-and-data-visualization
prepared by Volkan OBAN
Ggmap Packages in R
This document provides examples of code using the ggmap package in R to download maps from various online sources and manipulate them. It shows how to:
1. Download static maps from Google Maps and OpenStreetMaps for specified locations and zoom levels.
2. Overlay points on a map of Europe using coordinates from geocoded locations.
3. Extract the bounding box of coordinates and plot a region of the world map within those bounds.
BOXPLOT EXAMPLES in R And An Example for BEESWARM:
This document provides examples of using R code to create boxplots and beeswarm plots from sample datasets. It includes:
1) Code to create a basic boxplot of ozone levels from the airquality dataset and customize aspects like colors, labels, and orientation.
2) Examples demonstrating how to create multiple boxplots for comparison and boxplots using other datasets with different numbers of variables.
3) Code for a beeswarm plot showing three groups of random data with different underlying distributions, customized with colors and labels.
A Shiny Example-- R
shiny Example in R.
source:https://plot.ly/r/shiny-coupled-hover-events/
prepared by Volkan OBAN
Produce nice outputs for graphical, tabular and textual reporting in R-Report...
REFERENCE:
http://davidgohel.github.io/ReporteRs/lists.html
ReporteRs is an R package for creating Microsoft (Word docx and Powerpoint pptx) and html documents. It does not require any Microsoft component to be used. It runs on Windows, Linux, Unix and Mac OS systems. This is the ideal tool to automate reporting generation from R.
Logistic Regression in R-An Exmple.
Logistic Regression in R-An Exmple.
Reference: http://datascienceplus.com/perform-logistic-regression-in-r/
Prepared by VOLKAN OBAN
Plot3D package in R-package-for-3d-and-4d-graph-Data visualization.
This document provides examples of using the Plot3D package in R to create 3D plots and visualizations. It includes examples of plotting 3D text labels, histograms, arrows, scatter plots and adding regression planes to visualize relationships between variables in 3D space. Functions demonstrated include text3D(), hist3D(), arrows3D(), and scatter3D(). Real data sets like iris and mtcars are used for illustrative examples.
Viewers also liked (9)
ggExtra Package-ggMarginal and Example -Shiny and Shinyjs
ggExtra Package-ggMarginal and Example -Shiny and Shinyjs
Optimization and Mathematical Programming in R and ROI - R Optimization Infra...
Optimization and Mathematical Programming in R and ROI - R Optimization Infra...
Plot3D Package and Example in R.-Data visualizat,on
Plot3D Package and Example in R.-Data visualizat,on
BOXPLOT EXAMPLES in R And An Example for BEESWARM:
BOXPLOT EXAMPLES in R And An Example for BEESWARM:
Produce nice outputs for graphical, tabular and textual reporting in R-Report...
Produce nice outputs for graphical, tabular and textual reporting in R-Report...
Plot3D package in R-package-for-3d-and-4d-graph-Data visualization.
Plot3D package in R-package-for-3d-and-4d-graph-Data visualization.
Similar to library(tidyr) and library(ggplot2)
Applied Regression Analysis using R
This is an analysis of the "Auto" data set from the ISLR (An Introduction to Statistical Learning: with Applications in R) package. The analysis presented here includes the following topics: data manipulation, exploratory data analysis, simple linear regression, correlation matrix, multiple linear regression, model diagnostics, residuals, normality, variance inflation factor (vif) to test for multi collinearity, levearages and modifying the model. Packages used are: ggplot2, xtable and car.
chapter3
This document presents an analysis of automobile data. It begins with data manipulation steps including removing missing data and converting variables to appropriate data types. Exploratory data analysis is conducted through scatter plots and box plots to examine relationships between variables like mileage and weight grouped by cylinders. Simple and multiple linear regression models are fit to predict mileage, and model diagnostics identify violations of assumptions like homoscedasticity. Transforming the response variable to log scale addresses these issues. The modified multiple regression model has the highest R-squared value, indicating it best fits the data.
MH prediction modeling and validation in r (1) regression 190709
Textbook: An Introduction to Statistical Learning
http://faculty.marshall.usc.edu/gareth-james/ISL/
R Programming: Transform/Reshape Data In R
Learn to transform/reshape data in R. This is part of the Working With Data module of the R Programming course by r-squared.
R programming language
This document provides an overview of the R programming language. It describes R as a functional programming language for statistical computing and graphics that is open source and has over 6000 packages. Key features of R discussed include matrix calculation, data visualization, statistical analysis, machine learning, and data manipulation. The document also covers using R Studio as an IDE, reading and writing different data types, programming features like flow control and functions, and examples of correlation, regression, and plotting in R.
Relentless Regression
Constructing regression models using forward selection, backward elimination, and stepwise regression I found the best model that explains the variation in miles per gallon that is predictable from other car characteristics from the dataset mtcars in R
CarProject
This document analyzes data from the mtcars dataset to understand the relationship between transmission type (automatic or manual) and miles per gallon (MPG). Two models are developed: Model 1 uses only transmission type as a predictor, while Model 2 adds additional variables like number of cylinders, displacement, rear axle ratio, and weight. Model 2 explains more of the variance in MPG (83.78% vs 35.98%) and suggests that while manuals may get slightly better gas mileage (0.26 MPG), the transmission type alone has little predictive power. Including other vehicle attributes is necessary to better understand factors influencing a car's MPG.
Linear models
FAO - Global Soil Partnership training on Digital Soil Organic Carbon Mapping by Mr. Yusuf Yigini, 20 - 24 January 2018, Tehran, Iran. (Day 4, 1)
dplyr
The document discusses the dplyr package for R. It provides examples of using dplyr verbs like filter, select, mutate, and summarise to subset and transform data frames. It also demonstrates grouping data with group_by and joining data with inner_join. The key features of dplyr are its simple verbs for filtering, modifying, arranging and summarizing data, its use of piping with %>%, and its convenience for working with tabular data.
Cluto presentation
CLUTO is a software toolkit used for clustering high-dimensional datasets and analyzing cluster characteristics. It contains two main algorithms: Vcluster, which clusters based on the actual multi-dimensional data representation, and Scluster, which clusters based on a pre-computed similarity matrix. CLUTO can be run from the command line with various optional parameters to control the clustering method, analysis, and visualization of results.
Parallel Computing with R
Parallel computing allows breaking problems into independent pieces that can be computed simultaneously across multiple processors. The document discusses using the snow package in R to set up a simple parallel cluster on a single machine and perform operations like bootstrapping in parallel. It also mentions more advanced high performance computing techniques for large memory, compiled code, profiling, and batch scheduling.
12. Linear models
As part of the GSP’s capacity development and improvement programme, FAO/GSP have organised a one week training in Izmir, Turkey. The main goal of the training was to increase the capacity of Turkey on digital soil mapping, new approaches on data collection, data processing and modelling of soil organic carbon. This 5 day training is titled ‘’Training on Digital Soil Organic Carbon Mapping’’ was held in IARTC - International Agricultural Research and Education Center in Menemen, Izmir on 20-25 August, 2017.
11. Linear Models
Simple linear regression uses a single independent variable to predict the value of a dependent variable. Multiple linear regression extends this to use multiple independent variables to predict the dependent variable. The document demonstrates multiple linear regression in R by regressing soil organic carbon (SOC) on elevation, precipitation, and slope using the lm() function. This produces a model object that contains coefficients, residuals, fitted values and other details about the regression model.
Easy HTML Tables in RStudio with Tabyl and kableExtra
This document loads libraries, displays the mtcars dataset header, extracts a subset of the data into a new dataframe, and performs several tabulations and summaries of variables in the mtcars dataset using the tidyverse suite of packages. Key operations include tabulating gear and cyl variables, adding row and column totals, calculating percentages, and formatting outputs for presentation.
第5回 様々なファイル形式の読み込みとデータの書き出し
- The document discusses working with GDP data from an Excel file in R.
- It shows how to use the read_excel() function to import the Excel file and create a dataframe called gdp.
- Various data cleaning and manipulation steps are applied to the gdp dataframe, such as removing rows with missing values, renaming columns, and adding row names.
- The cleaned gdp dataframe is then saved to an RData file using save() for later use.
20190907 Julia the language for future
The document discusses the Julia programming language. It provides information on Julia's popularity compared to other languages like Python and R. It highlights several use cases for Julia in fields like finance, science, and engineering. It also demonstrates basic Julia code for tasks like data analysis, plotting, and numerical computing. Overall, the document serves as an introduction to the Julia language and provides examples of its capabilities.
Optimizer features in recent releases of other databases
The document summarizes several recent optimizer features introduced in MySQL 8.0 and PostgreSQL versions:
- MySQL 8.0 introduced an iterator-based executor, hash joins, EXPLAIN ANALYZE, and optimizations for anti-joins, semi-joins, and subqueries.
- PostgreSQL improved query parallelism, added multi-column statistics, parallel index creation, and optimized non-recursive common table expressions.
- Both databases have focused on join algorithms, statistics gathering, and parallel query processing to improve performance. MySQL continues to adopt features from other databases in recent releases.
The Language for future-julia
This document provides information about the Julia programming language. It discusses Julia's performance, use cases in different industries, available packages and tools, and ongoing development work. Key highlights include Julia's speed, its use in fields like robotics, quantitative finance, and science, and recent improvements to its machine learning and quantum computing capabilities.
System Integration
The document summarizes the design of an electrically assisted human powered vehicle. It includes sections on the center of gravity calculation, bill of materials and mass table, cost analysis, performance analysis, assembly specifications, CAD assembly files, and project timeline. The key details are the vehicle will have a total mass of 184.7kg, cost $9,450 to produce, and be able to reach speeds of up to 40kph with electric assist while accommodating a single rider weighing up to 120kg.
Latin America Tour 2019 - 10 great sql features
By expanding our knowledge of SQL facilities, we can let all the boring work be handled via SQL rather than a lot of middle-tier code, and we can get performance benefits as an added bonus. Here are some SQL techniques to solve problems that would otherwise require a lot of complex coding, freeing up your time to focus on the delivery of great applications.
Similar to library(tidyr) and library(ggplot2) (20)
MH prediction modeling and validation in r (1) regression 190709
MH prediction modeling and validation in r (1) regression 190709
Easy HTML Tables in RStudio with Tabyl and kableExtra
Easy HTML Tables in RStudio with Tabyl and kableExtra
Optimizer features in recent releases of other databases
Optimizer features in recent releases of other databases
More from Dr. Volkan OBAN
Conference Paper:IMAGE PROCESSING AND OBJECT DETECTION APPLICATION: INSURANCE...
1) The document discusses using image processing and object detection techniques for insurance claims processing and underwriting. It aims to allow insurers to realistically assess images of damaged objects and claims.
2) Artificial intelligence, including computer vision, has been widely adopted in the insurance industry to analyze data like images, extract relevant information, detect fraud, and predict costs. Computer vision can recognize objects in images and help route insurance inquiries.
3) The document examines several computer vision applications for insurance - image similarity, facial recognition, object detection, and damage detection from images. It asserts that computer vision can expedite claims processing and improve key performance metrics for insurers.
Covid19py Python Package - Example
Covid19py by Konstantinos Kamaropoulos
A tiny Python package for easy access to up-to-date Coronavirus (COVID-19, SARS-CoV-2) cases data.
ref:https://github.com/Kamaropoulos/COVID19Py
https://pypi.org/project/COVID19Py/?fbclid=IwAR0zFKe_1Y6Nm0ak1n0W1ucFZcVT4VBWEP4LOFHJP-DgoL32kx3JCCxkGLQ
Object detection with Python
This document provides examples of object detection output from a deep learning model. The examples detect objects like cars, trucks, people, and horses along with confidence scores. The document also mentions using Python and TensorFlow for object detection with deep learning. It is authored by Volkan Oban, a senior data scientist.
Python - Rastgele Orman(Random Forest) Parametreleri
Python Random Forest Parameters
summary info
Turkish
Linear Programming wi̇th R - Examples
The document discusses using the lpSolveAPI package in R to solve linear programming problems. It provides three examples:
1) A farmer's profit maximization problem is modeled and solved using functions from lpSolveAPI like make.lp(), add.constraint(), and solve().
2) A simple minimization problem is created and solved to illustrate setting up the objective function and constraints.
3) A more complex problem is modeled to demonstrate setting sparse matrices, integer/binary variables, and customizing variable and constraint names.
"optrees" package in R and examples.(optrees:finds optimal trees in weighted ...
Finds optimal trees in weighted graphs. In
particular, this package provides solving tools for minimum cost spanning
tree problems, minimum cost arborescence problems, shortest path tree
problems and minimum cut tree problem.
by Volkan OBAN
k-means Clustering in Python
k-means Clustering in Python
scikit-learn--Machine Learning in Python
from sklearn.cluster import KMeans
k-means clustering is a method of vector quantization, originally from signal processing, that is popular for cluster analysis in data mining. k-means clustering aims to partition n observations into k clusters in which each observation belongs to the cluster with the nearest mean, serving as a prototype of the cluster. This results in a partitioning of the data space into Voronoi cells.
The problem is computationally difficult (NP-hard); however, there are efficient heuristic algorithms that are commonly employed and converge quickly to a local optimum. These are usually similar to the expectation-maximization algorithm for mixtures of Gaussian distributions via an iterative refinement approach employed by both algorithms. Additionally, they both use cluster centers to model the data; however, k-means clustering tends to find clusters of comparable spatial extent, while the expectation-maximization mechanism allows clusters to have different shapes.[wikipedia]
ref: http://scikit-learn.org/stable/auto_examples/cluster/plot_cluster_iris.html
Naive Bayes Example using R
Naive Bayes Example using R
data(iris)
ref:http://rischanlab.github.io/NaiveBayes.html
Rischan Mafrur
R forecasting Example
This document describes using time series analysis in R to model and forecast tractor sales data. The sales data is transformed using logarithms and differencing to make it stationary. An ARIMA(0,1,1)(0,1,1)[12] model is fitted to the data and produces forecasts for 36 months ahead. The forecasts are plotted along with the original sales data and 95% prediction intervals.
k-means Clustering and Custergram with R
k-means Clustering and Custergram with R.
K Means Clustering is an unsupervised learning algorithm that tries to cluster data based on their similarity. Unsupervised learning means that there is no outcome to be predicted, and the algorithm just tries to find patterns in the data. In k means clustering, we have the specify the number of clusters we want the data to be grouped into. The algorithm randomly assigns each observation to a cluster, and finds the centroid of each cluster.
ref:https://www.r-bloggers.com/k-means-clustering-in-r/
ref:https://rpubs.com/FelipeRego/K-Means-Clustering
ref:https://www.r-bloggers.com/clustergram-visualization-and-diagnostics-for-cluster-analysis-r-code/
Data Science and its Relationship to Big Data and Data-Driven Decision Making
Data Science and its Relationship to Big Data and Data-Driven Decision Making
To cite this article:
Foster Provost and Tom Fawcett. Big Data. February 2013, 1(1): 51-59. doi:10.1089/big.2013.1508.
Foster Provost and Tom Fawcett
Published in Volume: 1 Issue 1: February 13, 2013
ref:http://online.liebertpub.com/doi/full/10.1089/big.2013.1508
https://www.researchgate.net/publication/256439081_Data_Science_and_Its_Relationship_to_Big_Data_and_Data-Driven_Decision_Making
Data Visualization with R.ggplot2 and its extensions examples.
ggplot2 and its extensions examples. lattice-latticeExtra-gridextra packages
ref:http://r-statistics.co
Scikit-learn Cheatsheet-Python
Scikit learn cheatsheet -Python.
ref: https://www.datacamp.com/community/blog/scikit-learn-cheat-sheet#gs.71jPmKY
Python Pandas for Data Science cheatsheet
The Pandas library provides easy-to-use data structures and analysis tools for Python. It uses NumPy and allows import of data into Series (one-dimensional arrays) and DataFrames (two-dimensional labeled data structures). Data can be accessed, filtered, and manipulated using indexing, booleans, and arithmetic operations. Pandas supports reading and writing data to common formats like CSV, Excel, SQL, and can help with data cleaning, manipulation, and analysis tasks.
Pandas,scipy,numpy cheatsheet
ref: https://s3.amazonaws.com/quandl-static-content/Documents/Quandl+-+Pandas,+SciPy,+NumPy+Cheat+Sheet.pdf
ReporteRs package in R. forming powerpoint documents-an example
This document contains examples of plots, FlexTables, and text generated with the ReporteRs package in R to create a PowerPoint presentation. A line plot is generated showing ozone levels over time. A FlexTable is created from the iris dataset with styled cells and borders. Sections of formatted text are added describing topics in data science, analytics, and machine learning.
R-ggplot2 package Examples
ggplot2 Examples.
References:
ggplot2 Elegant Graphics for Data Analysis; Wickham, Hadley
http://www.stat.wisc.edu/~larget/stat302/chap2.pdf
https://cran.r-project.org/web/packages/ggthemes/vignettes/ggthemes.html
https://www3.nd.edu/~steve/computing_with_data/11_geom_examples/ggplot_examples.html
http://seananderson.ca/ggplot2-FISH554/
http://ggobi.github.io/ggally/docs.html#columns_and_mapping
R Machine Learning packages( generally used)
R Machine Learning packages( generally used)
prepared by Volkan OBAN
reference:
https://github.com/josephmisiti/awesome-machine-learning#r-general-purpose
treemap package in R and examples.
treemap package in R and examples..
reference:
Reference: https://cran.r-project.org/web/packages/treemap/treemap.pdf
More from Dr. Volkan OBAN (20)
Conference Paper:IMAGE PROCESSING AND OBJECT DETECTION APPLICATION: INSURANCE...
Conference Paper:IMAGE PROCESSING AND OBJECT DETECTION APPLICATION: INSURANCE...
Python - Rastgele Orman(Random Forest) Parametreleri
Python - Rastgele Orman(Random Forest) Parametreleri
"optrees" package in R and examples.(optrees:finds optimal trees in weighted ...
"optrees" package in R and examples.(optrees:finds optimal trees in weighted ...
Data Science and its Relationship to Big Data and Data-Driven Decision Making
Data Science and its Relationship to Big Data and Data-Driven Decision Making
Data Visualization with R.ggplot2 and its extensions examples.
Data Visualization with R.ggplot2 and its extensions examples.
ReporteRs package in R. forming powerpoint documents-an example
ReporteRs package in R. forming powerpoint documents-an example
ReporteRs package in R. forming powerpoint documents-an example
ReporteRs package in R. forming powerpoint documents-an example
Recently uploaded
一比一原版(爱大毕业证书)爱丁堡大学毕业证如何办理
毕业原版【微信:41543339】【(爱大毕业证书)爱丁堡大学毕业证】【微信:41543339】成绩单、外壳、offer、留信学历认证(永久存档真实可查)采用学校原版纸张、特殊工艺完全按照原版一比一制作(包括:隐形水印,阴影底纹,钢印LOGO烫金烫银,LOGO烫金烫银复合重叠,文字图案浮雕,激光镭射,紫外荧光,温感,复印防伪)行业标杆!精益求精,诚心合作,真诚制作!多年品质 ,按需精细制作,24小时接单,全套进口原装设备,十五年致力于帮助留学生解决难题,业务范围有加拿大、英国、澳洲、韩国、美国、新加坡,新西兰等学历材料,包您满意。
【我们承诺采用的是学校原版纸张(纸质、底色、纹路),我们拥有全套进口原装设备,特殊工艺都是采用不同机器制作,仿真度基本可以达到100%,所有工艺效果都可提前给客户展示,不满意可以根据客户要求进行调整,直到满意为止!】
【业务选择办理准则】
一、工作未确定,回国需先给父母、亲戚朋友看下文凭的情况,办理一份就读学校的毕业证【微信41543339】文凭即可
二、回国进私企、外企、自己做生意的情况,这些单位是不查询毕业证真伪的,而且国内没有渠道去查询国外文凭的真假,也不需要提供真实教育部认证。鉴于此,办理一份毕业证【微信41543339】即可
三、进国企,银行,事业单位,考公务员等等,这些单位是必需要提供真实教育部认证的,办理教育部认证所需资料众多且烦琐,所有材料您都必须提供原件,我们凭借丰富的经验,快捷的绿色通道帮您快速整合材料,让您少走弯路。
留信网认证的作用:
1:该专业认证可证明留学生真实身份
2:同时对留学生所学专业登记给予评定
3:国家专业人才认证中心颁发入库证书
4:这个认证书并且可以归档倒地方
5:凡事获得留信网入网的信息将会逐步更新到个人身份内,将在公安局网内查询个人身份证信息后,同步读取人才网入库信息
6:个人职称评审加20分
7:个人信誉贷款加10分
8:在国家人才网主办的国家网络招聘大会中纳入资料,供国家高端企业选择人才
留信网服务项目:
1、留学生专业人才库服务(留信分析)
2、国(境)学习人员提供就业推荐信服务
3、留学人员区块链存储服务
→ 【关于价格问题(保证一手价格)】
我们所定的价格是非常合理的,而且我们现在做得单子大多数都是代理和回头客户介绍的所以一般现在有新的单子 我给客户的都是第一手的代理价格,因为我想坦诚对待大家 不想跟大家在价格方面浪费时间
对于老客户或者被老客户介绍过来的朋友,我们都会适当给一些优惠。
选择实体注册公司办理,更放心,更安全!我们的承诺:客户在留信官方认证查询网站查询到认证通过结果后付款,不成功不收费!
ViewShift: Hassle-free Dynamic Policy Enforcement for Every Data Lake
Dynamic policy enforcement is becoming an increasingly important topic in today’s world where data privacy and compliance is a top priority for companies, individuals, and regulators alike. In these slides, we discuss how LinkedIn implements a powerful dynamic policy enforcement engine, called ViewShift, and integrates it within its data lake. We show the query engine architecture and how catalog implementations can automatically route table resolutions to compliance-enforcing SQL views. Such views have a set of very interesting properties: (1) They are auto-generated from declarative data annotations. (2) They respect user-level consent and preferences (3) They are context-aware, encoding a different set of transformations for different use cases (4) They are portable; while the SQL logic is only implemented in one SQL dialect, it is accessible in all engines.
#SQL #Views #Privacy #Compliance #DataLake
在线办理(英国UCA毕业证书)创意艺术大学毕业证在读证明一模一样
学校原件一模一样【微信:741003700 】《(英国UCA毕业证书)创意艺术大学毕业证》【微信:741003700 】学位证,留信认证(真实可查,永久存档)原件一模一样纸张工艺/offer、雅思、外壳等材料/诚信可靠,可直接看成品样本,帮您解决无法毕业带来的各种难题!外壳,原版制作,诚信可靠,可直接看成品样本。行业标杆!精益求精,诚心合作,真诚制作!多年品质 ,按需精细制作,24小时接单,全套进口原装设备。十五年致力于帮助留学生解决难题,包您满意。
本公司拥有海外各大学样板无数,能完美还原。
1:1完美还原海外各大学毕业材料上的工艺:水印,阴影底纹,钢印LOGO烫金烫银,LOGO烫金烫银复合重叠。文字图案浮雕、激光镭射、紫外荧光、温感、复印防伪等防伪工艺。材料咨询办理、认证咨询办理请加学历顾问Q/微741003700
【主营项目】
一.毕业证【q微741003700】成绩单、使馆认证、教育部认证、雅思托福成绩单、学生卡等!
二.真实使馆公证(即留学回国人员证明,不成功不收费)
三.真实教育部学历学位认证(教育部存档!教育部留服网站永久可查)
四.办理各国各大学文凭(一对一专业服务,可全程监控跟踪进度)
如果您处于以下几种情况:
◇在校期间,因各种原因未能顺利毕业……拿不到官方毕业证【q/微741003700】
◇面对父母的压力,希望尽快拿到;
◇不清楚认证流程以及材料该如何准备;
◇回国时间很长,忘记办理;
◇回国马上就要找工作,办给用人单位看;
◇企事业单位必须要求办理的
◇需要报考公务员、购买免税车、落转户口
◇申请留学生创业基金
留信网认证的作用:
1:该专业认证可证明留学生真实身份
2:同时对留学生所学专业登记给予评定
3:国家专业人才认证中心颁发入库证书
4:这个认证书并且可以归档倒地方
5:凡事获得留信网入网的信息将会逐步更新到个人身份内,将在公安局网内查询个人身份证信息后,同步读取人才网入库信息
6:个人职称评审加20分
7:个人信誉贷款加10分
8:在国家人才网主办的国家网络招聘大会中纳入资料,供国家高端企业选择人才
Intelligence supported media monitoring in veterinary medicine
Media monitoring in veterinary medicien
原版制作(swinburne毕业证书)斯威本科技大学毕业证毕业完成信一模一样
学校原件一模一样【微信:741003700 】《(swinburne毕业证书)斯威本科技大学毕业证》【微信:741003700 】学位证,留信认证(真实可查,永久存档)原件一模一样纸张工艺/offer、雅思、外壳等材料/诚信可靠,可直接看成品样本,帮您解决无法毕业带来的各种难题!外壳,原版制作,诚信可靠,可直接看成品样本。行业标杆!精益求精,诚心合作,真诚制作!多年品质 ,按需精细制作,24小时接单,全套进口原装设备。十五年致力于帮助留学生解决难题,包您满意。
本公司拥有海外各大学样板无数,能完美还原。
1:1完美还原海外各大学毕业材料上的工艺:水印,阴影底纹,钢印LOGO烫金烫银,LOGO烫金烫银复合重叠。文字图案浮雕、激光镭射、紫外荧光、温感、复印防伪等防伪工艺。材料咨询办理、认证咨询办理请加学历顾问Q/微741003700
【主营项目】
一.毕业证【q微741003700】成绩单、使馆认证、教育部认证、雅思托福成绩单、学生卡等!
二.真实使馆公证(即留学回国人员证明,不成功不收费)
三.真实教育部学历学位认证(教育部存档!教育部留服网站永久可查)
四.办理各国各大学文凭(一对一专业服务,可全程监控跟踪进度)
如果您处于以下几种情况:
◇在校期间,因各种原因未能顺利毕业……拿不到官方毕业证【q/微741003700】
◇面对父母的压力,希望尽快拿到;
◇不清楚认证流程以及材料该如何准备;
◇回国时间很长,忘记办理;
◇回国马上就要找工作,办给用人单位看;
◇企事业单位必须要求办理的
◇需要报考公务员、购买免税车、落转户口
◇申请留学生创业基金
留信网认证的作用:
1:该专业认证可证明留学生真实身份
2:同时对留学生所学专业登记给予评定
3:国家专业人才认证中心颁发入库证书
4:这个认证书并且可以归档倒地方
5:凡事获得留信网入网的信息将会逐步更新到个人身份内,将在公安局网内查询个人身份证信息后,同步读取人才网入库信息
6:个人职称评审加20分
7:个人信誉贷款加10分
8:在国家人才网主办的国家网络招聘大会中纳入资料,供国家高端企业选择人才
一比一原版(UIUC毕业证)伊利诺伊大学|厄巴纳-香槟分校毕业证如何办理
UIUC毕业证offer【微信95270640】☀《伊利诺伊大学|厄巴纳-香槟分校毕业证购买》GoogleQ微信95270640《UIUC毕业证模板办理》加拿大文凭、本科、硕士、研究生学历都可以做,二、业务范围:
★、全套服务:毕业证、成绩单、化学专业毕业证书伪造《伊利诺伊大学|厄巴纳-香槟分校大学毕业证》Q微信95270640《UIUC学位证书购买》
(诚招代理)办理国外高校毕业证成绩单文凭学位证,真实使馆公证(留学回国人员证明)真实留信网认证国外学历学位认证雅思代考国外学校代申请名校保录开请假条改GPA改成绩ID卡
1.高仿业务:【本科硕士】毕业证,成绩单(GPA修改),学历认证(教育部认证),大学Offer,,ID,留信认证,使馆认证,雅思,语言证书等高仿类证书;
2.认证服务: 学历认证(教育部认证),大使馆认证(回国人员证明),留信认证(可查有编号证书),大学保录取,雅思保分成绩单。
3.技术服务:钢印水印烫金激光防伪凹凸版设计印刷激凸温感光标底纹镭射速度快。
办理伊利诺伊大学|厄巴纳-香槟分校伊利诺伊大学|厄巴纳-香槟分校毕业证offer流程:
1客户提供办理信息:姓名生日专业学位毕业时间等(如信息不确定可以咨询顾问:我们有专业老师帮你查询);
2开始安排制作毕业证成绩单电子图;
3毕业证成绩单电子版做好以后发送给您确认;
4毕业证成绩单电子版您确认信息无误之后安排制作成品;
5成品做好拍照或者视频给您确认;
6快递给客户(国内顺丰国外DHLUPS等快读邮寄)
-办理真实使馆公证(即留学回国人员证明)
-办理各国各大学文凭(世界名校一对一专业服务,可全程监控跟踪进度)
-全套服务:毕业证成绩单真实使馆公证真实教育部认证。让您回国发展信心十足!
(详情请加一下 文凭顾问+微信:95270640)欢迎咨询!的鬼地方父亲的家在高楼最底屋最下面很矮很黑是很不显眼的地下室父亲的家安在别人脚底下须绕过高楼旁边的垃圾堆下八个台阶才到父亲的家很狭小除了一张单人床和一张小方桌几乎没有多余的空间山娃一下子就联想起学校的男小便处山娃很想笑却怎么也笑不出来山娃很迷惑父亲的家除了一扇小铁门连窗户也没有墓穴一般阴森森有些骇人父亲的城也便成了山娃的城父亲的家也便成了山娃的家父亲让山娃呆在屋里做作业看电视最多只能在门口透透气间
The Ipsos - AI - Monitor 2024 Report.pdf
According to Ipsos AI Monitor's 2024 report, 65% Indians said that products and services using AI have profoundly changed their daily life in the past 3-5 years.
一比一原版(BCU毕业证书)伯明翰城市大学毕业证如何办理
原版定制【微信:41543339】【(BCU毕业证书)伯明翰城市大学毕业证】【微信:41543339】成绩单、外壳、offer、留信学历认证(永久存档真实可查)采用学校原版纸张、特殊工艺完全按照原版一比一制作(包括:隐形水印,阴影底纹,钢印LOGO烫金烫银,LOGO烫金烫银复合重叠,文字图案浮雕,激光镭射,紫外荧光,温感,复印防伪)行业标杆!精益求精,诚心合作,真诚制作!多年品质 ,按需精细制作,24小时接单,全套进口原装设备,十五年致力于帮助留学生解决难题,业务范围有加拿大、英国、澳洲、韩国、美国、新加坡,新西兰等学历材料,包您满意。
【我们承诺采用的是学校原版纸张(纸质、底色、纹路),我们拥有全套进口原装设备,特殊工艺都是采用不同机器制作,仿真度基本可以达到100%,所有工艺效果都可提前给客户展示,不满意可以根据客户要求进行调整,直到满意为止!】
【业务选择办理准则】
一、工作未确定,回国需先给父母、亲戚朋友看下文凭的情况,办理一份就读学校的毕业证【微信41543339】文凭即可
二、回国进私企、外企、自己做生意的情况,这些单位是不查询毕业证真伪的,而且国内没有渠道去查询国外文凭的真假,也不需要提供真实教育部认证。鉴于此,办理一份毕业证【微信41543339】即可
三、进国企,银行,事业单位,考公务员等等,这些单位是必需要提供真实教育部认证的,办理教育部认证所需资料众多且烦琐,所有材料您都必须提供原件,我们凭借丰富的经验,快捷的绿色通道帮您快速整合材料,让您少走弯路。
留信网认证的作用:
1:该专业认证可证明留学生真实身份
2:同时对留学生所学专业登记给予评定
3:国家专业人才认证中心颁发入库证书
4:这个认证书并且可以归档倒地方
5:凡事获得留信网入网的信息将会逐步更新到个人身份内,将在公安局网内查询个人身份证信息后,同步读取人才网入库信息
6:个人职称评审加20分
7:个人信誉贷款加10分
8:在国家人才网主办的国家网络招聘大会中纳入资料,供国家高端企业选择人才
留信网服务项目:
1、留学生专业人才库服务(留信分析)
2、国(境)学习人员提供就业推荐信服务
3、留学人员区块链存储服务
→ 【关于价格问题(保证一手价格)】
我们所定的价格是非常合理的,而且我们现在做得单子大多数都是代理和回头客户介绍的所以一般现在有新的单子 我给客户的都是第一手的代理价格,因为我想坦诚对待大家 不想跟大家在价格方面浪费时间
对于老客户或者被老客户介绍过来的朋友,我们都会适当给一些优惠。
选择实体注册公司办理,更放心,更安全!我们的承诺:客户在留信官方认证查询网站查询到认证通过结果后付款,不成功不收费!
一比一原版(GWU,GW文凭证书)乔治·华盛顿大学毕业证如何办理
毕业原版【微信:176555708】【(GWU,GW毕业证书)乔治·华盛顿大学毕业证】【微信:176555708】成绩单、外壳、offer、留信学历认证(永久存档真实可查)采用学校原版纸张、特殊工艺完全按照原版一比一制作(包括:隐形水印,阴影底纹,钢印LOGO烫金烫银,LOGO烫金烫银复合重叠,文字图案浮雕,激光镭射,紫外荧光,温感,复印防伪)行业标杆!精益求精,诚心合作,真诚制作!多年品质 ,按需精细制作,24小时接单,全套进口原装设备,十五年致力于帮助留学生解决难题,业务范围有加拿大、英国、澳洲、韩国、美国、新加坡,新西兰等学历材料,包您满意。
【我们承诺采用的是学校原版纸张(纸质、底色、纹路),我们拥有全套进口原装设备,特殊工艺都是采用不同机器制作,仿真度基本可以达到100%,所有工艺效果都可提前给客户展示,不满意可以根据客户要求进行调整,直到满意为止!】
【业务选择办理准则】
一、工作未确定,回国需先给父母、亲戚朋友看下文凭的情况,办理一份就读学校的毕业证【微信176555708】文凭即可
二、回国进私企、外企、自己做生意的情况,这些单位是不查询毕业证真伪的,而且国内没有渠道去查询国外文凭的真假,也不需要提供真实教育部认证。鉴于此,办理一份毕业证【微信176555708】即可
三、进国企,银行,事业单位,考公务员等等,这些单位是必需要提供真实教育部认证的,办理教育部认证所需资料众多且烦琐,所有材料您都必须提供原件,我们凭借丰富的经验,快捷的绿色通道帮您快速整合材料,让您少走弯路。
留信网认证的作用:
1:该专业认证可证明留学生真实身份
2:同时对留学生所学专业登记给予评定
3:国家专业人才认证中心颁发入库证书
4:这个认证书并且可以归档倒地方
5:凡事获得留信网入网的信息将会逐步更新到个人身份内,将在公安局网内查询个人身份证信息后,同步读取人才网入库信息
6:个人职称评审加20分
7:个人信誉贷款加10分
8:在国家人才网主办的国家网络招聘大会中纳入资料,供国家高端企业选择人才
留信网服务项目:
1、留学生专业人才库服务(留信分析)
2、国(境)学习人员提供就业推荐信服务
3、留学人员区块链存储服务
→ 【关于价格问题(保证一手价格)】
我们所定的价格是非常合理的,而且我们现在做得单子大多数都是代理和回头客户介绍的所以一般现在有新的单子 我给客户的都是第一手的代理价格,因为我想坦诚对待大家 不想跟大家在价格方面浪费时间
对于老客户或者被老客户介绍过来的朋友,我们都会适当给一些优惠。
选择实体注册公司办理,更放心,更安全!我们的承诺:客户在留信官方认证查询网站查询到认证通过结果后付款,不成功不收费!
STATATHON: Unleashing the Power of Statistics in a 48-Hour Knowledge Extravag...
"Join us for STATATHON, a dynamic 2-day event dedicated to exploring statistical knowledge and its real-world applications. From theory to practice, participants engage in intensive learning sessions, workshops, and challenges, fostering a deeper understanding of statistical methodologies and their significance in various fields."
一比一原版(UofS毕业证书)萨省大学毕业证如何办理
原版定制【微信:41543339】【(UofS毕业证书)萨省大学毕业证】【微信:41543339】成绩单、外壳、offer、留信学历认证(永久存档真实可查)采用学校原版纸张、特殊工艺完全按照原版一比一制作(包括:隐形水印,阴影底纹,钢印LOGO烫金烫银,LOGO烫金烫银复合重叠,文字图案浮雕,激光镭射,紫外荧光,温感,复印防伪)行业标杆!精益求精,诚心合作,真诚制作!多年品质 ,按需精细制作,24小时接单,全套进口原装设备,十五年致力于帮助留学生解决难题,业务范围有加拿大、英国、澳洲、韩国、美国、新加坡,新西兰等学历材料,包您满意。
【我们承诺采用的是学校原版纸张(纸质、底色、纹路),我们拥有全套进口原装设备,特殊工艺都是采用不同机器制作,仿真度基本可以达到100%,所有工艺效果都可提前给客户展示,不满意可以根据客户要求进行调整,直到满意为止!】
【业务选择办理准则】
一、工作未确定,回国需先给父母、亲戚朋友看下文凭的情况,办理一份就读学校的毕业证【微信41543339】文凭即可
二、回国进私企、外企、自己做生意的情况,这些单位是不查询毕业证真伪的,而且国内没有渠道去查询国外文凭的真假,也不需要提供真实教育部认证。鉴于此,办理一份毕业证【微信41543339】即可
三、进国企,银行,事业单位,考公务员等等,这些单位是必需要提供真实教育部认证的,办理教育部认证所需资料众多且烦琐,所有材料您都必须提供原件,我们凭借丰富的经验,快捷的绿色通道帮您快速整合材料,让您少走弯路。
留信网认证的作用:
1:该专业认证可证明留学生真实身份
2:同时对留学生所学专业登记给予评定
3:国家专业人才认证中心颁发入库证书
4:这个认证书并且可以归档倒地方
5:凡事获得留信网入网的信息将会逐步更新到个人身份内,将在公安局网内查询个人身份证信息后,同步读取人才网入库信息
6:个人职称评审加20分
7:个人信誉贷款加10分
8:在国家人才网主办的国家网络招聘大会中纳入资料,供国家高端企业选择人才
留信网服务项目:
1、留学生专业人才库服务(留信分析)
2、国(境)学习人员提供就业推荐信服务
3、留学人员区块链存储服务
→ 【关于价格问题(保证一手价格)】
我们所定的价格是非常合理的,而且我们现在做得单子大多数都是代理和回头客户介绍的所以一般现在有新的单子 我给客户的都是第一手的代理价格,因为我想坦诚对待大家 不想跟大家在价格方面浪费时间
对于老客户或者被老客户介绍过来的朋友,我们都会适当给一些优惠。
选择实体注册公司办理,更放心,更安全!我们的承诺:客户在留信官方认证查询网站查询到认证通过结果后付款,不成功不收费!
06-04-2024 - NYC Tech Week - Discussion on Vector Databases, Unstructured Dat...
06-04-2024 - NYC Tech Week - Discussion on Vector Databases, Unstructured Data and AI
Discussion on Vector Databases, Unstructured Data and AI
https://www.meetup.com/unstructured-data-meetup-new-york/
This meetup is for people working in unstructured data. Speakers will come present about related topics such as vector databases, LLMs, and managing data at scale. The intended audience of this group includes roles like machine learning engineers, data scientists, data engineers, software engineers, and PMs.This meetup was formerly Milvus Meetup, and is sponsored by Zilliz maintainers of Milvus.
一比一原版(Dalhousie毕业证书)达尔豪斯大学毕业证如何办理
原版定制【微信:41543339】【(Dalhousie毕业证书)达尔豪斯大学毕业证】【微信:41543339】成绩单、外壳、offer、留信学历认证(永久存档真实可查)采用学校原版纸张、特殊工艺完全按照原版一比一制作(包括:隐形水印,阴影底纹,钢印LOGO烫金烫银,LOGO烫金烫银复合重叠,文字图案浮雕,激光镭射,紫外荧光,温感,复印防伪)行业标杆!精益求精,诚心合作,真诚制作!多年品质 ,按需精细制作,24小时接单,全套进口原装设备,十五年致力于帮助留学生解决难题,业务范围有加拿大、英国、澳洲、韩国、美国、新加坡,新西兰等学历材料,包您满意。
【我们承诺采用的是学校原版纸张(纸质、底色、纹路),我们拥有全套进口原装设备,特殊工艺都是采用不同机器制作,仿真度基本可以达到100%,所有工艺效果都可提前给客户展示,不满意可以根据客户要求进行调整,直到满意为止!】
【业务选择办理准则】
一、工作未确定,回国需先给父母、亲戚朋友看下文凭的情况,办理一份就读学校的毕业证【微信41543339】文凭即可
二、回国进私企、外企、自己做生意的情况,这些单位是不查询毕业证真伪的,而且国内没有渠道去查询国外文凭的真假,也不需要提供真实教育部认证。鉴于此,办理一份毕业证【微信41543339】即可
三、进国企,银行,事业单位,考公务员等等,这些单位是必需要提供真实教育部认证的,办理教育部认证所需资料众多且烦琐,所有材料您都必须提供原件,我们凭借丰富的经验,快捷的绿色通道帮您快速整合材料,让您少走弯路。
留信网认证的作用:
1:该专业认证可证明留学生真实身份
2:同时对留学生所学专业登记给予评定
3:国家专业人才认证中心颁发入库证书
4:这个认证书并且可以归档倒地方
5:凡事获得留信网入网的信息将会逐步更新到个人身份内,将在公安局网内查询个人身份证信息后,同步读取人才网入库信息
6:个人职称评审加20分
7:个人信誉贷款加10分
8:在国家人才网主办的国家网络招聘大会中纳入资料,供国家高端企业选择人才
留信网服务项目:
1、留学生专业人才库服务(留信分析)
2、国(境)学习人员提供就业推荐信服务
3、留学人员区块链存储服务
→ 【关于价格问题(保证一手价格)】
我们所定的价格是非常合理的,而且我们现在做得单子大多数都是代理和回头客户介绍的所以一般现在有新的单子 我给客户的都是第一手的代理价格,因为我想坦诚对待大家 不想跟大家在价格方面浪费时间
对于老客户或者被老客户介绍过来的朋友,我们都会适当给一些优惠。
选择实体注册公司办理,更放心,更安全!我们的承诺:客户在留信官方认证查询网站查询到认证通过结果后付款,不成功不收费!
The Building Blocks of QuestDB, a Time Series Database
Talk Delivered at Valencia Codes Meetup 2024-06.
Traditionally, databases have treated timestamps just as another data type. However, when performing real-time analytics, timestamps should be first class citizens and we need rich time semantics to get the most out of our data. We also need to deal with ever growing datasets while keeping performant, which is as fun as it sounds.
It is no wonder time-series databases are now more popular than ever before. Join me in this session to learn about the internal architecture and building blocks of QuestDB, an open source time-series database designed for speed. We will also review a history of some of the changes we have gone over the past two years to deal with late and unordered data, non-blocking writes, read-replicas, or faster batch ingestion.
原版制作(Deakin毕业证书)迪肯大学毕业证学位证一模一样
学校原件一模一样【微信:741003700 】《(Deakin毕业证书)迪肯大学毕业证学位证》【微信:741003700 】学位证,留信认证(真实可查,永久存档)原件一模一样纸张工艺/offer、雅思、外壳等材料/诚信可靠,可直接看成品样本,帮您解决无法毕业带来的各种难题!外壳,原版制作,诚信可靠,可直接看成品样本。行业标杆!精益求精,诚心合作,真诚制作!多年品质 ,按需精细制作,24小时接单,全套进口原装设备。十五年致力于帮助留学生解决难题,包您满意。
本公司拥有海外各大学样板无数,能完美还原。
1:1完美还原海外各大学毕业材料上的工艺:水印,阴影底纹,钢印LOGO烫金烫银,LOGO烫金烫银复合重叠。文字图案浮雕、激光镭射、紫外荧光、温感、复印防伪等防伪工艺。材料咨询办理、认证咨询办理请加学历顾问Q/微741003700
【主营项目】
一.毕业证【q微741003700】成绩单、使馆认证、教育部认证、雅思托福成绩单、学生卡等!
二.真实使馆公证(即留学回国人员证明,不成功不收费)
三.真实教育部学历学位认证(教育部存档!教育部留服网站永久可查)
四.办理各国各大学文凭(一对一专业服务,可全程监控跟踪进度)
如果您处于以下几种情况:
◇在校期间,因各种原因未能顺利毕业……拿不到官方毕业证【q/微741003700】
◇面对父母的压力,希望尽快拿到;
◇不清楚认证流程以及材料该如何准备;
◇回国时间很长,忘记办理;
◇回国马上就要找工作,办给用人单位看;
◇企事业单位必须要求办理的
◇需要报考公务员、购买免税车、落转户口
◇申请留学生创业基金
留信网认证的作用:
1:该专业认证可证明留学生真实身份
2:同时对留学生所学专业登记给予评定
3:国家专业人才认证中心颁发入库证书
4:这个认证书并且可以归档倒地方
5:凡事获得留信网入网的信息将会逐步更新到个人身份内,将在公安局网内查询个人身份证信息后,同步读取人才网入库信息
6:个人职称评审加20分
7:个人信誉贷款加10分
8:在国家人才网主办的国家网络招聘大会中纳入资料,供国家高端企业选择人才
一比一原版(Harvard毕业证书)哈佛大学毕业证如何办理
毕业原版【微信:41543339】【(Harvard毕业证书)哈佛大学毕业证】【微信:41543339】成绩单、外壳、offer、留信学历认证(永久存档真实可查)采用学校原版纸张、特殊工艺完全按照原版一比一制作(包括:隐形水印,阴影底纹,钢印LOGO烫金烫银,LOGO烫金烫银复合重叠,文字图案浮雕,激光镭射,紫外荧光,温感,复印防伪)行业标杆!精益求精,诚心合作,真诚制作!多年品质 ,按需精细制作,24小时接单,全套进口原装设备,十五年致力于帮助留学生解决难题,业务范围有加拿大、英国、澳洲、韩国、美国、新加坡,新西兰等学历材料,包您满意。
【我们承诺采用的是学校原版纸张(纸质、底色、纹路),我们拥有全套进口原装设备,特殊工艺都是采用不同机器制作,仿真度基本可以达到100%,所有工艺效果都可提前给客户展示,不满意可以根据客户要求进行调整,直到满意为止!】
【业务选择办理准则】
一、工作未确定,回国需先给父母、亲戚朋友看下文凭的情况,办理一份就读学校的毕业证【微信41543339】文凭即可
二、回国进私企、外企、自己做生意的情况,这些单位是不查询毕业证真伪的,而且国内没有渠道去查询国外文凭的真假,也不需要提供真实教育部认证。鉴于此,办理一份毕业证【微信41543339】即可
三、进国企,银行,事业单位,考公务员等等,这些单位是必需要提供真实教育部认证的,办理教育部认证所需资料众多且烦琐,所有材料您都必须提供原件,我们凭借丰富的经验,快捷的绿色通道帮您快速整合材料,让您少走弯路。
留信网认证的作用:
1:该专业认证可证明留学生真实身份
2:同时对留学生所学专业登记给予评定
3:国家专业人才认证中心颁发入库证书
4:这个认证书并且可以归档倒地方
5:凡事获得留信网入网的信息将会逐步更新到个人身份内,将在公安局网内查询个人身份证信息后,同步读取人才网入库信息
6:个人职称评审加20分
7:个人信誉贷款加10分
8:在国家人才网主办的国家网络招聘大会中纳入资料,供国家高端企业选择人才
留信网服务项目:
1、留学生专业人才库服务(留信分析)
2、国(境)学习人员提供就业推荐信服务
3、留学人员区块链存储服务
→ 【关于价格问题(保证一手价格)】
我们所定的价格是非常合理的,而且我们现在做得单子大多数都是代理和回头客户介绍的所以一般现在有新的单子 我给客户的都是第一手的代理价格,因为我想坦诚对待大家 不想跟大家在价格方面浪费时间
对于老客户或者被老客户介绍过来的朋友,我们都会适当给一些优惠。
选择实体注册公司办理,更放心,更安全!我们的承诺:客户在留信官方认证查询网站查询到认证通过结果后付款,不成功不收费!
Predictably Improve Your B2B Tech Company's Performance by Leveraging Data
Harness the power of AI-backed reports, benchmarking and data analysis to predict trends and detect anomalies in your marketing efforts.
Peter Caputa, CEO at Databox, reveals how you can discover the strategies and tools to increase your growth rate (and margins!).
From metrics to track to data habits to pick up, enhance your reporting for powerful insights to improve your B2B tech company's marketing.
- - -
This is the webinar recording from the June 2024 HubSpot User Group (HUG) for B2B Technology USA.
Watch the video recording at https://youtu.be/5vjwGfPN9lw
Sign up for future HUG events at https://events.hubspot.com/b2b-technology-usa/
Learn SQL from basic queries to Advance queries
Dive into the world of data analysis with our comprehensive guide on mastering SQL! This presentation offers a practical approach to learning SQL, focusing on real-world applications and hands-on practice. Whether you're a beginner or looking to sharpen your skills, this guide provides the tools you need to extract, analyze, and interpret data effectively.
Key Highlights:
Foundations of SQL: Understand the basics of SQL, including data retrieval, filtering, and aggregation.
Advanced Queries: Learn to craft complex queries to uncover deep insights from your data.
Data Trends and Patterns: Discover how to identify and interpret trends and patterns in your datasets.
Practical Examples: Follow step-by-step examples to apply SQL techniques in real-world scenarios.
Actionable Insights: Gain the skills to derive actionable insights that drive informed decision-making.
Join us on this journey to enhance your data analysis capabilities and unlock the full potential of SQL. Perfect for data enthusiasts, analysts, and anyone eager to harness the power of data!
#DataAnalysis #SQL #LearningSQL #DataInsights #DataScience #Analytics
06-04-2024 - NYC Tech Week - Discussion on Vector Databases, Unstructured Dat...
06-04-2024 - NYC Tech Week - Discussion on Vector Databases, Unstructured Data and AI
Round table discussion of vector databases, unstructured data, ai, big data, real-time, robots and Milvus.
A lively discussion with NJ Gen AI Meetup Lead, Prasad and Procure.FYI's Co-Found
Recently uploaded (20)
ViewShift: Hassle-free Dynamic Policy Enforcement for Every Data Lake
ViewShift: Hassle-free Dynamic Policy Enforcement for Every Data Lake
Intelligence supported media monitoring in veterinary medicine
Intelligence supported media monitoring in veterinary medicine
STATATHON: Unleashing the Power of Statistics in a 48-Hour Knowledge Extravag...
STATATHON: Unleashing the Power of Statistics in a 48-Hour Knowledge Extravag...
06-04-2024 - NYC Tech Week - Discussion on Vector Databases, Unstructured Dat...
06-04-2024 - NYC Tech Week - Discussion on Vector Databases, Unstructured Dat...
The Building Blocks of QuestDB, a Time Series Database
The Building Blocks of QuestDB, a Time Series Database
Predictably Improve Your B2B Tech Company's Performance by Leveraging Data
Predictably Improve Your B2B Tech Company's Performance by Leveraging Data
06-04-2024 - NYC Tech Week - Discussion on Vector Databases, Unstructured Dat...
06-04-2024 - NYC Tech Week - Discussion on Vector Databases, Unstructured Dat...
library(tidyr) and library(ggplot2)
- 1. > library(tidyr) > library(ggplot2) > mtcars %>% gather(-mpg, -hp, -cyl, key = "var", value = "value") %>% ggpl ot(aes(x = value, y = mpg, color = hp, shape = factor(cyl))) + geom_point() + facet_wrap(~ var, scales = "free") + theme_bw() > am carb disp drat gear qsec vs wt 10 15 20 25 30 35 10 15 20 25 30 35 10 15 20 25 30 35 10 15 20 25 30 35 10 15 20 25 30 35 10 15 20 25 30 35 10 15 20 25 30 35 10 15 20 25 30 35 0.00 0.25 0.50 0.75 1.00 2 4 6 8 100 200 300 400 3.0 3.5 4.0 4.5 5.0 3.0 3.5 4.0 4.5 5.0 16 18 20 22 0.00 0.25 0.50 0.75 1.00 2 3 4 5 value mpg factor(cyl) 4 6 8 100 150 200 250 300 hp
- 2. > mtcars %>% gather(-mpg, key = "var", value = "value") %>% ggplot(aes(x = value, y = mpg)) + geom_point() + stat_smooth() + facet_wrap(~ var, scales = "free") + theme_bw() am carb cyl disp drat gear hp qsec vs wt 10 15 20 25 30 35 10 20 30 10 15 20 25 30 35 10 15 20 25 30 35 10 20 30 40 10 15 20 25 30 35 10 20 30 10 15 20 25 30 35 10 15 20 25 30 35 10 20 30 0.000.250.500.751.00 2 4 6 8 4 5 6 7 8 100 200 300 400 3.0 3.5 4.0 4.5 5.0 3.0 3.5 4.0 4.5 5.0 100 200 300 16 18 20 22 0.000.250.500.751.00 2 3 4 5 value mpg