Produce nice outputs for graphical, tabular and textual reporting in R-Reporters and export Packages.
•Download as DOCX, PDF•
0 likes•183 views

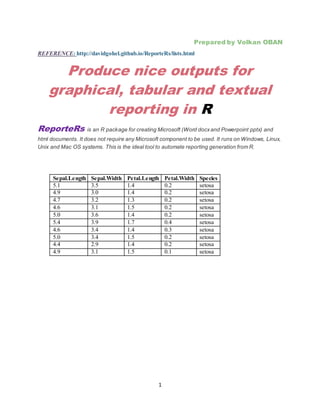
REFERENCE: http://davidgohel.github.io/ReporteRs/lists.html ReporteRs is an R package for creating Microsoft (Word docx and Powerpoint pptx) and html documents. It does not require any Microsoft component to be used. It runs on Windows, Linux, Unix and Mac OS systems. This is the ideal tool to automate reporting generation from R.

Recommended
More Related Content
What's hot
What's hot (19)
Similar to Produce nice outputs for graphical, tabular and textual reporting in R-Reporters and export Packages.
Similar to Produce nice outputs for graphical, tabular and textual reporting in R-Reporters and export Packages. (20)
More from Dr. Volkan OBAN
More from Dr. Volkan OBAN (20)
Recently uploaded
Recently uploaded (20)
Produce nice outputs for graphical, tabular and textual reporting in R-Reporters and export Packages.
- 1. 1 Prepared by Volkan OBAN REFERENCE: http://davidgohel.github.io/ReporteRs/lists.html Produce nice outputs for graphical, tabular and textual reporting in R ReporteRs is an R package for creating Microsoft (Word docxand Powerpoint pptx) and html documents. It does not require any Microsoft component to be used. It runs on Windows, Linux, Unix and Mac OS systems. This is the ideal tool to automate reporting generation from R. Sepal.Length Sepal.Width Petal.Length Petal.Width Species 5.1 3.5 1.4 0.2 setosa 4.9 3.0 1.4 0.2 setosa 4.7 3.2 1.3 0.2 setosa 4.6 3.1 1.5 0.2 setosa 5.0 3.6 1.4 0.2 setosa 5.4 3.9 1.7 0.4 setosa 4.6 3.4 1.4 0.3 setosa 5.0 3.4 1.5 0.2 setosa 4.4 2.9 1.4 0.2 setosa 4.9 3.1 1.5 0.1 setosa
- 4. 4 3 IRIS OUTPUTS 3.1 PLOT
- 5. 5 4 MTCARS OUTPUTS 4.1 PLOT
- 6. 6 Codes: > library( ReporteRs ) > library( ggplot2 ) Stackoverflow is a great place to get help: http://stackoverflow.com/tags/ggplot2. > library(magrittr) > > myplot1 <- qplot(Sepal.Length, Petal.Length, + data = iris, color = Species, + size = Petal.Width, alpha = I(0.7)) > myplot2 <- qplot(mpg, wt, data = mtcars, colour = cyl ) > > # Create a new document > mydoc <- docx( template = "files/word/template_toc.docx" ) > > # display available styles > styles( mydoc ) Normal heading 1 heading 2 "Normal" "Titre1" "Titre2" heading 3 heading 4 heading 5 "Titre3" "Titre4" "Titre5" heading 6 heading 7 heading 8 "Titre6" "Titre7" "Titre8" heading 9 Title Subtitle "Titre9" "Titre" "Sous-titre" Quote Intense Quote caption "Citation" "Citationintense" "Lgende" TOC Heading No Spacing List Paragraph "En-ttedetabledesmatires" "Sansinterligne" "Paragraphedeliste" rPlotLegend header footer "rPlotLegend" "En-tte" "Pieddepage" Titre1 BulletList Titre2 "Titre10" "BulletList" "Titre20" TitleDoc rRawOutput rTableLegend "TitleDoc" "rRawOutput" "rTableLegend" DocDefaults
- 7. 7 "DocDefaults" > mydoc <- mydoc %>% addTitle( "Table of contents", level = 1 ) %>% + addTOC( ) %>% # add a table of content + addPageBreak() # add a page break > > mydoc <- mydoc %>% addTitle( "List of graphics", level = 1 ) %>% + addTOC( stylename = "figurereference" ) %>% + addTitle( "List of tables", level = 1 ) %>% + addTOC( stylename = "tablereference" ) > mydoc <- addPageBreak( mydoc ) > > mydoc <- mydoc %>% addTitle( "iris outputs", level = 1 ) %>% + addTitle( "Plot", level = 2 ) %>% + addPlot(function( ) print( myplot1 ) ) %>% + addParagraph( value = "iris plot", + stylename = "figurereference") %>% # Add a legend below the plot + addTitle( "Table", level = 2 ) %>% + addFlexTable( vanilla.table( head( iris ) ) ) %>% + addParagraph( value = "iris table", + stylename = "tablereference") # Add a legend below the ta ble > > mydoc <- mydoc %>% addTitle( "mtcars outputs", level = 1 ) %>% + addTitle( "Plot", level = 2 ) %>% + addPlot(function( ) print( myplot2 ) ) %>% + addParagraph( value = "mtcars plot", + stylename = "figurereference") %>% # Add a legend below the plot + addTitle( "Table", level = 2 ) %>% + addFlexTable( vanilla.table( head( mtcars ) ) ) %>% + addParagraph( value = "mtcars table", + stylename = "tablereference") # Add a legend below the ta ble > > writeDoc( mydoc, file = "files/vv/volkan_demo.docx") EXAMPLE: FLEXTABLE EXAMPLE > library( boot ) > library( dplyr ) > data(mtcars) > mtcars$cyl = as.factor(mtcars$cyl) > data = summary(lm(mpg ~ wt + cyl, data=mtcars))$coefficients > > data = as.data.frame( data ) > > > # get signif codes > signif.codes = cut( data[,4]
- 8. 8 + , breaks = c( -Inf, 0.001, 0.01, 0.05, Inf) + , labels= c("***", "**", "*", "" ) ) > > # format the data values > data[, 1] = formatC( data[, 1], digits=3, format = "f") > data[, 2] = formatC( data[, 2], digits=3, format = "f") > data[, 3] = formatC( data[, 3], digits=3, format = "f") > data[, 4] = ifelse( data[, 4] < 0.001, "< 0.001", formatC( data[, 4], di gits=5, format = "f")) > # add signif codes to data > data$Signif = signif.codes > > # create an empty FlexTable > coef_ft = FlexTable( data = data, add.rownames=TRUE + , body.par.props = parRight(), header.text.props = tex tBold() + , header.columns = T + ) > # center the first column and set text as bold italic > coef_ft[,1] = parCenter() > coef_ft[,1] = textBoldItalic() > > # define borders > coef_ft = setFlexTableBorders( coef_ft + , inner.vertical = borderNone(), inner.horiz ontal = borderDotted() + , outer.vertical = borderNone(), outer.horiz ontal = borderSolid() + ) > coef_ft
- 9. 9 CONDITIONAL COLORED TABLE # a summary of mtcars dataset = aggregate( mtcars[, c("disp", "mpg", "wt")] , by = mtcars[, c("cyl", "gear", "carb")] , FUN = mean ) dataset = dataset[ order(dataset$cyl, dataset$gear, dataset$carb), ] # set cell padding defaut to 2 baseCellProp = cellProperties( padding = 2 ) # Create a FlexTable with data.frame dataset my_ft = FlexTable( data = dataset , body.cell.props = baseCellProp , header.cell.props = baseCellProp , header.par.props = parProperties(text.align = "center" ) ) # set columns widths (in inches) my_ft = setFlexTableWidths( my_ft, widths = c(0.5, 0.5, 0.5, 0.7, 0.7, 0.7) ) # span successive identical cells within column 1 my_ft = spanFlexTableRows( my_ft, j = 1, runs = as.character( dataset$cyl ) ) # overwrites some text formatting properties my_ft[dataset$wt < 3, 6] = textProperties( color="#FF3333", font.weight = "bo ld" ) my_ft[dataset$mpg < 20, 5] = chprop( baseCellProp, background.color = "#00AAA A") # overwrites some paragraph formatting properties my_ft[, 4:6] = parProperties(text.align = "right") # applies a border grid on table my_ft = setFlexTableBorders( my_ft
- 10. 10 , outer.vertical = borderProperties( width = 2 ) , outer.horizontal = borderProperties( width = 2 ) ) my_ft
- 11. 11 Example: Codes: 1 VOLKANOBAN Data science isan interdisciplinaryfieldaboutprocessesandsystemstoextractknowledgeorinsights fromdata in variousforms,eitherstructuredorunstructured,which isacontinuationof some of the data analysisfieldssuchasstatistics,datamining,andpredictiveanalytics,similartoKnowledge DiscoveryinDatabases(KDD). Data science employstechniquesandtheoriesdrawnfrommanyfieldswithinthe broadareas of mathematics,statistics,operationsresearch,[4] informationscience,andcomputerscience,including signal processing,probabilitymodels,machine learning,statistical learning,datamining,database,data engineering,patternrecognitionandlearning,visualization,predictive analytics,uncertaintymodeling, data warehousing,datacompression,computerprogramming,artificial intelligence,andhigh performance computing. DATA SCİENCE.1 1 This is another reference
- 12. 12 EXAMPLE: LISTS ReporteRs lets you create ordered or unordered lists. 1 ORDERED LIST 1. Data Science-Analytics. 1. Analyticsisthe discovery,interpretation,andcommunicationof meaningfulpatternsin data. Especiallyvaluableinareasrichwithrecordedinformation,analyticsreliesonthe simultaneousapplicationof statistics,computerprogrammingandoperationsresearchto quantifyperformance.Analyticsoftenfavorsdatavisualizationtocommunicate insight. 2. Analyticsisthe discovery,interpretation,andcommunicationof meaningfulpatternsin data. Especiallyvaluableinareasrichwithrecordedinformation,analyticsreliesonthe simultaneousapplicationof statistics,computerprogrammingandoperationsresearchto quantifyperformance.Analyticsoftenfavorsdatavisualizationtocommunicate insight. 2. Data Science-Analytics. 3. Analyticsisthe discovery,interpretation,andcommunicationof meaningfulpatternsindata. Especiallyvaluable inareasrichwithrecordedinformation,analyticsreliesonthe simultaneous applicationof statistics,computerprogrammingandoperationsresearchtoquantify performance.Analyticsoftenfavorsdatavisualizationtocommunicate insight. 4. Organizationsmayapplyanalyticstobusinessdatatodescribe,predict,andimprove business performance.Specifically,areaswithinanalyticsinclude predictive analytics,prescriptive analytics,enterprise decisionmanagement,retail analytics,store assortmentandstock-keeping unitoptimization,marketingoptimizationandmarketingmix modeling,webanalytics,salesforce sizingandoptimization,price andpromotionmodeling,predictive science,creditriskanalysis,and fraudanalytics.Since analyticscanrequire extensivecomputation(see bigdata),the algorithms and software usedforanalyticsharnessthe mostcurrentmethodsincomputerscience,statistics, and mathematics 5. Data Science-Analytics. 6. Analyticsisthe discovery,interpretation,andcommunicationof meaningfulpatternsindata. Especiallyvaluable inareasrichwithrecordedinformation,analyticsreliesonthe simultaneous applicationof statistics,computerprogrammingandoperationsresearchtoquantify performance.Analyticsoftenfavorsdatavisualizationtocommunicate insight. 7. Organizationsmayapplyanalyticstobusinessdatatodescribe,predict,andimprove business performance.Specifically,areaswithinanalyticsinclude predictive analytics,prescriptive analytics,enterprise decisionmanagement,retail analytics,store assortmentandstock-keeping unitoptimization,marketingoptimizationandmarketingmix modeling,webanalytics,salesforce sizingandoptimization,price andpromotionmodeling,predictive science,creditriskanalysis,and fraudanalytics.Since analyticscanrequire extensivecomputation(see bigdata),the algorithms
- 13. 13 and software usedforanalyticsharnessthe mostcurrentmethodsincomputerscience,statistics, and mathematics 2 UNORDEREDLIST ● Data Science-Analytics. ○ Analyticsisthe discovery,interpretation,andcommunicationof meaningfulpatternsin data. Especiallyvaluableinareasrichwithrecordedinformation,analyticsreliesonthe simultaneousapplicationof statistics,computerprogrammingandoperationsresearchto quantifyperformance.Analyticsoftenfavorsdatavisualizationtocommunicate insight. Codes: Reference: http://davidgohel.github.io/ReporteRs/index.html http://www.sthda.com/english/wiki/create-and-format-powerpoint-documents-from-r- software