LG chem 051910 Algorithm Investment Report
•
0 likes•42 views

LG chem 051910 Algorithm Investment Report
![[Price for scheduled purchasing]
Arbitrarily made
Algorithm stocks Trading Strategies (consolidated) 051910 Date
Period
Gap
(Indication /
stock)
Color
2020-02-12
3 months
Current stock price Evaluation
Stock price rise
probability score
Investment opinion Prospective purchase amount
409,500 W Low mid 48.4 Normal 10,000,000 W
Suggested Purchase
Amount 4,625,773 W
Number of stocks
purchased 11
Indication price Range Buying / Selling Buying / Selling [Stocks]
High price 690,414 W 690,414 W~ ~ 601,521 W 69 % -3,173,251 W -5
High mid 601,521 W 601,521 W ~ 512,627 W 47 % -2,169,095 W -4
Mid 512,627 W 512,627 W ~ 423,733 W 25 % -1,164,939 W -2
Low mid 423,733 W 423,733 W ~ 334,840 W 3 % -160,782 W -0
low price 334,840 W 334,840 W ~ 0 W -18 % 843,374 W 3
Stock price rise
probability score
A Sector 48.2 46.9 44.3 46.9 49.6 46.8
48.4B Sector 32.1 35.4 22.1 46.9 36.7 40.4
Total average
2019.09.11 2019.10.15 2019.11.12 2019.12.10 2020.01.10 2020.02.11
40.2 41.2 33.2 25.0 43.2 43.6
42 % 1 %
2019.10.15 2019.11.12 2019.12.10 2020.01.10 2020.02.11
Total of
increase rate
Total score
A Sector -3 % -6 % 6 % 5 % -6 %
-2 % 45.7B Sector 9 % -60 % 53 % -28 % 9 %
Total average 2 % -24 % -33 %
48 47
44
47
50
47
32
35
22
47
37
4040 41
33
25
43 44
0
10
20
30
40
50
60
2019.09.11 2019.10.15 2019.11.12 2019.12.10 2020.01.10 2020.02.11
Stock price rise probability score
A sector
B sector
Total average
-3% -6%
6% 5%
-6%
9%
-60%
53%
-28%
9%
2%
-24%
-33%
42%
1%
-80%
-60%
-40%
-20%
0%
20%
40%
60%
2019.10.15 2019.11.12 2019.12.10 2020.01.10 2020.02.11
Increase rate of stock price rise
A sector
B sector
Total average
LG chem](data:image/gif;base64,R0lGODlhAQABAIAAAAAAAP///yH5BAEAAAAALAAAAAABAAEAAAIBRAA7)
Recommended
Recommended
More Related Content
What's hot
What's hot (20)
Similar to LG chem 051910 Algorithm Investment Report
Similar to LG chem 051910 Algorithm Investment Report (20)
More from 알고리즘 기업분석 컨설팅-알기컨,algikeon
More from 알고리즘 기업분석 컨설팅-알기컨,algikeon (20)
Recently uploaded
Recently uploaded (20)
LG chem 051910 Algorithm Investment Report
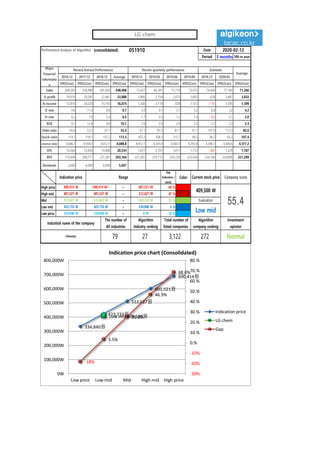
- 1. Performance Analysis of Algorithm (consolidated) 051910 Date Period 3 months 100-m won 2016.12 2017.12 2018.12 Average 2018.12 2019.03 2019.06 2019.09 2019.12 2020.03 IFRS(Con) IFRS(Con) IFRS(Con) IFRS(Con) IFRS(Con) IFRS(Con) IFRS(Con) IFRS(Con) IFRS(Con) IFRS(Con) IFRS(Con) Sales 206,593 256,980 281,830 248,468 73,427 66,391 71,774 73,473 74,428 77,160 71,266 O-profit 19,919 29,285 22,461 23,888 2,896 2,754 2,675 3,803 628 2,487 3,032 N-income 12,810 20,220 15,193 16,074 1,266 2,119 838 1,372 -115 1,595 1,399 O-rate 9.6 11.4 8.0 9.7 3.9 4.1 3.7 5.2 0.8 3.2 4.2 N-rate 6.2 7.9 5.4 6.5 1.7 3.2 1.2 1.9 -0.2 2.1 2.0 ROE 9.1 12.4 8.8 10.1 2.9 3.9 2.9 3.2 2.5 3.2 3.3 Debt-ratio 45.8 53.3 67.1 55.4 67.1 81.5 87.7 91.7 101.9 113.3 82.0 Quick-ratio 114.7 118.1 107.2 113.3 107.2 108.3 115.7 98.3 96.5 95.2 107.4 reserve-ratio 3,686.2 4,168.0 4,412.1 4,088.8 4,412.1 4,343.4 4,360.3 4,392.8 4,386.7 4,380.6 4,377.2 EPS 16,364 25,830 19,408 20,534 1,617 2,707 1,071 1,753 -361 1,329 1,787 BPS 179,494 208,717 221,281 203,164 221,281 219,712 220,729 223,436 224,166 224,898 221,289 Dividends 5,000 6,000 6,000 5,667 2020-02-12 Major Financial Informatio n Recent Annual Performance Recent quarterly performance Estimate Average Gap (Indication / stock) Color High price ~ 69 % High mid ~ 47 % Mid ~ 25 % Low mid ~ 3 % Low price ~ -18 % Indication price Range Current stock price Company score 601,521 W 601,521 W 512,627 W 512,627 W 512,627 W 423,733 W Evaluation 690,414 W 690,414 W~ 601,521 W 409,500 W 55.4423,733 W 423,733 W 334,840 W Low mid Normal 334,840 W 334,840 W 0 W Industrial name of the company The number of All industries Algorithm Industry ranking Total number of listed companies Algorithm company ranking Investment opinion Chemistry 79 27 3,122 272 334,840원 423,733원 512,627원 601,521원 690,414원 Low mid 409,500원 -18% 3.5% 25.2% 46.9% 68.6% -30% -20% -10% 0.% 10.% 20.% 30.% 40.% 50.% 60.% 70.% 80.% 0W 100,000W 200,000W 300,000W 400,000W 500,000W 600,000W 700,000W 800,000W Low price Low mid Mid High mid High price Indication price chart (Consolidated) Indication price LG chem Gap LG chem
- 2. [Price for scheduled purchasing] Arbitrarily made Algorithm stocks Trading Strategies (consolidated) 051910 Date Period Gap (Indication / stock) Color 2020-02-12 3 months Current stock price Evaluation Stock price rise probability score Investment opinion Prospective purchase amount 409,500 W Low mid 48.4 Normal 10,000,000 W Suggested Purchase Amount 4,625,773 W Number of stocks purchased 11 Indication price Range Buying / Selling Buying / Selling [Stocks] High price 690,414 W 690,414 W~ ~ 601,521 W 69 % -3,173,251 W -5 High mid 601,521 W 601,521 W ~ 512,627 W 47 % -2,169,095 W -4 Mid 512,627 W 512,627 W ~ 423,733 W 25 % -1,164,939 W -2 Low mid 423,733 W 423,733 W ~ 334,840 W 3 % -160,782 W -0 low price 334,840 W 334,840 W ~ 0 W -18 % 843,374 W 3 Stock price rise probability score A Sector 48.2 46.9 44.3 46.9 49.6 46.8 48.4B Sector 32.1 35.4 22.1 46.9 36.7 40.4 Total average 2019.09.11 2019.10.15 2019.11.12 2019.12.10 2020.01.10 2020.02.11 40.2 41.2 33.2 25.0 43.2 43.6 42 % 1 % 2019.10.15 2019.11.12 2019.12.10 2020.01.10 2020.02.11 Total of increase rate Total score A Sector -3 % -6 % 6 % 5 % -6 % -2 % 45.7B Sector 9 % -60 % 53 % -28 % 9 % Total average 2 % -24 % -33 % 48 47 44 47 50 47 32 35 22 47 37 4040 41 33 25 43 44 0 10 20 30 40 50 60 2019.09.11 2019.10.15 2019.11.12 2019.12.10 2020.01.10 2020.02.11 Stock price rise probability score A sector B sector Total average -3% -6% 6% 5% -6% 9% -60% 53% -28% 9% 2% -24% -33% 42% 1% -80% -60% -40% -20% 0% 20% 40% 60% 2019.10.15 2019.11.12 2019.12.10 2020.01.10 2020.02.11 Increase rate of stock price rise A sector B sector Total average LG chem
- 3. Compliance notice ① The information provided by The Algorithm Company Analysis Consulting is obtained through reliable data and information and The Algorithm Company Analysis Program (TACAP), but its accuracy or completeness are not guaranteed. Furthermore, it may change over time.Therefore, we are not legally responsible for the results of the data provided by The Algorithm Company Analysis Consulting because of information errors or omissions. ② The Algorithm Company Analysis Consulting and all the information provided on it site are reference materials for investment decisions and the final responsibility of investment is up to users utilizing this information. ③ The Algorithm Company Analysis Consulting and its site do not do anything that violates the related laws such as discretionary transaction. ④ Users can not reallocate and recycle the information provided by The Algorithm Company Analysis Consulting firm let alone the information provided by its Site. ⑤ Be sure to know about application period of this algorithm analysis report in order to improve its accuracy. Tel : 070 - 4667 - 5009 Email : tacac@tacac.co.kr Homepage : tacac.co.kr Blog : tacac.blog.me SERVICES M&A, IPO, RECOVER, CORPORATE RESTRUCTURING, MANAGEMENT OF TECHNOLOGY, BUSINESS STRATEGY, FAMILY BUSINESS Request : http://tacac.co.kr/?page_id=1374 ① Consulting is ob The Algorithm C accuracy or com may change ove for the results o Analysis Consul ② information prov investment decis up ③ do anything tha transaction. ④ by information prov ⑤ analysis report i