sk 034730 Algorithm Investment Report
•
0 likes•25 views

sk 034730 Algorithm Investment Report
![[Price for scheduled purchasing]
Arbitrarily made
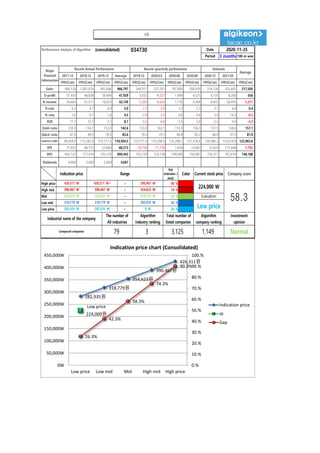
Algorithm stocks Trading Strategies (consolidated) 034730 Date
Period
Gap
(Indication /
stock)
Color
2020-11-25
3 months
Current stock price Evaluation
Stock price rise
probability score
Investment opinion Prospective purchase amount
224,000 W Low price 39.5 Normal 8,000,000 W
Suggested Purchase
Amount 3,219,732 W
Number of stocks
purchased 14
Indication price Range Buying / Selling Buying / Selling [Stocks]
High price 426,311 W 426,311 W~ ~ 390,467 W 90 % -2,907,974 W -7
High mid 390,467 W 390,467 W ~ 354,623 W 74 % -2,392,760 W -6
Mid 354,623 W 354,623 W ~ 318,779 W 58 % -1,877,545 W -5
Low mid 318,779 W 318,779 W ~ 282,935 W 42 % -1,362,330 W -4
low price 282,935 W 282,935 W ~ 0 W 26 % -847,116 W -3
Stock price rise
probability score
A Sector 46.8 51.7 43.6 47.5 47.5 49.6
39.5B Sector 62.9 51.7 27.1 47.5 25.0 23.3
Total average
2020.06.30 2020.07.28 2020.08.26 2020.09.23 2020.10.27 2020.11.24
54.8 51.7 35.3 34.6 36.2 36.4
5 % 1 %
2020.07.28 2020.08.26 2020.09.23 2020.10.27 2020.11.24
Total of
increase rate
Total score
A Sector 10 % -19 % 8 % -0 % 4 %
-10 % 39.3B Sector -22 % -91 % 43 % -90 % -7 %
Total average -6 % -46 % -2 %
47
52
44
48 47 50
63
52
27
48
25 23
55
52
35 35 36 36
0
10
20
30
40
50
60
70
2020.06.30 2020.07.28 2020.08.26 2020.09.23 2020.10.27 2020.11.24
Stock price rise probability score
A sector
B sector
Total average
10%
-19%
8%
-0% 4%
-22%
-91%
43%
-90%
-7%-6%
-46%
-2%
5% 1%
-100%
-80%
-60%
-40%
-20%
0%
20%
40%
60%
2020.07.28 2020.08.26 2020.09.23 2020.10.27 2020.11.24
Increase rate of stock price rise
A sector
B sector
Total average
sk](data:image/gif;base64,R0lGODlhAQABAIAAAAAAAP///yH5BAEAAAAALAAAAAABAAEAAAIBRAA7)
Recommended
Recommended
More Related Content
What's hot
What's hot (20)
Similar to sk 034730 Algorithm Investment Report
Similar to sk 034730 Algorithm Investment Report (20)
More from 알고리즘 기업분석 컨설팅-알기컨,algikeon
More from 알고리즘 기업분석 컨설팅-알기컨,algikeon (20)
Recently uploaded
Recently uploaded (20)
sk 034730 Algorithm Investment Report
- 1. Performance Analysis of Algorithm (consolidated) 034730 Date Period 3 months 100-m won 2017.12 2018.12 2019.12 Average 2019.12 2020.03 2020.06 2020.09 2020.12 2021.03 IFRS(Con) IFRS(Con) IFRS(Con) IFRS(Con) IFRS(Con) IFRS(Con) IFRS(Con) IFRS(Con) IFRS(Con) IFRS(Con) IFRS(Con) Sales 906,128 1,001,616 992,646 966,797 244,911 237,261 187,809 200,039 214,136 202,661 217,505 O-profit 57,450 46,838 39,499 47,929 5,035 -9,227 1,890 4,525 6,735 8,200 556 N-income 50,665 61,511 16,072 42,749 -7,203 -8,324 1,176 9,268 8,455 28,995 -1,271 O-rate 6.3 4.7 4.0 5.0 2.1 -3.9 1.0 2.3 3.1 4.0 0.4 N-rate 5.6 6.1 1.6 4.5 -2.9 -3.5 0.6 4.6 3.9 14.3 -0.3 ROE 11.1 12.1 3.1 8.7 -5.5 -6.0 -3.5 -2.0 -2.2 0.4 -4.3 Debt-ratio 139.9 134.7 153.0 142.6 153.0 163.1 155.9 156.3 157.5 158.6 157.1 Quick-ratio 81.9 90.5 78.5 83.6 78.5 79.1 86.8 83.2 86.9 91.5 81.9 reserve-ratio 96,458.4 115,283.8 119,771.4 110,504.5 119,771.4 119,308.4 125,298.1 127,476.6 130,486.2 133,678.8 122,963.6 EPS 71,433 86,725 22,660 60,273 -10,156 -11,736 1,658 13,067 12,433 171,444 -1,792 BPS 645,125 717,474 735,729 699,443 735,729 724,138 749,900 750,987 756,311 761,674 740,188 Dividends 4,000 5,000 5,000 4,667 2020-11-25 Major Financial Information Recent Annual Performance Recent quarterly performance Estimate Average Gap (Indication / stock) Color High price ~ 90 % High mid ~ 74 % Mid ~ 58 % Low mid ~ 42 % Low price ~ 26 % Indication price Range Current stock price Company score 390,467 W 390,467 W 354,623 W 354,623 W 354,623 W 318,779 W Evaluation 426,311 W 426,311 W~ 390,467 W 224,000 W 58.3318,779 W 318,779 W 282,935 W Low price Normal 282,935 W 282,935 W 0 W Industrial name of the company The number of All industries Algorithm Industry ranking Total number of listed companies Algorithm company ranking Investment opinion Compound companies 79 3 3,125 1,149 282,935원 318,779원 354,623원 390,467원 426,311원 Low price 224,000원 26.3% 42.3% 58.3% 74.3% 90.3% 0.% 10.% 20.% 30.% 40.% 50.% 60.% 70.% 80.% 90.% 100.% 0W 50,000W 100,000W 150,000W 200,000W 250,000W 300,000W 350,000W 400,000W 450,000W Low price Low mid Mid High mid High price Indication price chart (Consolidated) Indication price sk Gap sk
- 2. [Price for scheduled purchasing] Arbitrarily made Algorithm stocks Trading Strategies (consolidated) 034730 Date Period Gap (Indication / stock) Color 2020-11-25 3 months Current stock price Evaluation Stock price rise probability score Investment opinion Prospective purchase amount 224,000 W Low price 39.5 Normal 8,000,000 W Suggested Purchase Amount 3,219,732 W Number of stocks purchased 14 Indication price Range Buying / Selling Buying / Selling [Stocks] High price 426,311 W 426,311 W~ ~ 390,467 W 90 % -2,907,974 W -7 High mid 390,467 W 390,467 W ~ 354,623 W 74 % -2,392,760 W -6 Mid 354,623 W 354,623 W ~ 318,779 W 58 % -1,877,545 W -5 Low mid 318,779 W 318,779 W ~ 282,935 W 42 % -1,362,330 W -4 low price 282,935 W 282,935 W ~ 0 W 26 % -847,116 W -3 Stock price rise probability score A Sector 46.8 51.7 43.6 47.5 47.5 49.6 39.5B Sector 62.9 51.7 27.1 47.5 25.0 23.3 Total average 2020.06.30 2020.07.28 2020.08.26 2020.09.23 2020.10.27 2020.11.24 54.8 51.7 35.3 34.6 36.2 36.4 5 % 1 % 2020.07.28 2020.08.26 2020.09.23 2020.10.27 2020.11.24 Total of increase rate Total score A Sector 10 % -19 % 8 % -0 % 4 % -10 % 39.3B Sector -22 % -91 % 43 % -90 % -7 % Total average -6 % -46 % -2 % 47 52 44 48 47 50 63 52 27 48 25 23 55 52 35 35 36 36 0 10 20 30 40 50 60 70 2020.06.30 2020.07.28 2020.08.26 2020.09.23 2020.10.27 2020.11.24 Stock price rise probability score A sector B sector Total average 10% -19% 8% -0% 4% -22% -91% 43% -90% -7%-6% -46% -2% 5% 1% -100% -80% -60% -40% -20% 0% 20% 40% 60% 2020.07.28 2020.08.26 2020.09.23 2020.10.27 2020.11.24 Increase rate of stock price rise A sector B sector Total average sk
- 3. 정보와 완전 정보 결 투자판단 있습니 위배 무단으 숙지하 Compliance notice ① The information provided by The Algorithm Company Analysis Consulting is obtained through reliable data and information and The Algorithm Company Analysis Program (TACAP), but its accuracy or completeness are not guaranteed. Furthermore, it may change over time.Therefore, we are not legally responsible for the results of the data provided by The Algorithm Company Analysis Consulting because of information errors or omissions. ② The Algorithm Company Analysis Consulting and all the information provided on it site are reference materials for investment decisions and the final responsibility of investment is up to users utilizing this information. ③ The Algorithm Company Analysis Consulting and its site do not do anything that violates the related laws such as discretionary transaction. ④ Users can not reallocate and recycle the information provided by The Algorithm Company Analysis Consulting firm let alone the information provided by its Site. ⑤ Be sure to know about application period of this algorithm analysis report in order to improve its accuracy. Tel : 070 - 4667 - 5009 Email : tacac@tacac.co.kr Homepage : tacac.co.kr Blog : tacac.blog.me SERVICES M&A, IPO, RECOVER, CORPORATE RESTRUCTURING, MANAGEMENT OF TECHNOLOGY, BUSINESS STRATEGY, FAMILY BUSINESS Request : http://tacac.co.kr/?page_id=1374 ① Consulting is o The Algorithm accuracy or com change over tim results of the d Consulting bec ② information pr investment dec up ③ do anything th transaction. ④ The Algorithm information pr ⑤ analysis report