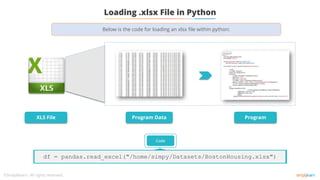
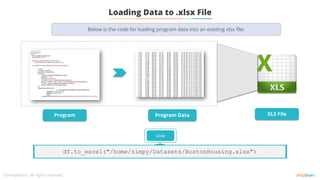
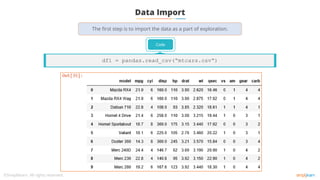
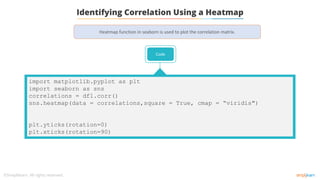
The document discusses data wrangling and manipulation techniques in machine learning. It covers topics like data exploration, data wrangling, data acquisition, and data manipulation in Python. It demonstrates techniques like loading CSV and Excel files, exploring data through dimensionality checks, slicing, and correlation analysis. The objectives are to perform data wrangling and understand its significance, manipulate data in Python using coercion and merging, and explore data using Python.


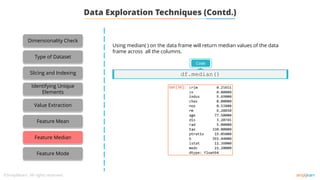
![Data Exploration Techniques (Contd.)
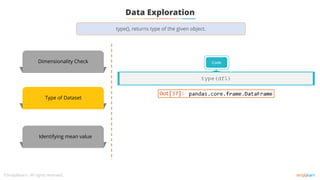
You can use the type ( ) in python to return the type of object.
Code
type(df)
Checking the type of data frame:
Checking the type of a column (çhas) within a data frame:
Code
df['chas'].dtype
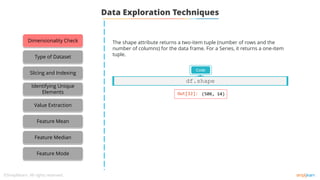
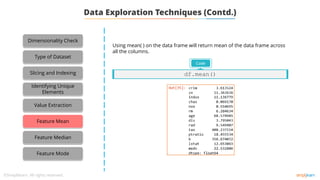
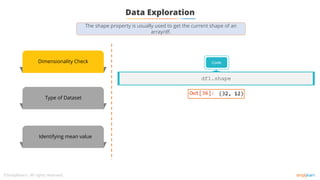
Dimensionality Check
Type of Dataset
Slicing and Indexing
Identifying Unique
Elements
Value Extraction
Feature Mean
Feature Median
Feature Mode](https://image.slidesharecdn.com/lesson2-datapreprocessing-211215083553/85/Lesson-2-data-preprocessing-11-320.jpg)
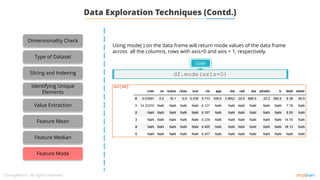
![Data Exploration Techniques (Contd.)
You can use the : operator with the start index on left and end index on
right of it to output the corresponding slice.
Slicing a list:
Slicing a Data frame (df) using iloc indexer:
Code
df.iloc[:,1:3]
list = [1,2,3,4,5]
Code
list[1:3]
Dimensionality Check
Type of Dataset
Slicing and Indexing
Identifying Unique
Elements
Value Extraction
Feature Mean
Feature Median
Feature Mode](https://image.slidesharecdn.com/lesson2-datapreprocessing-211215083553/85/Lesson-2-data-preprocessing-12-320.jpg)
![Using unique ( ) on the column of interest will return a numpy array with
unique values of the column.
Extracting all unique values out of ‘’crim” column:
Code
df['crim'].unique()
Dimensionality Check
Type of Dataset
Slicing and Indexing
Identifying Unique
Elements
Value Extraction
Feature Mean
Feature Median
Feature Mode
Data Exploration Techniques (Contd.)](https://image.slidesharecdn.com/lesson2-datapreprocessing-211215083553/85/Lesson-2-data-preprocessing-13-320.jpg)
![Using value ( ) on the column of interest will return a numpy array with all
the values of the column.
Extracting values out of ‘’crim” column:
Code
df['crim’].values()
Dimensionality Check
Type of Dataset
Slicing and Indexing
Identifying Unique
Elements
Value Extraction
Feature Mean
Feature Median
Feature Mode
Data Exploration Techniques (Contd.)](https://image.slidesharecdn.com/lesson2-datapreprocessing-211215083553/85/Lesson-2-data-preprocessing-14-320.jpg)


![Data Exploration
Dimensionality Check
Type of Dataset
Code
df1[‘hp’].mean()
Identifying mean value
mean( ) function can be used to calculate mean/average of a given list of numbers.](https://image.slidesharecdn.com/lesson2-datapreprocessing-211215083553/85/Lesson-2-data-preprocessing-27-320.jpg)

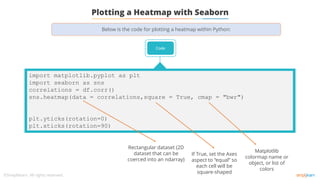
![Dealing with an Outlier
Outlier Detection
Outlier Treatment
Detect any outlier in the first column of df1
Code
import seaborn as sns
sns.boxplot(x=df1['Assignment'])
Outliers:
Values < 60](https://image.slidesharecdn.com/lesson2-datapreprocessing-211215083553/85/Lesson-2-data-preprocessing-38-320.jpg)
![Dealing with an Outlier
Outlier Detection
Outlier Treatment
Create a filter based on the boxplot obtained
and apply the filter to the data frame
Code
filter=df1['Assignment'].values>60
df1_outlier_rem=df1[filter]
df1_outlier_rem](https://image.slidesharecdn.com/lesson2-datapreprocessing-211215083553/85/Lesson-2-data-preprocessing-39-320.jpg)


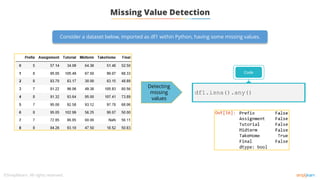
![Check for Irregularities
Check for missing values
Code
df1['hp'].isna().any()
Check for Outliers
Outlier
Code
sns.boxplot(x=df1['hp'])](https://image.slidesharecdn.com/lesson2-datapreprocessing-211215083553/85/Lesson-2-data-preprocessing-42-320.jpg)
![Outlier Treatment
Code
filter = df1['hp']<250
df1_out_rem = df1[filter]
sns.boxplot(x=df2_out_rem['hp'])
Outlier filtered
data
Data with hp>250 is the outlier data. Therefore, you can filter it accordingly.](https://image.slidesharecdn.com/lesson2-datapreprocessing-211215083553/85/Lesson-2-data-preprocessing-43-320.jpg)

![tail( )
values( )
groupby( )
Concatenation
Merging
head( )
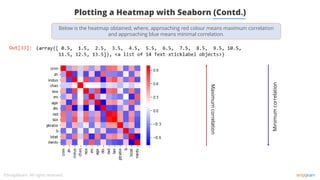
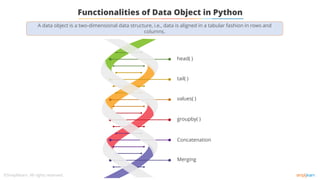
Functionalities of Data Object using Python (Contd.)
The Data Frame is grouped according to the ‘Team’ and ‘ICC_Rank’ columns
Code
import pandas as pd
world_cup={'Team':['West Indies','West
indies','India','Australia','Pakistan','Sri
Lanka','Australia','Australia','Australia','
Insia','Australia'],
'Rank':[7,7,2,1,6,4,1,1,1,2,1],
'Year':[1975,1979,1983,1987,1992,1996,1999,2003
,2007,2011,2015]}
df=pd.DataFrame(world_cup)
print(df.groupby(['Team','Rank’]).groups)](https://image.slidesharecdn.com/lesson2-datapreprocessing-211215083553/85/Lesson-2-data-preprocessing-49-320.jpg)
![tail( )
values( )
groupby( )
Concatenation
Merging
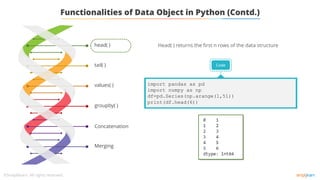
head( )
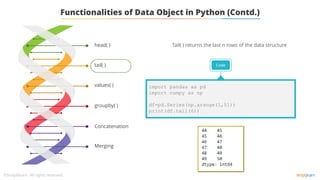
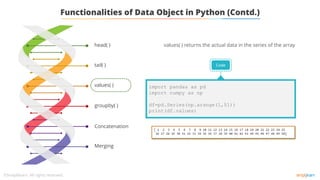
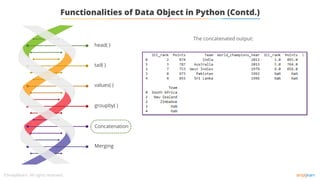
Functionalities of Data Object in Python (Contd.)
Concatenation combines two or more data structures.
Code
import pandas
world_champions={'Team':['India','Australia','West
Indies','Pakistan','Sri Lanka’],
'ICC_rank':[2,3,7,8,4],
'World_champions_Year':[2011,2015,1979,1992,1996],
'Points':[874,787,753,673,855]}
chokers={'Team':['South Africa','New
Zealand','Zimbabwe'],'ICC_rank':[1,5,9],
'Points':[895,764,656]}
df1=pandas.DataFrame(world_champions)
df2=pandas.DataFrame(chokers)
print(pandas.concat([df1,df2],axis=1))](https://image.slidesharecdn.com/lesson2-datapreprocessing-211215083553/85/Lesson-2-data-preprocessing-50-320.jpg)
![tail( )
values( )
groupby( )
Concatenation
Merging
head( )
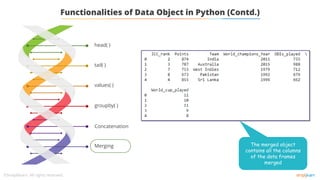
Functionalities of Data Object in Python (Contd.)
Merging is the Pandas operation that performs database joins on objects
Code
import pandas
champion_stats={'Team':['India','Australia','West
Indies','Pakistan','Sri Lanka'],
'ICC_rank':[2,3,7,8,4],
'World_champions_Year':[2011,2015,1979,1992,1996],
'Points':[874,787,753,673,855]}
match_stats={'Team':['India','Australia','West
Indies','Pakistan','Sri Lanka'],
'World_cup_played':[11,10,11,9,8],
'ODIs_played':[733,988,712,679,662]}
df1=pandas.DataFrame(champion_stats)
df2=pandas.DataFrame(match_stats)
print(df1)
print(df2)
print(pandas.merge(df1,df2,on='Team'))](https://image.slidesharecdn.com/lesson2-datapreprocessing-211215083553/85/Lesson-2-data-preprocessing-52-320.jpg)
![Left Join
Code
import pandas
world_champions={'Team':['India','Australia','West
Indies','Pakistan','Sri Lanka'],
'ICC_rank':[2,3,7,8,4],
'World_champions_Year':[2011,2015,1979,1992,1996],
'Points':[874,787,753,673,855]}
chokers={'Team':['South Africa','New
Zealand','Zimbabwe'],
'ICC_rank':[1,5,9],'Points':[895,764,656]}
df1=pandas.DataFrame(world_champions)
df2=pandas.DataFrame(chokers)
print(pandas.merge(df1,df2,on='Team',how='left'))
Returns all rows from
the left table, even if
there are no matches in
the right table
Left Join](https://image.slidesharecdn.com/lesson2-datapreprocessing-211215083553/85/Lesson-2-data-preprocessing-55-320.jpg)
![Right Join
Code
import pandas
world_champions={'Team':['India','Australia','West
Indies','Pakistan','Sri Lanka'],
'ICC_rank':[2,3,7,8,4],
'World_champions_Year':[2011,2015,1979,1992,1996],
'Points':[874,787,753,673,855]}
chokers={'Team':['South Africa','New
Zealand','Zimbabwe'],'ICC_rank':[1,5,9],'Points':[89
5,764,656]}
df1=pandas.DataFrame(world_champions)
df2=pandas.DataFrame(chokers)
print(pandas.merge(df1,df2,on='Team',how=‘right'))
Preserves the unmatched
rows from the second
(right) table, joining them
with a NULL in the shape
of the first (left) table
Right Join](https://image.slidesharecdn.com/lesson2-datapreprocessing-211215083553/85/Lesson-2-data-preprocessing-56-320.jpg)
![Inner Join
Code
import pandas
world_champions={'Team':['India','Australia','West
Indies','Pakistan','Sri Lanka'],
'ICC_rank':[2,3,7,8,4],
'World_champions_Year':[2011,2015,1979,1992,1996],
'Points':[874,787,753,673,855]}
chokers={'Team':['South Africa','New
Zealand','Zimbabwe'],'ICC_rank':[1,5,9],'Points':[89
5,764,656]}
df1=pandas.DataFrame(world_champions)
df2=pandas.DataFrame(chokers)
print(pandas.merge(df1,df2,on='Team',how=‘inner'))
Selects all rows from
both participating tables
if there is a match
between the columns
Inner Join](https://image.slidesharecdn.com/lesson2-datapreprocessing-211215083553/85/Lesson-2-data-preprocessing-57-320.jpg)
![Full Outer Join
Code
import pandas
world_champions={'Team':['India','Australia','West
Indies','Pakistan','Sri Lanka'],
'ICC_rank':[2,3,7,8,4],
'World_champions_Year':[2011,2015,1979,1992,1996],
'Points':[874,787,753,673,855]}
chokers={'Team':['South Africa',’New
Zealand','Zimbabwe'],'ICC_rank':[1,5,9],'Points':[89
5,764,656]}
df1=pandas.DataFrame(world_champions)
df2=pandas.DataFrame(chokers)
print(pandas.merge(df1,df2,on='Team',how=‘outer'))
Returns all records when
there is a match in either
left (table1) or right
(table2) table records
Full Outer Join](https://image.slidesharecdn.com/lesson2-datapreprocessing-211215083553/85/Lesson-2-data-preprocessing-58-320.jpg)


![Answer 1
Code
salary = pd.read_csv('Salaries.csv')
mean_year =
salary.groupby('Year').mean()['TotalPayBenefits']
print ( mean_year)
Check the mean salary cost per year and see how it has increased per
year.](https://image.slidesharecdn.com/lesson2-datapreprocessing-211215083553/85/Lesson-2-data-preprocessing-63-320.jpg)
![Answer 2
Code
top_sal =
salary.groupby('EmployeeName').sum()['TotalPayBenefi
ts']
print((top_sal.sort_values(axis=0)))
Group the total salary with respect to employee name:](https://image.slidesharecdn.com/lesson2-datapreprocessing-211215083553/85/Lesson-2-data-preprocessing-64-320.jpg)


![Knowledge
Check
a.
b.
c.
d.
What is the output of the below Python code?
import numpy as np percentiles = [98, 76.37, 55.55, 69, 88]
first_subject = np.array(percentiles) print first_subject.dtype
2
float32
float
int32
float64](https://image.slidesharecdn.com/lesson2-datapreprocessing-211215083553/85/Lesson-2-data-preprocessing-69-320.jpg)
![The correct answer is
a.
b.
c.
d.
Knowledge
Check
What is the output of the below Python code?
import numpy as np
percentiles = [98, 76.37, 55.55, 69, 88]
first_subject = np.array(percentiles)
print first_subject.dtype
Float64’s can represent numbers much more accurately than other floats and has more storage capacity.
d. float64
2
float32
float
int32
float64](https://image.slidesharecdn.com/lesson2-datapreprocessing-211215083553/85/Lesson-2-data-preprocessing-70-320.jpg)
![Lesson-End Project
Problem Statement: From the raw data below create a data frame:
'first_name': ['Jason', 'Molly', 'Tina', 'Jake', 'Amy'], 'last_name': ['Miller', 'Jacobson', ".", 'Milner', 'Cooze'],
'age': [42, 52, 36, 24, 73], 'preTestScore': [4, 24, 31, ".", "."],'postTestScore': ["25,000", "94,000", 57, 62, 70]
Objective: Perform data processing on raw data:
▪ Save the data frame into a csv file as project.csv
▪ Read the project.csv and print the data frame
▪ Read the project.csv without column heading
▪ Read the project.csv and make the index columns as 'First Name’ and 'Last Name'
▪ Print the data frame in a Boolean form as True or False. True for Null/ NaN values and false for
non-null values
▪ Read the data frame by skipping first 3 rows and print the data frame
Access: Click the Labs tab in the left side panel of the LMS. Copy or note the username and password that are
generated. Click the Launch Lab button. On the page that appears, enter the username and password in the
respective fields and click Login.
Duration: 20 mins.](https://image.slidesharecdn.com/lesson2-datapreprocessing-211215083553/85/Lesson-2-data-preprocessing-71-320.jpg)