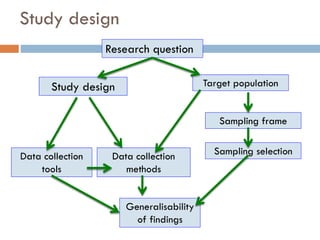
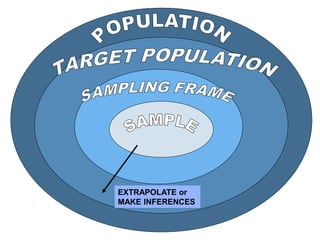
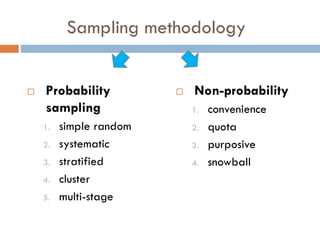
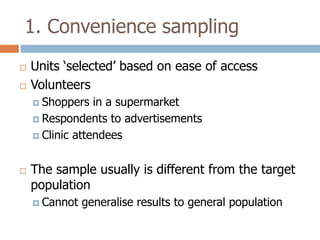
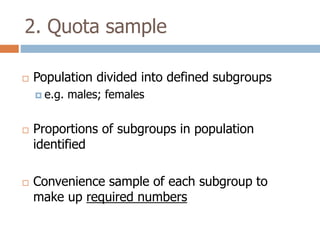
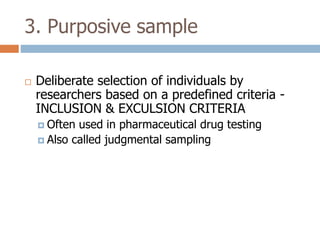
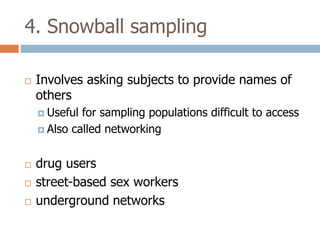
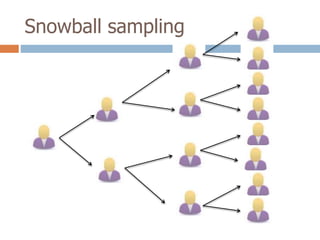
1. The document discusses key concepts in epidemiological sampling including different sampling methods such as probability and non-probability sampling.
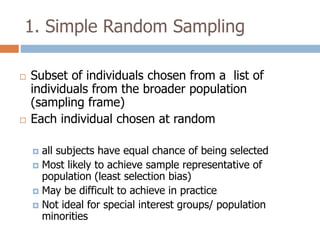
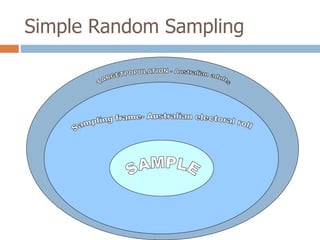
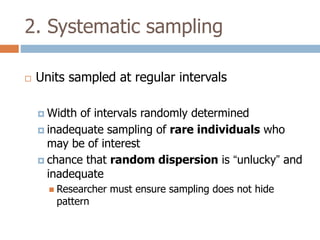
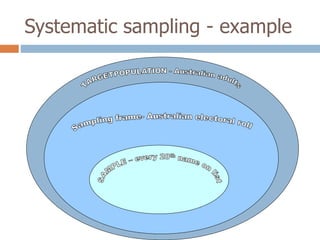
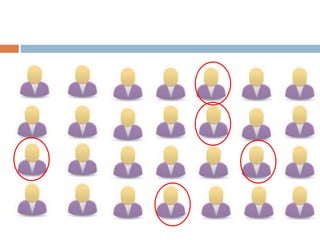
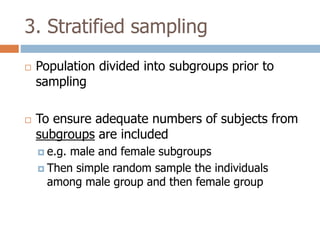
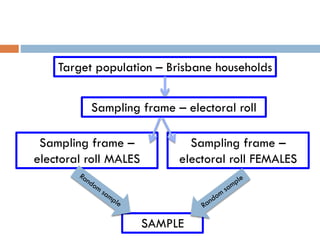
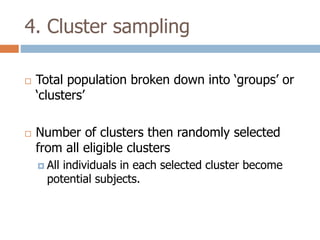
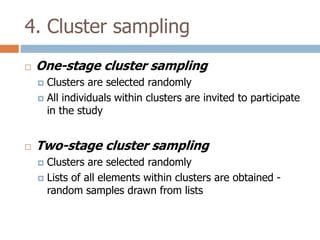
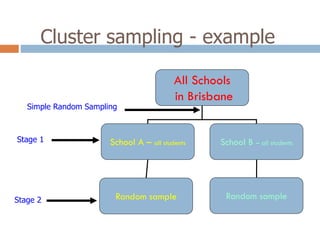
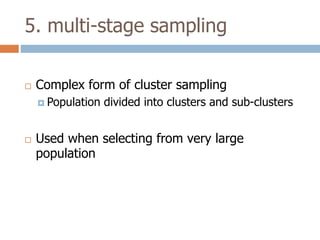
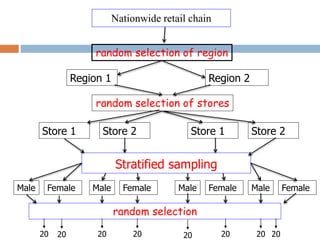
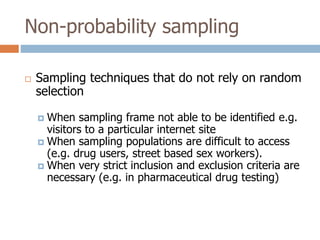
2. It describes specific sampling techniques like simple random sampling, stratified sampling, cluster sampling, and their advantages and limitations.
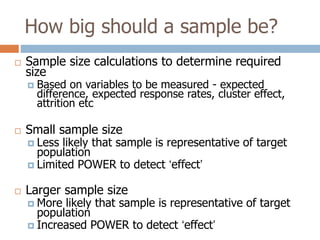
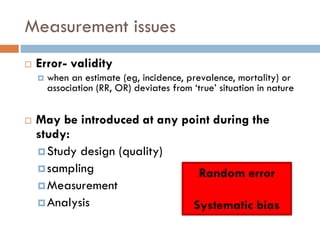
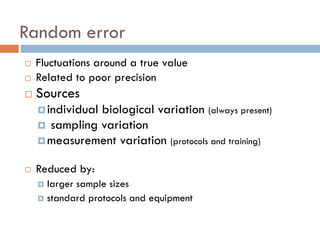
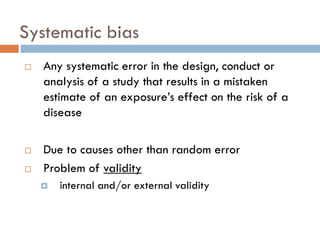
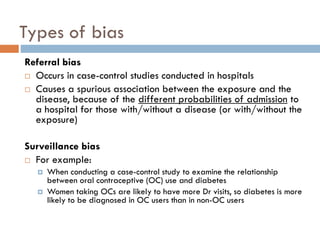
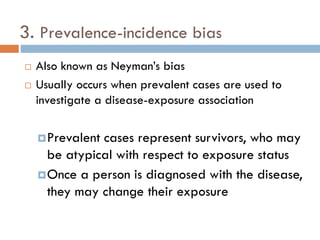
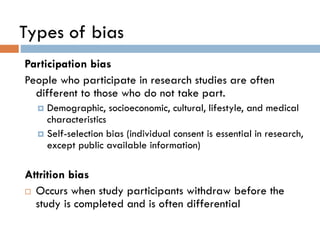
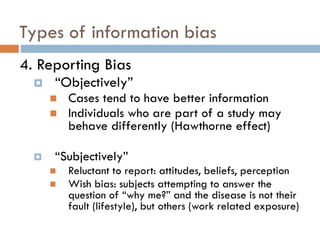
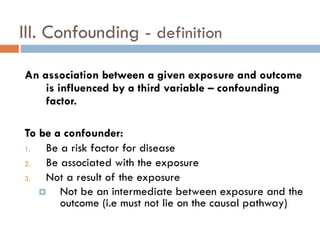
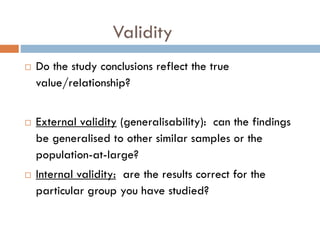
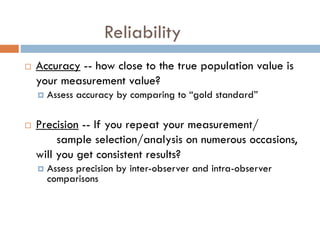
3. The document also discusses potential sources of bias and error in epidemiological studies from sampling, data collection and analysis that can influence the validity and reliability of findings.


![Sampling1[1]](https://cdn.slidesharecdn.com/ss_thumbnails/sampling11-120509162836-phpapp02-thumbnail.jpg?width=640&height=640&fit=bounds)


