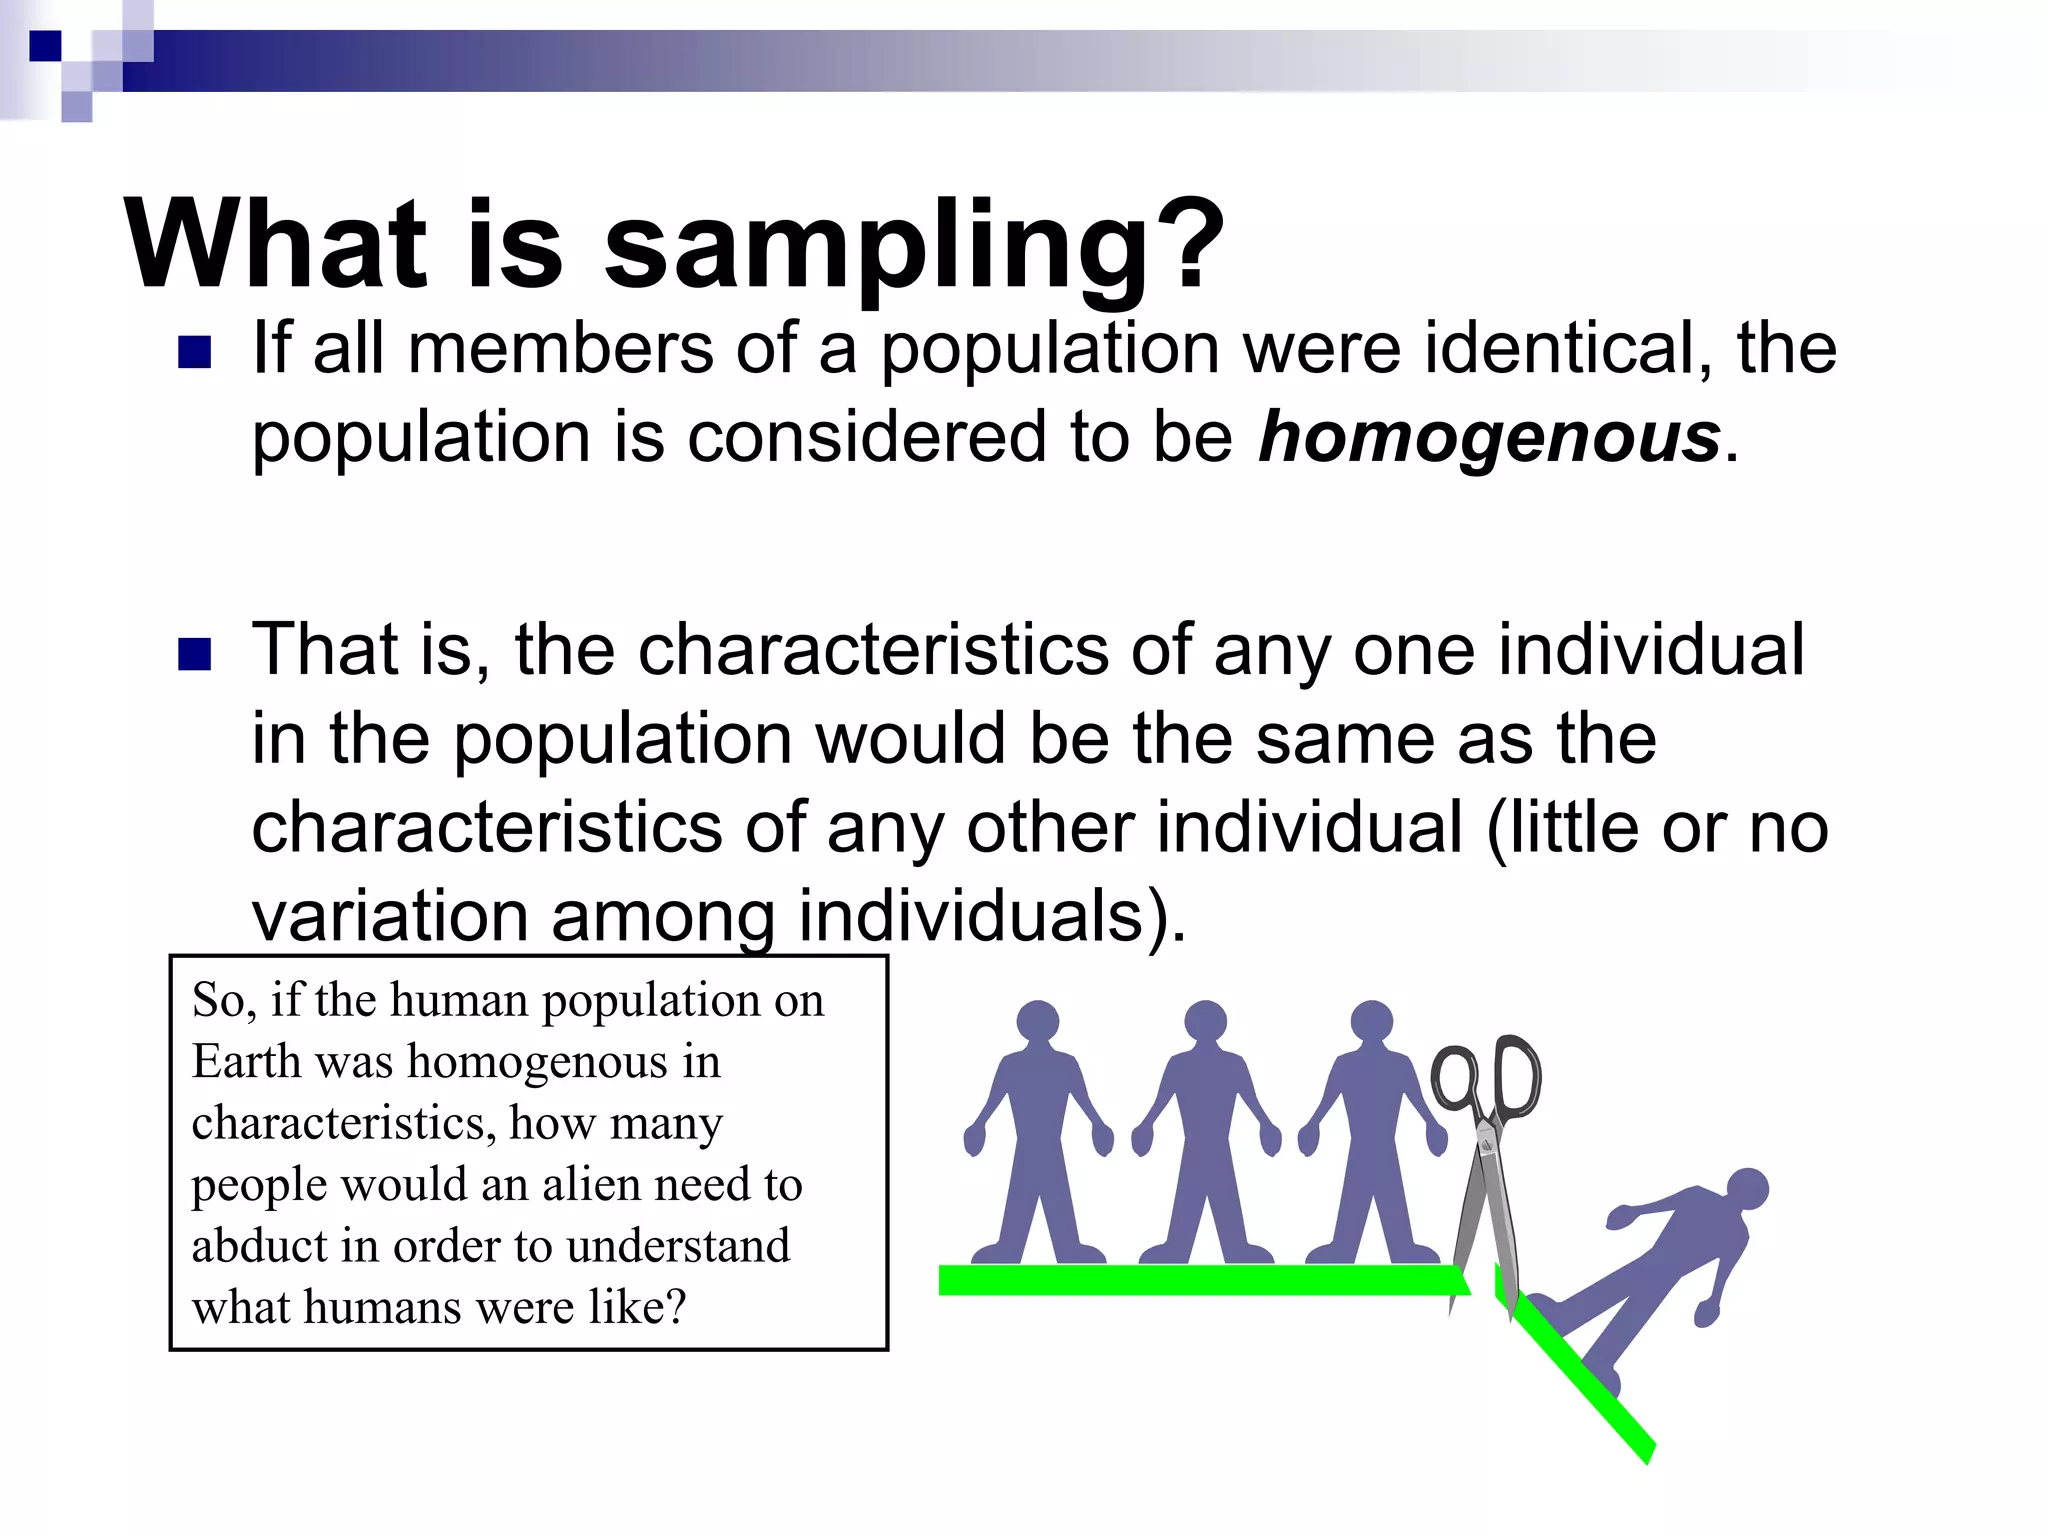
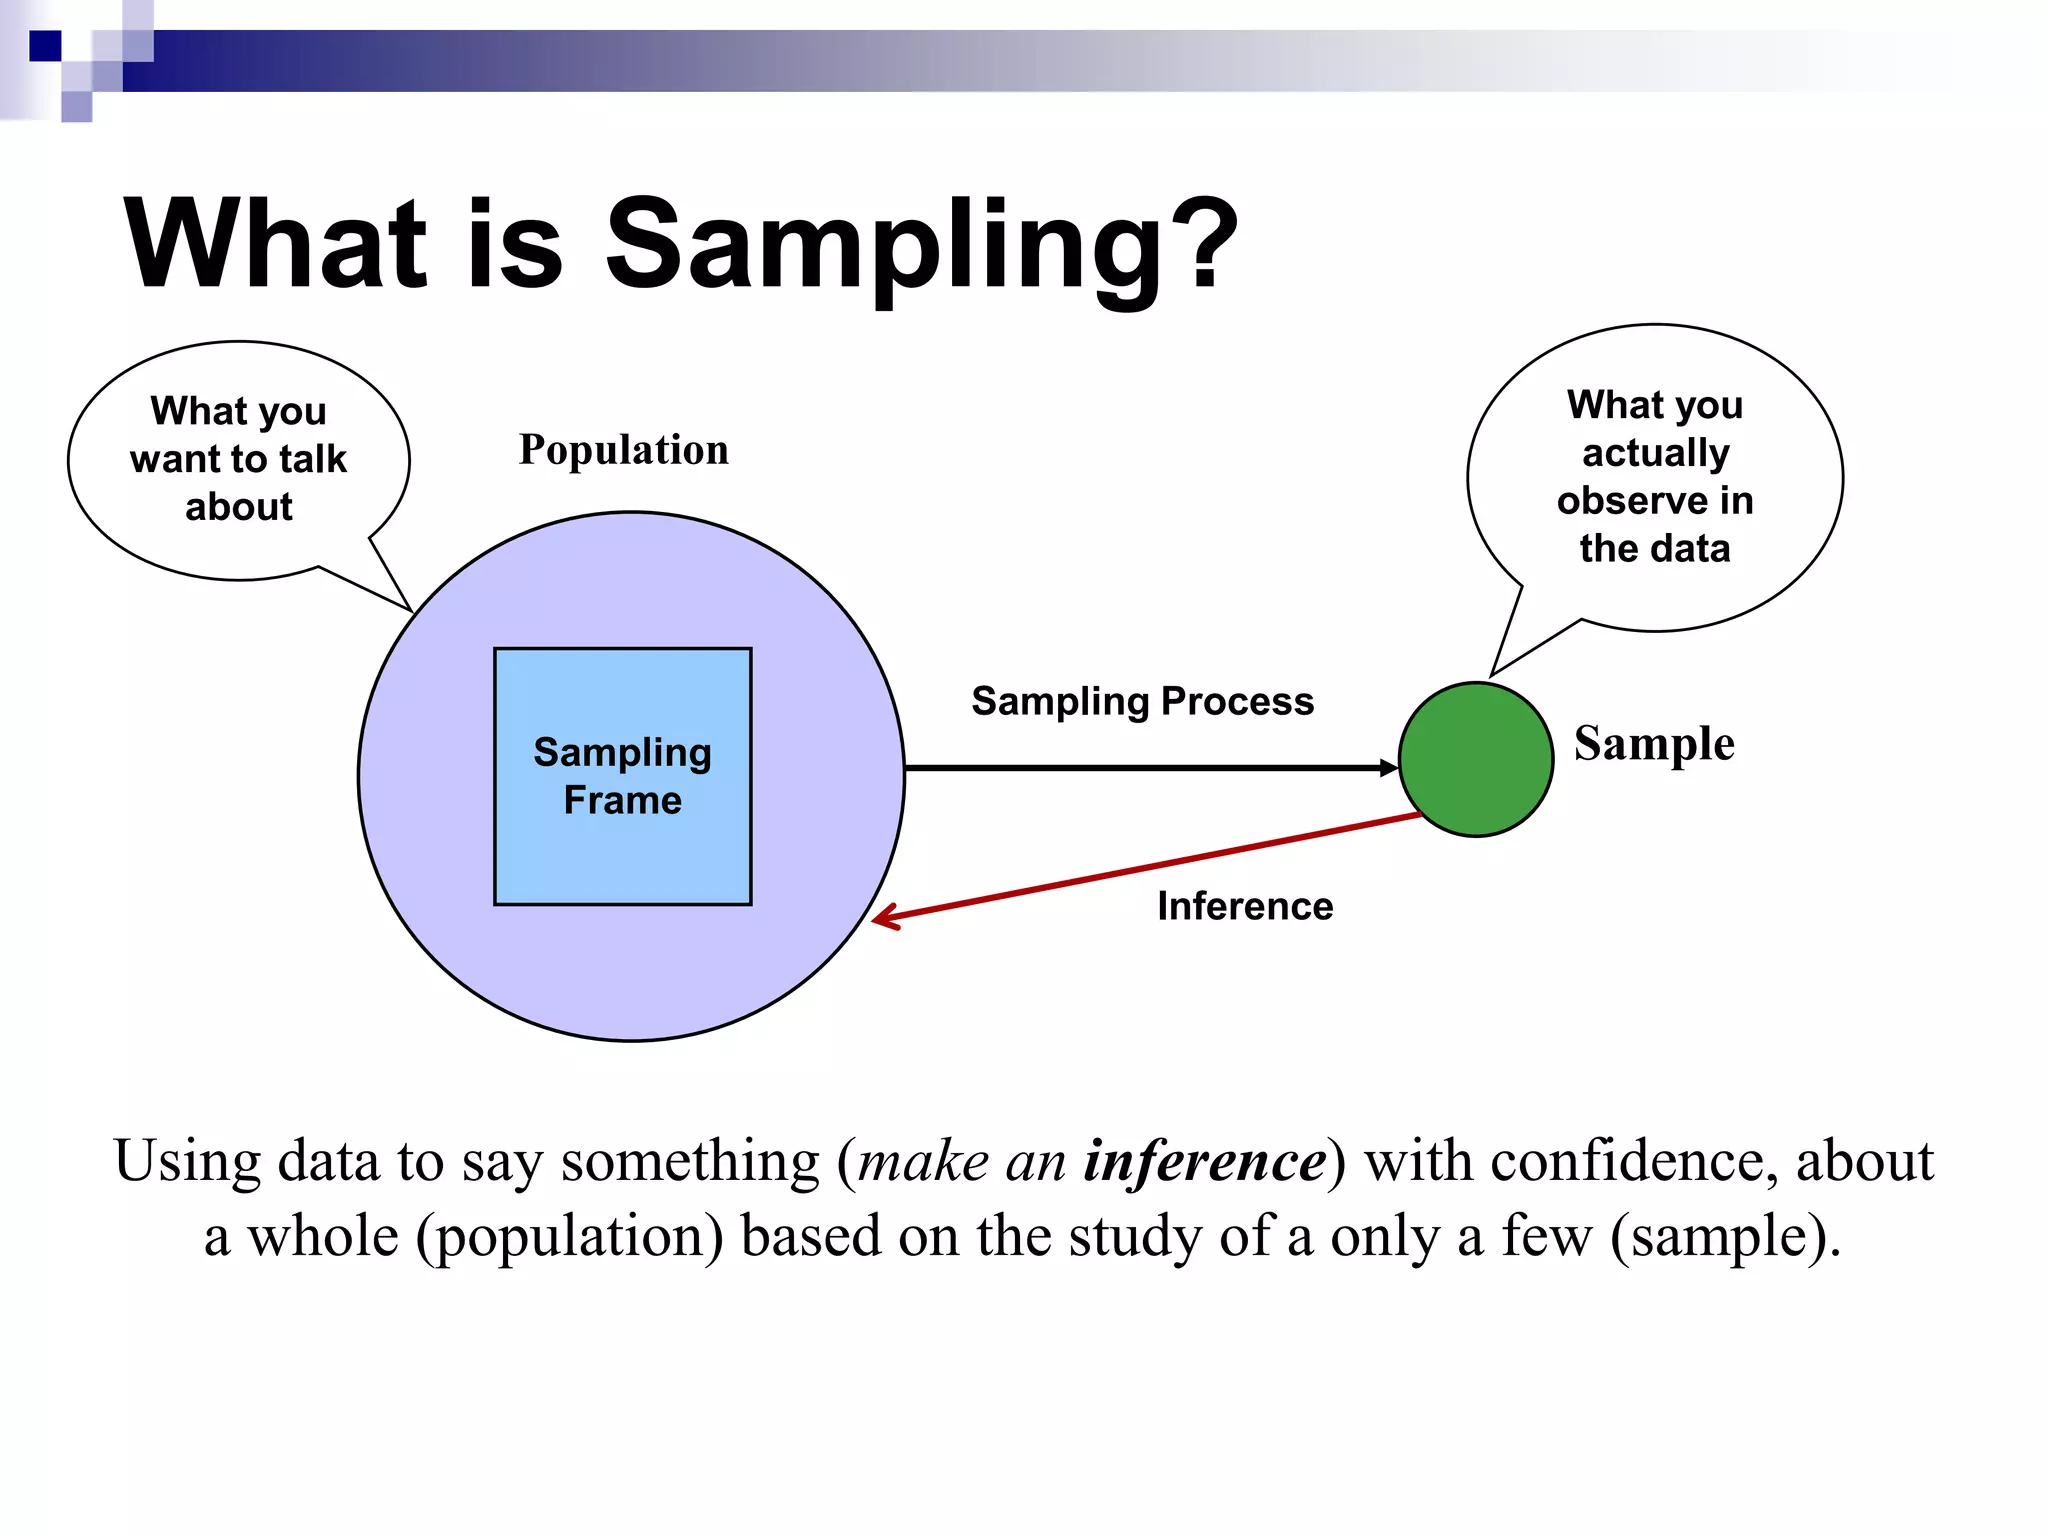
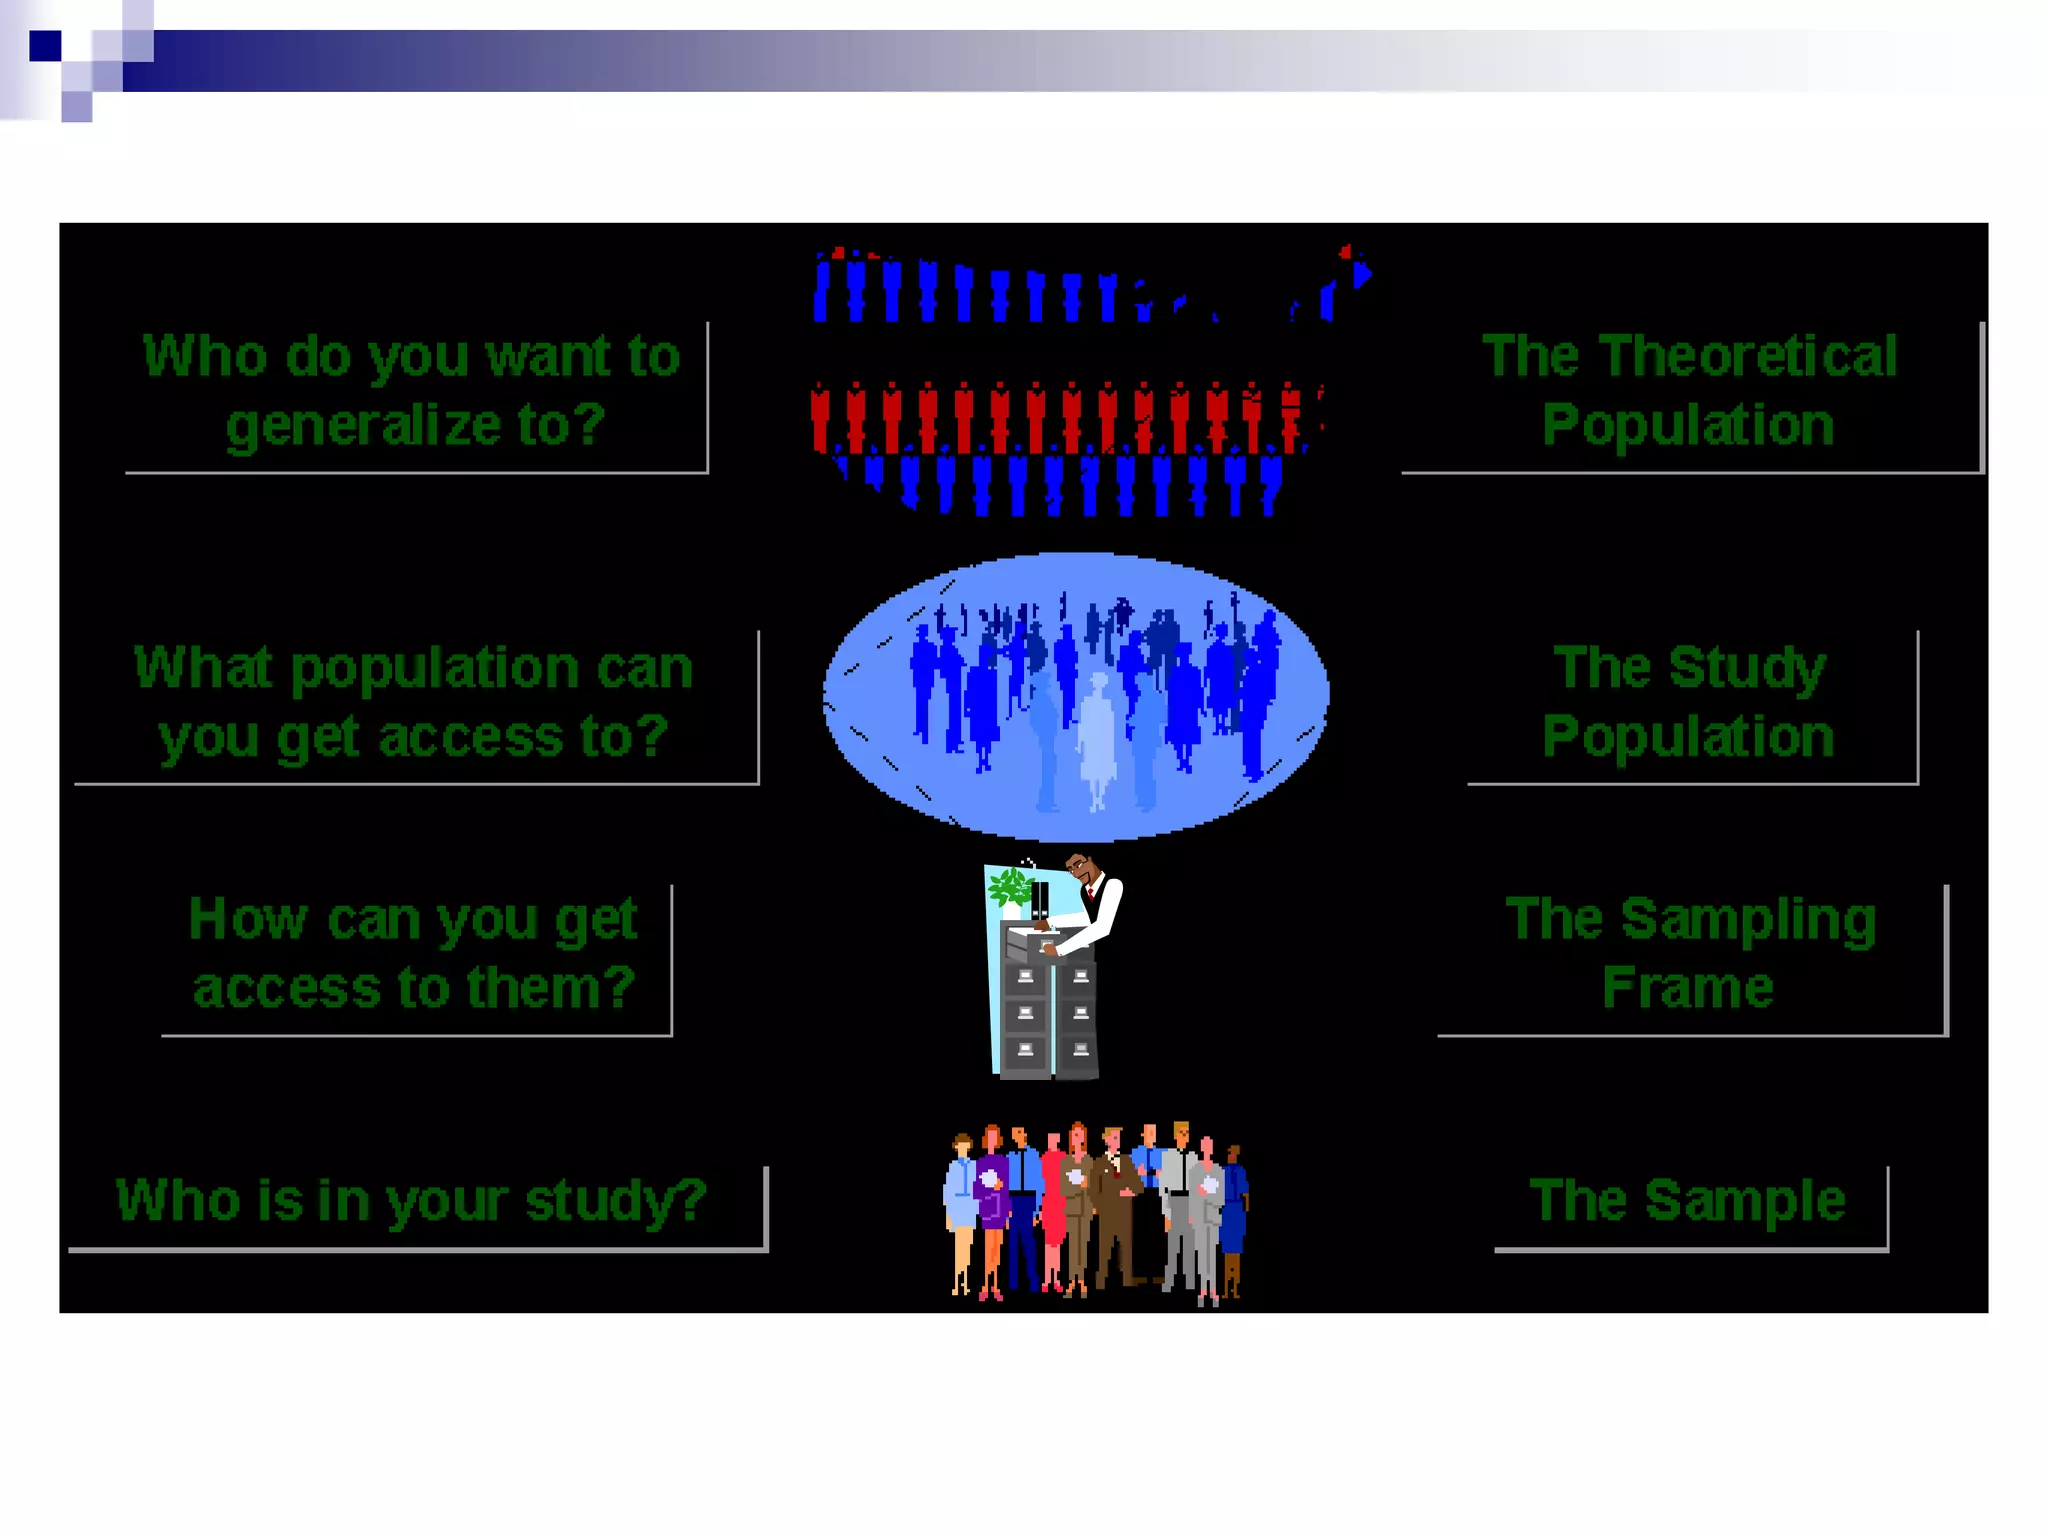
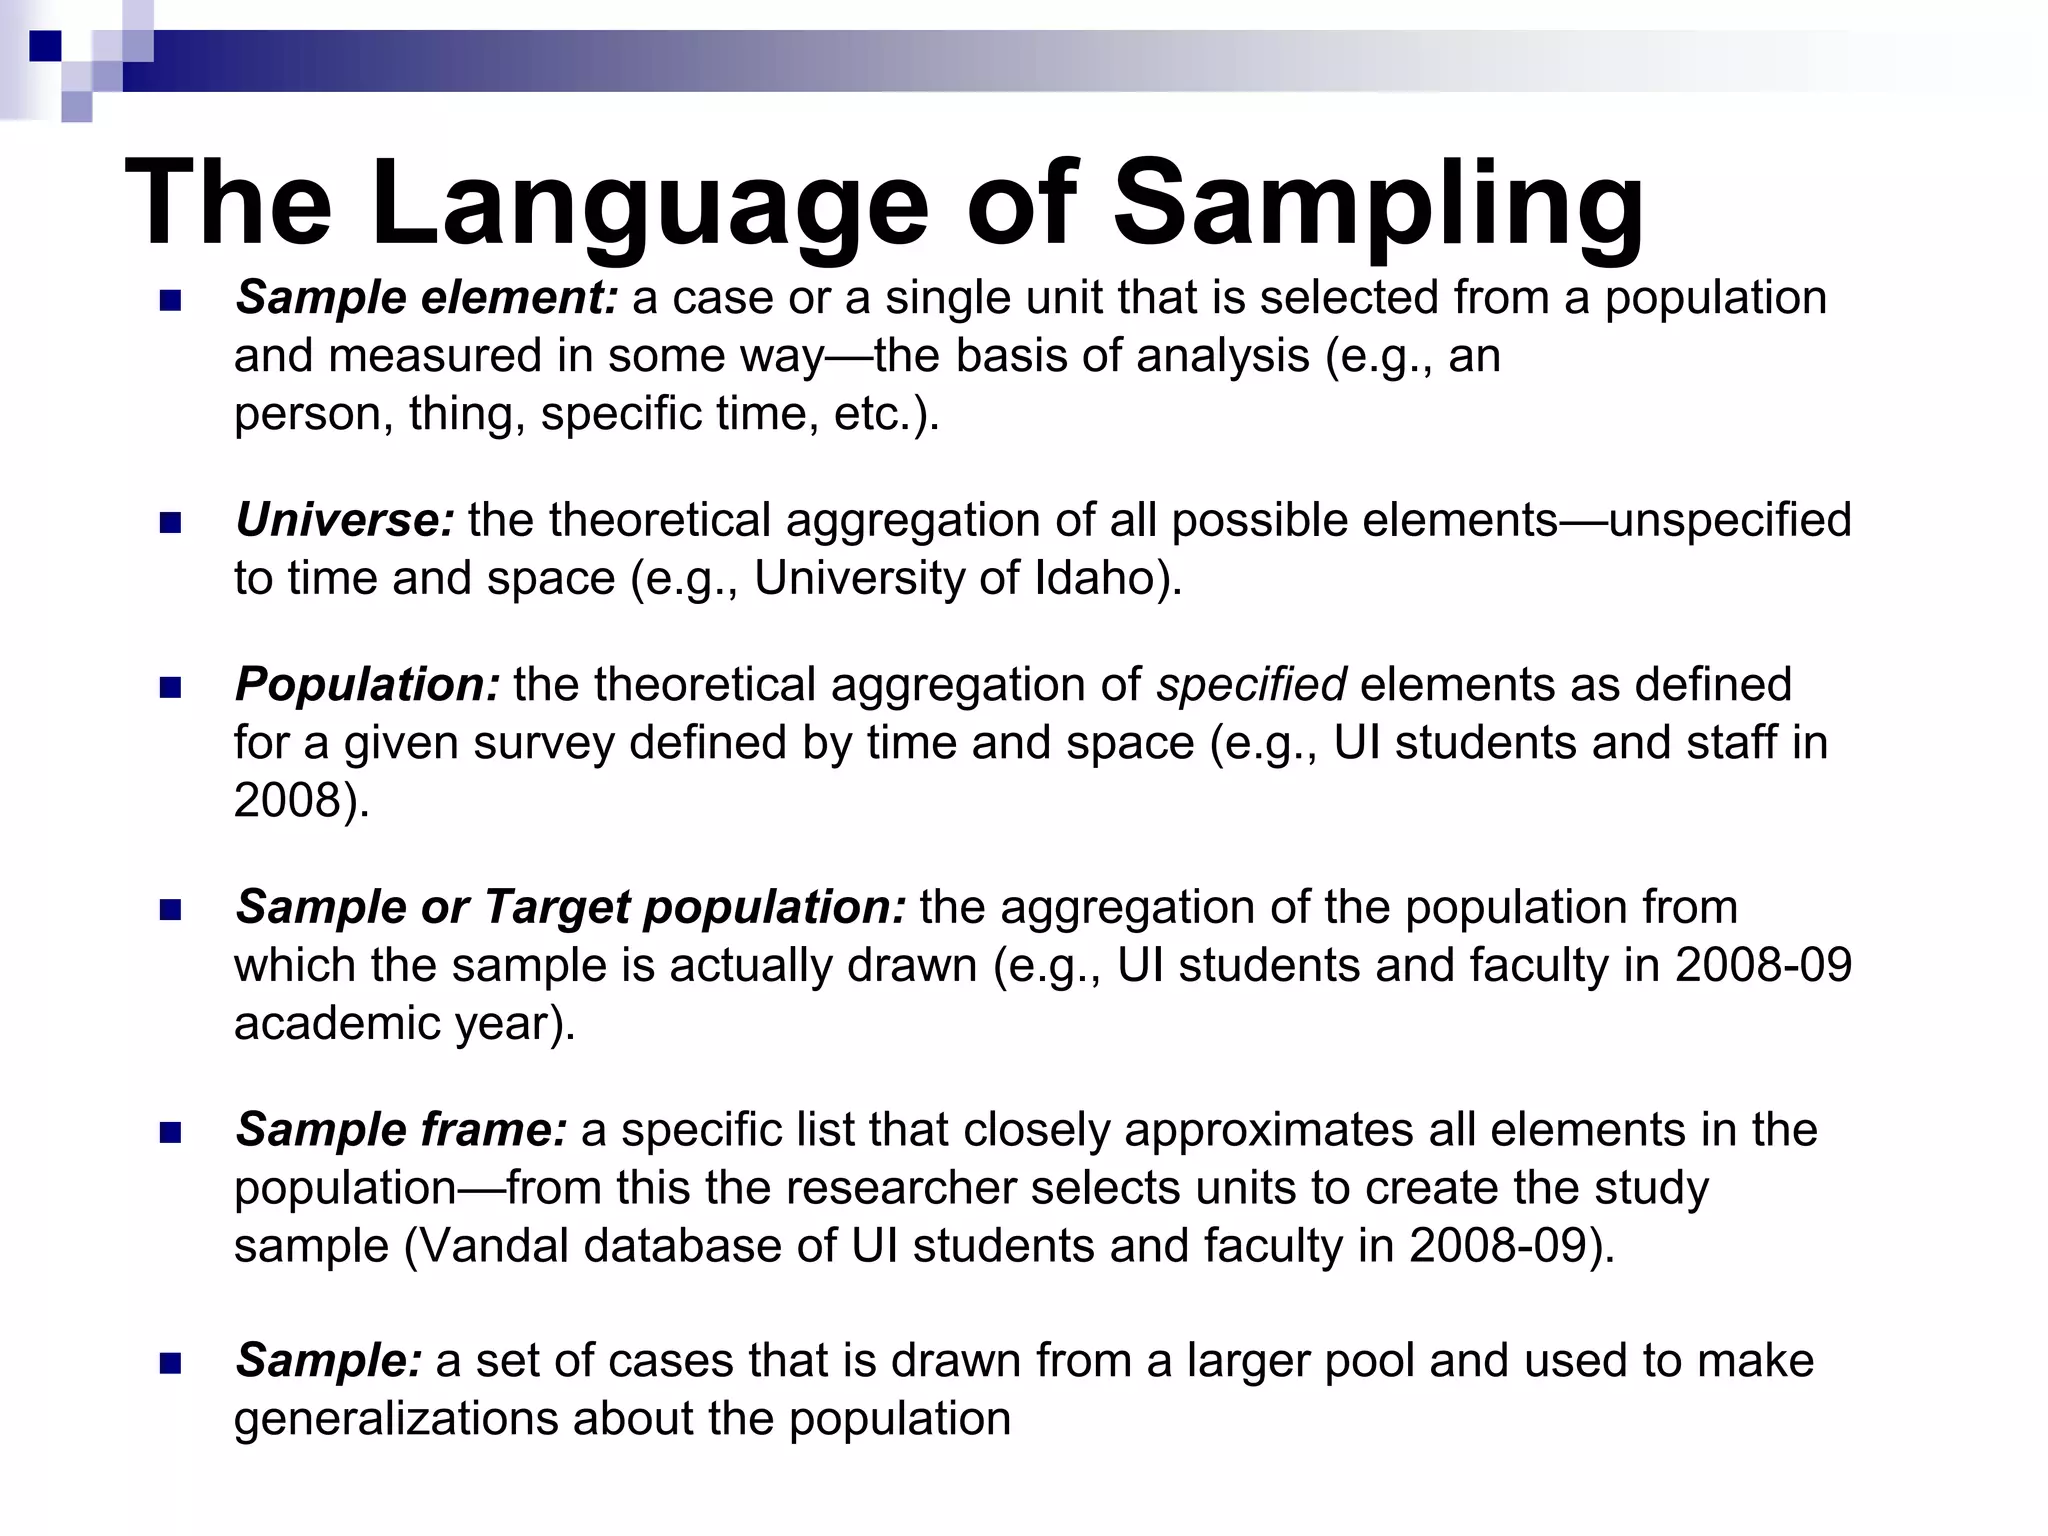
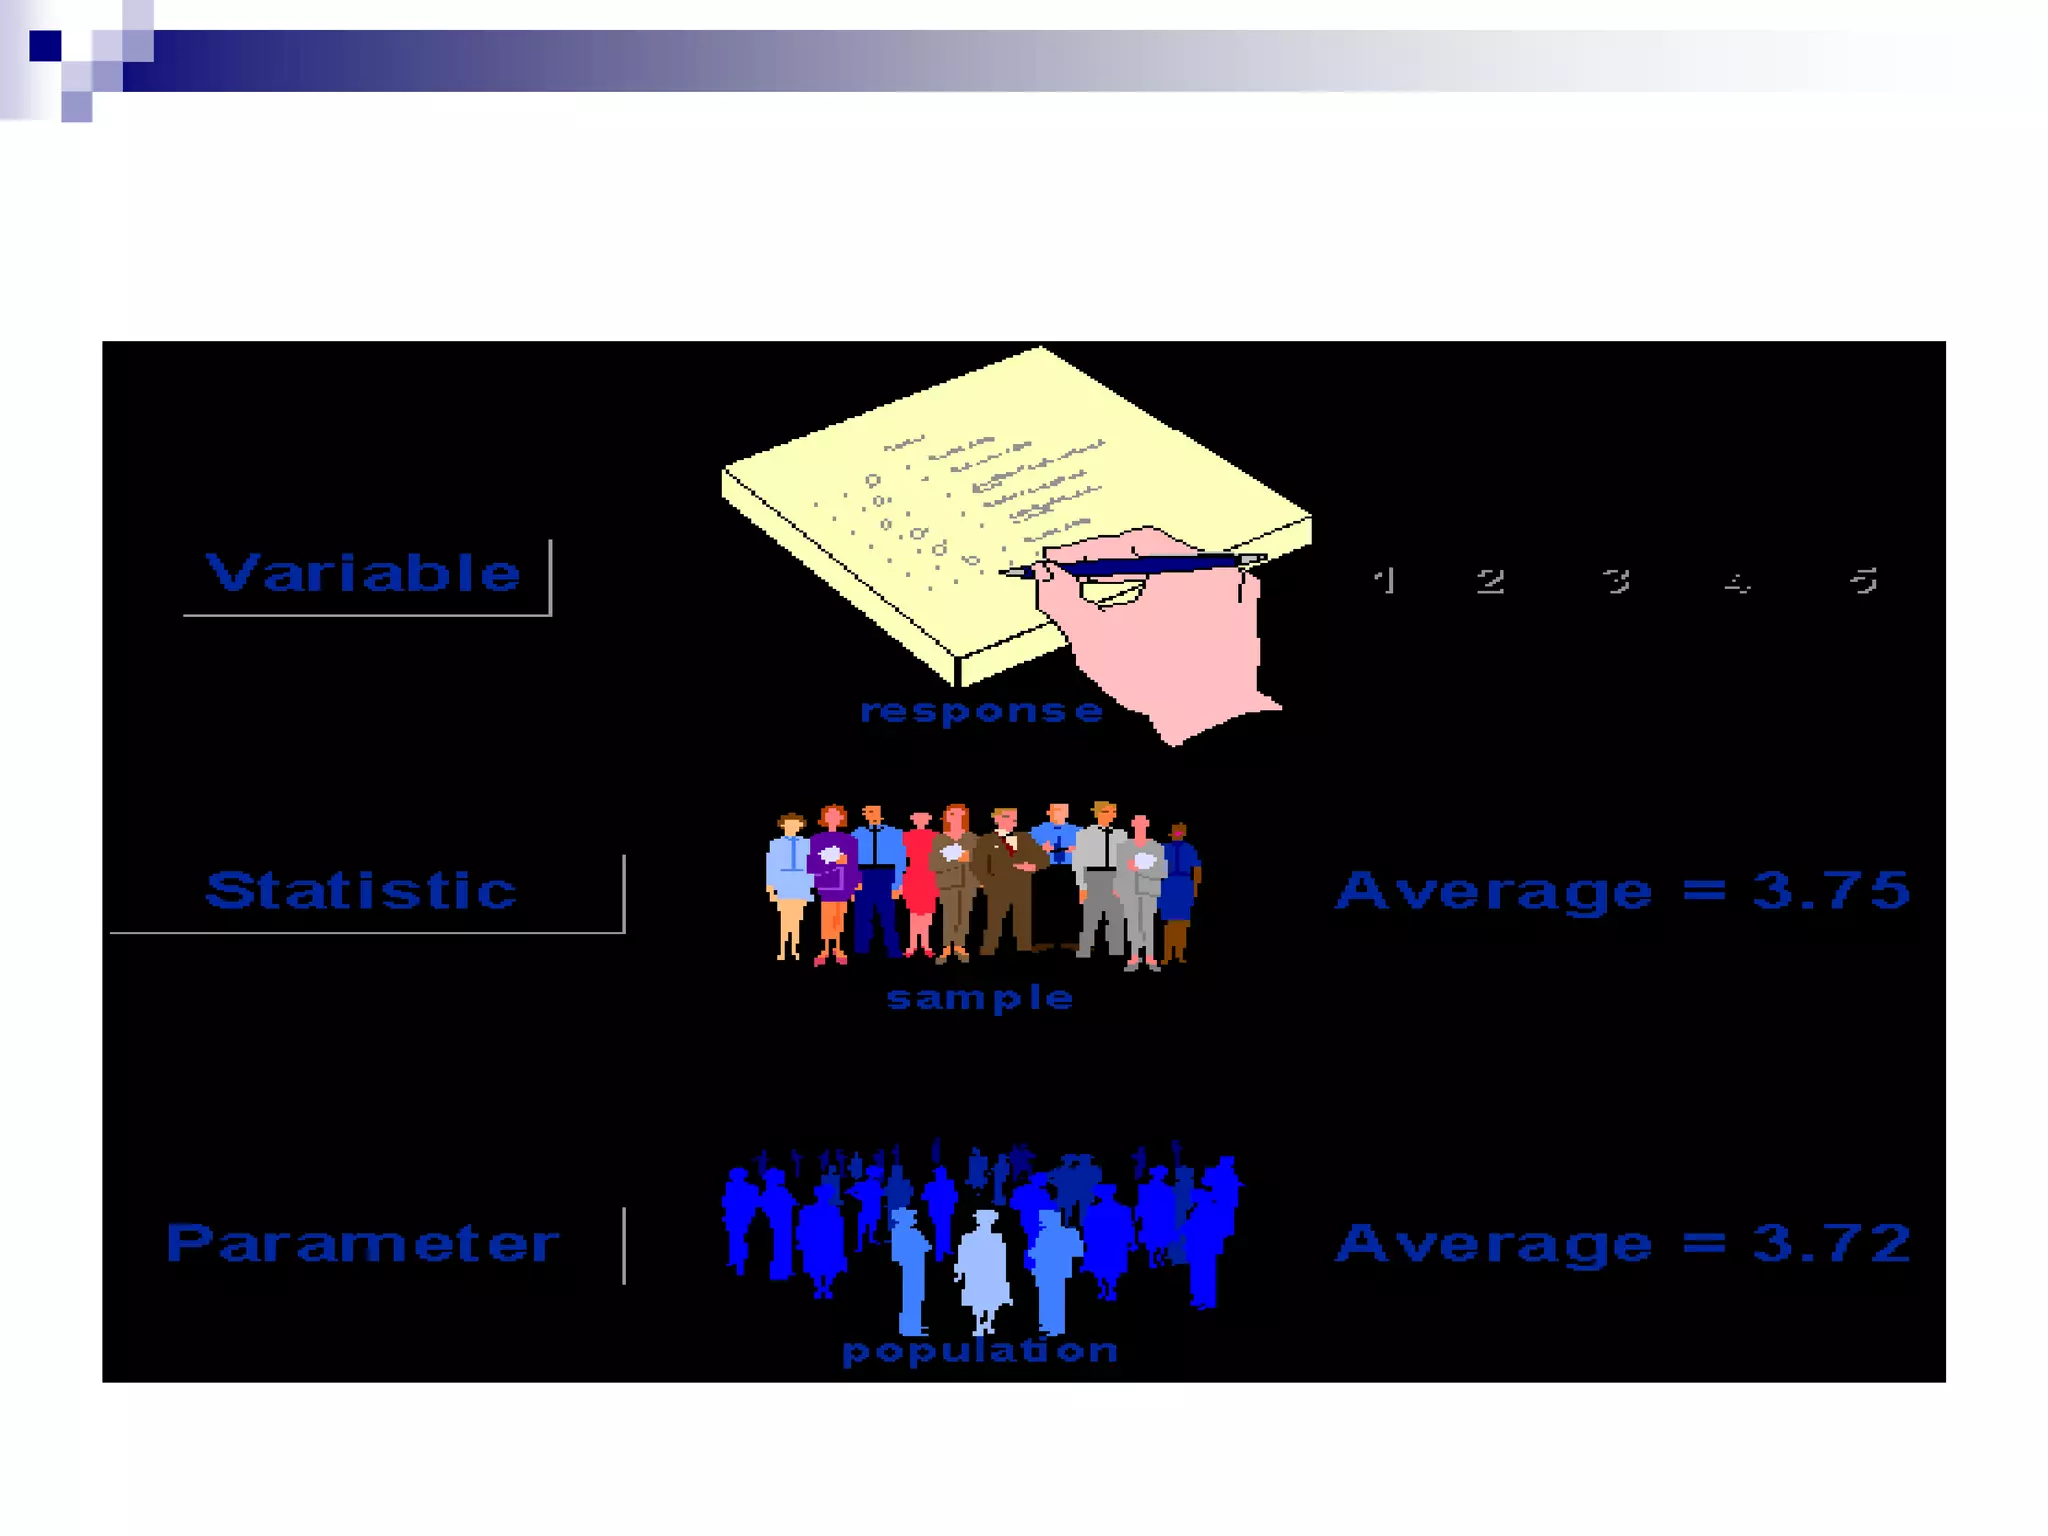
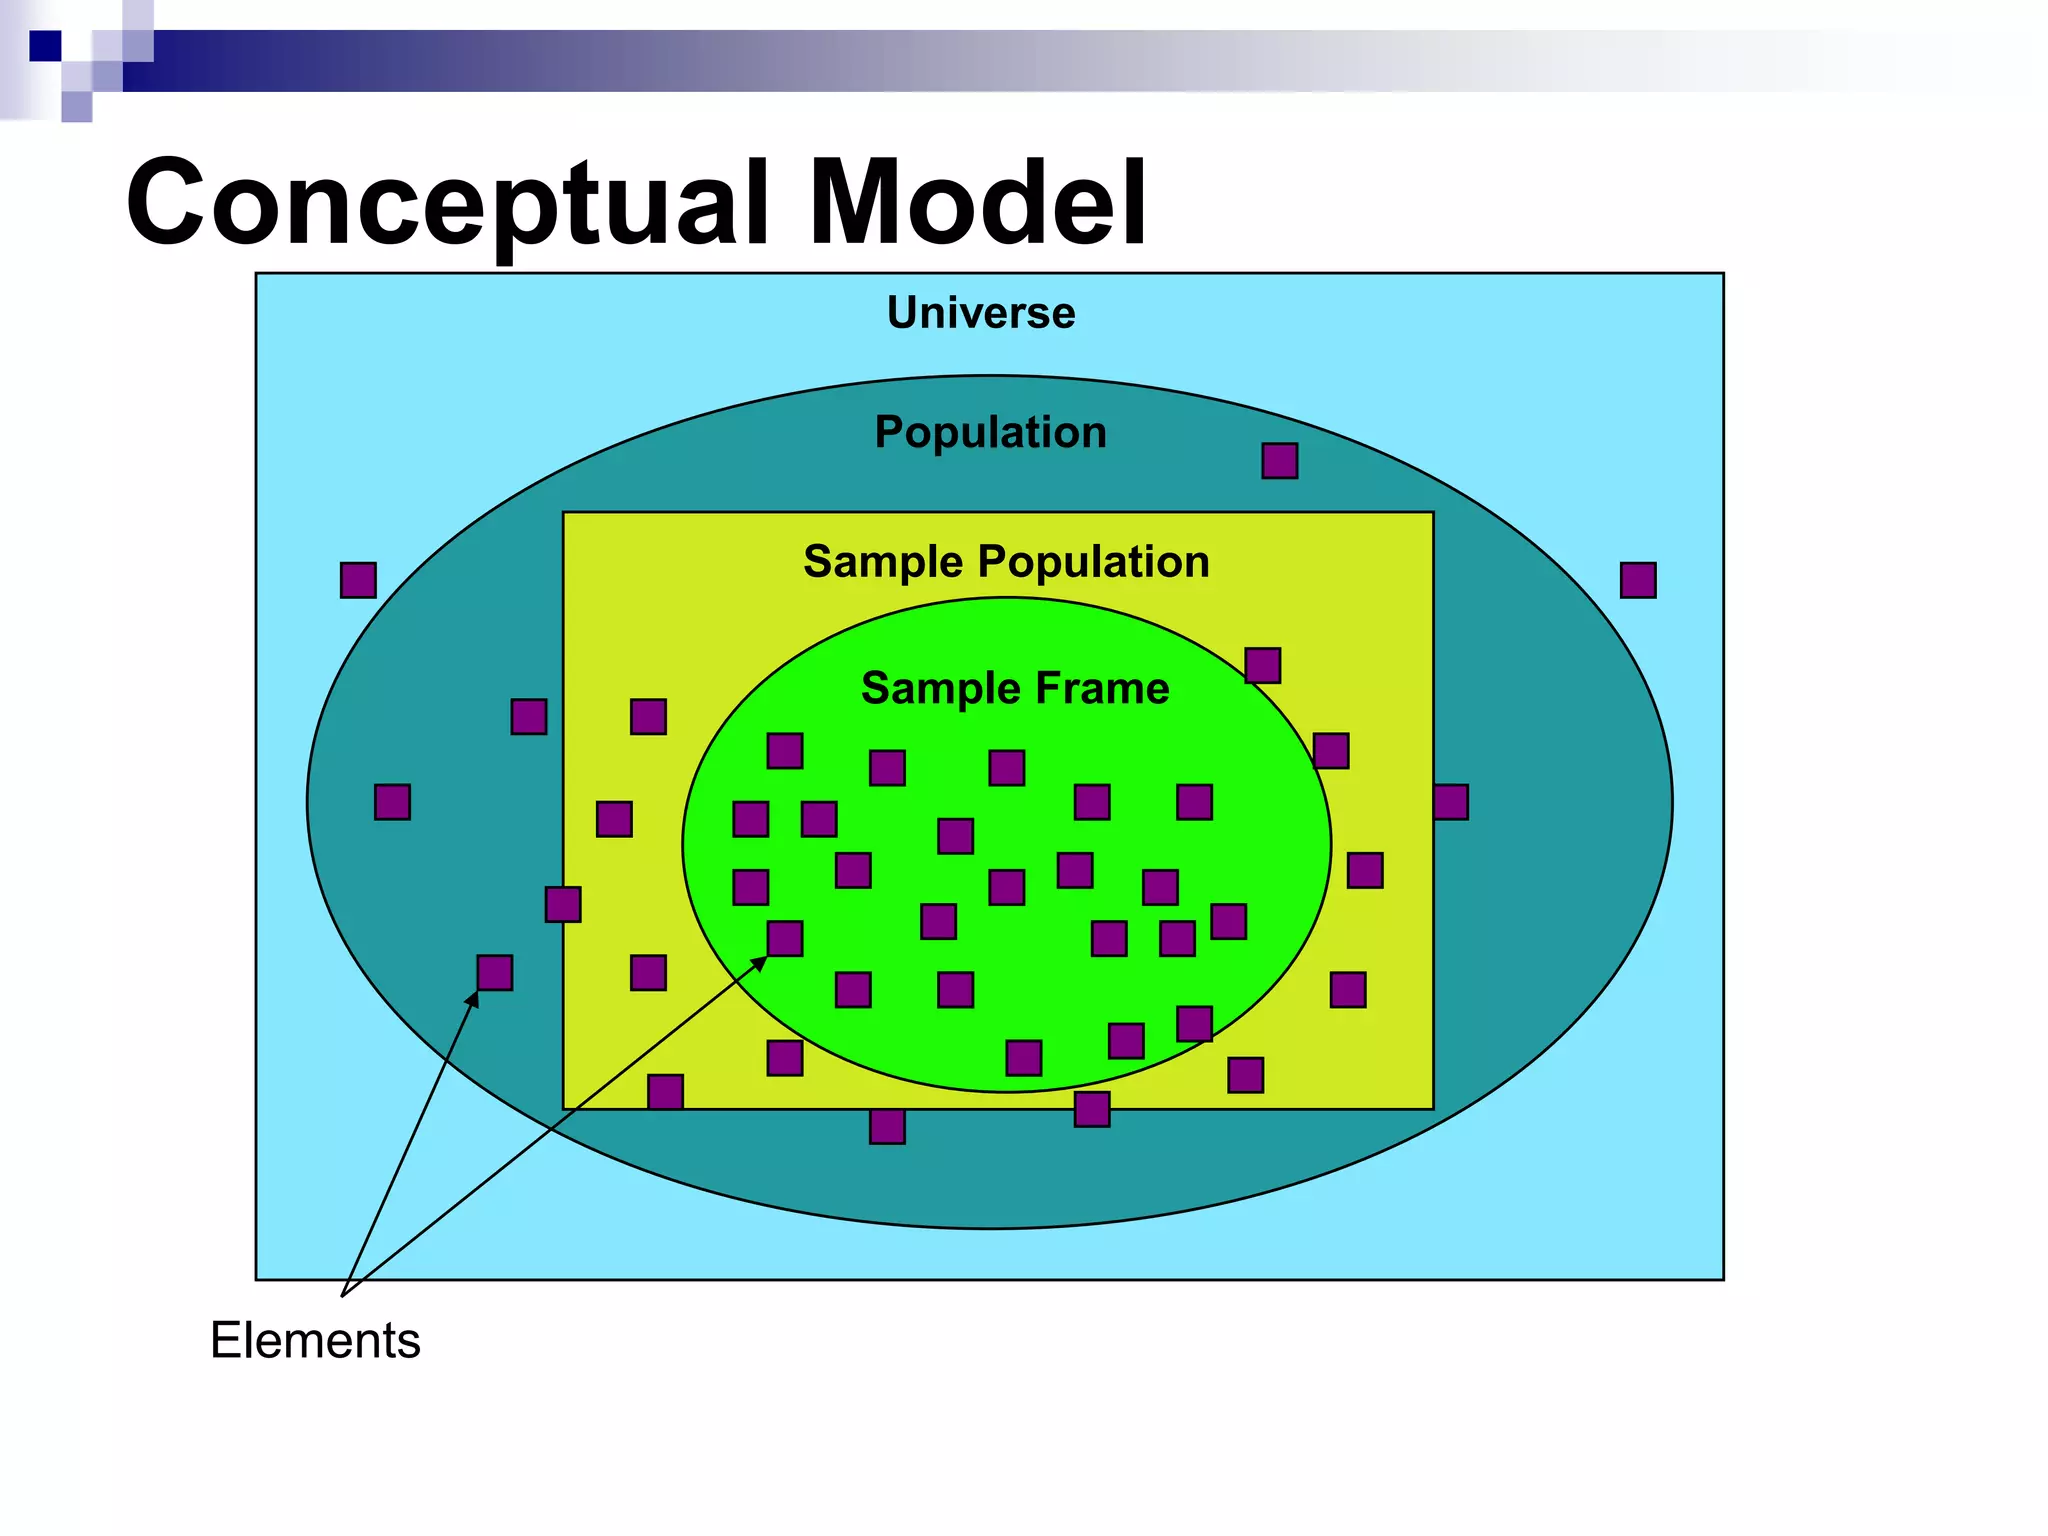
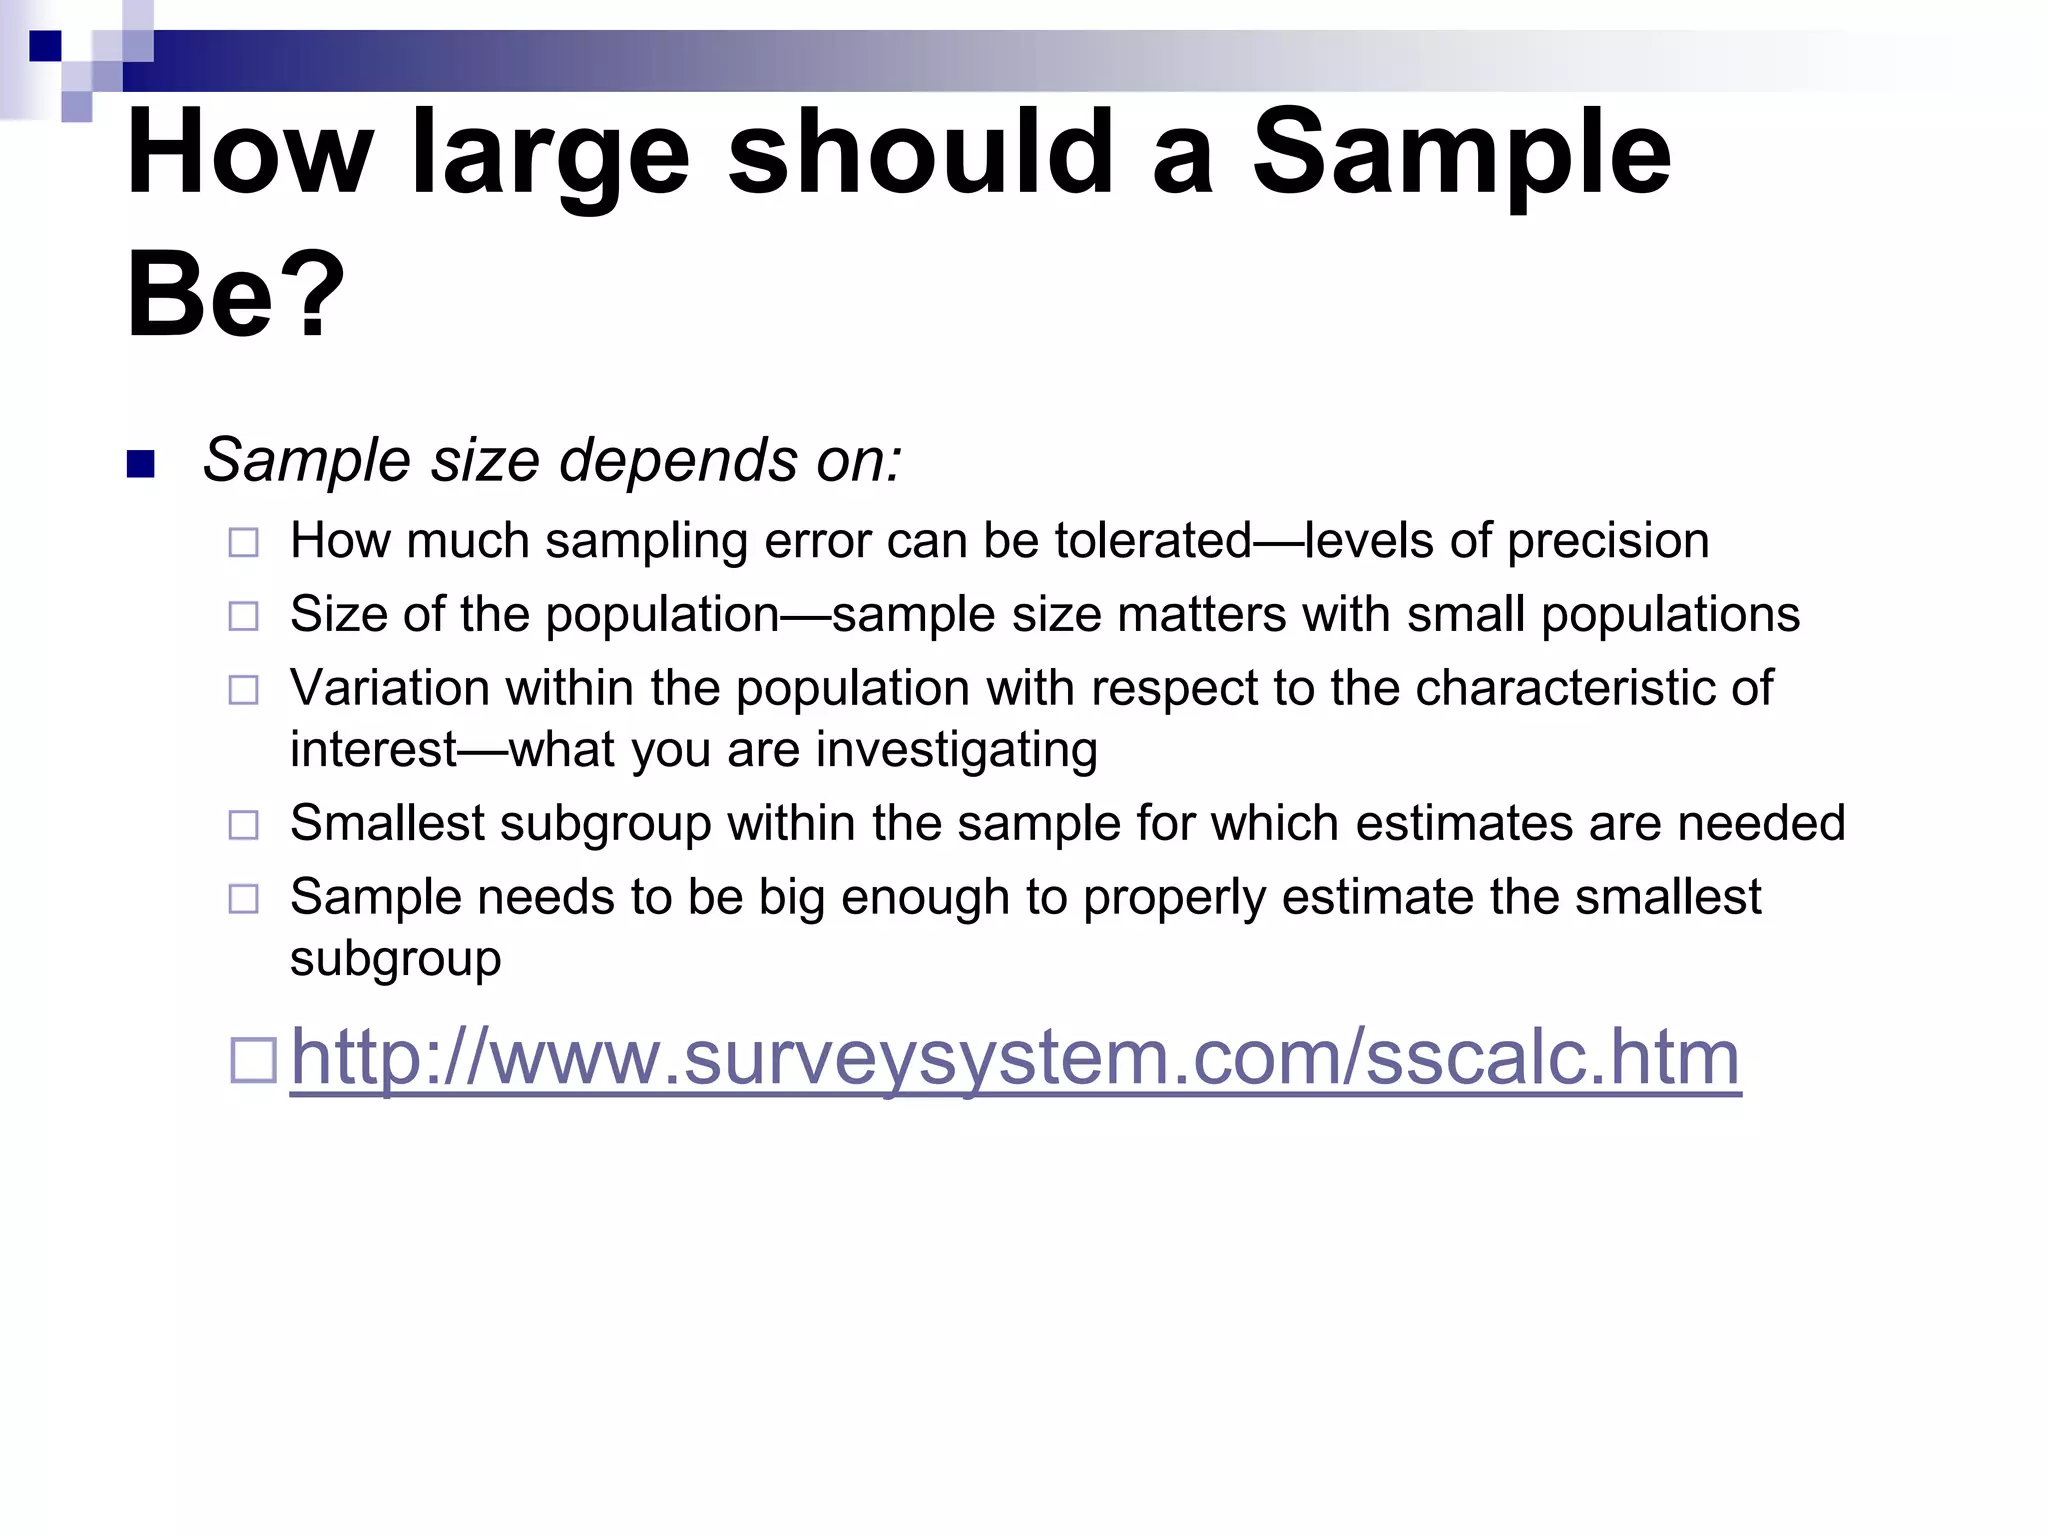
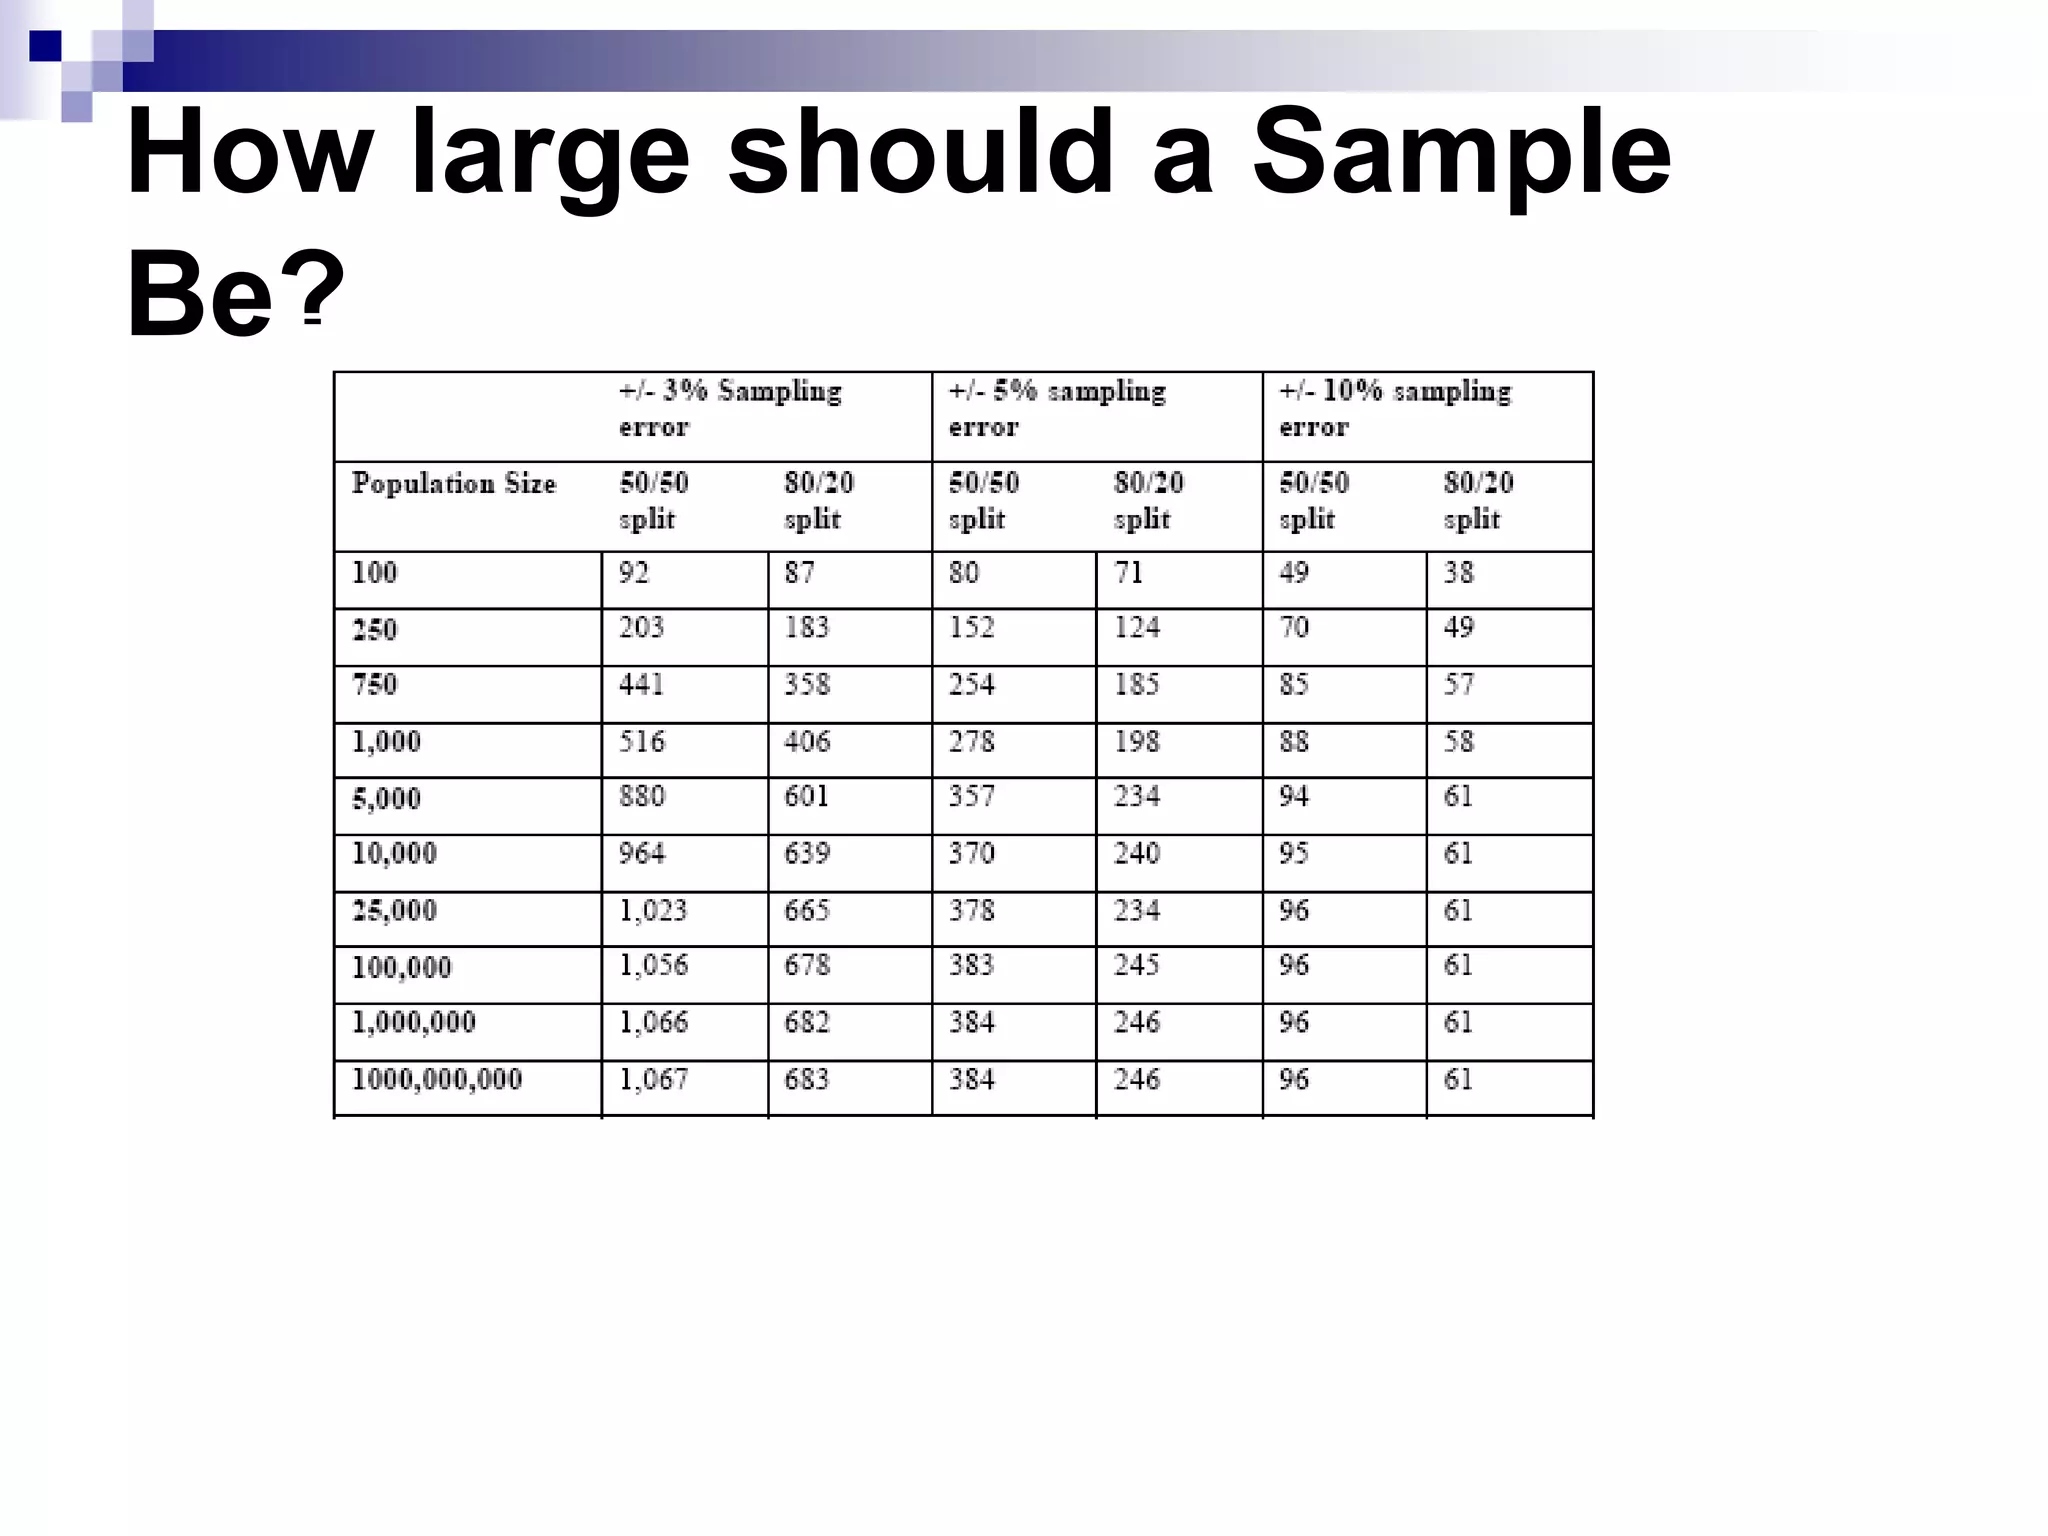
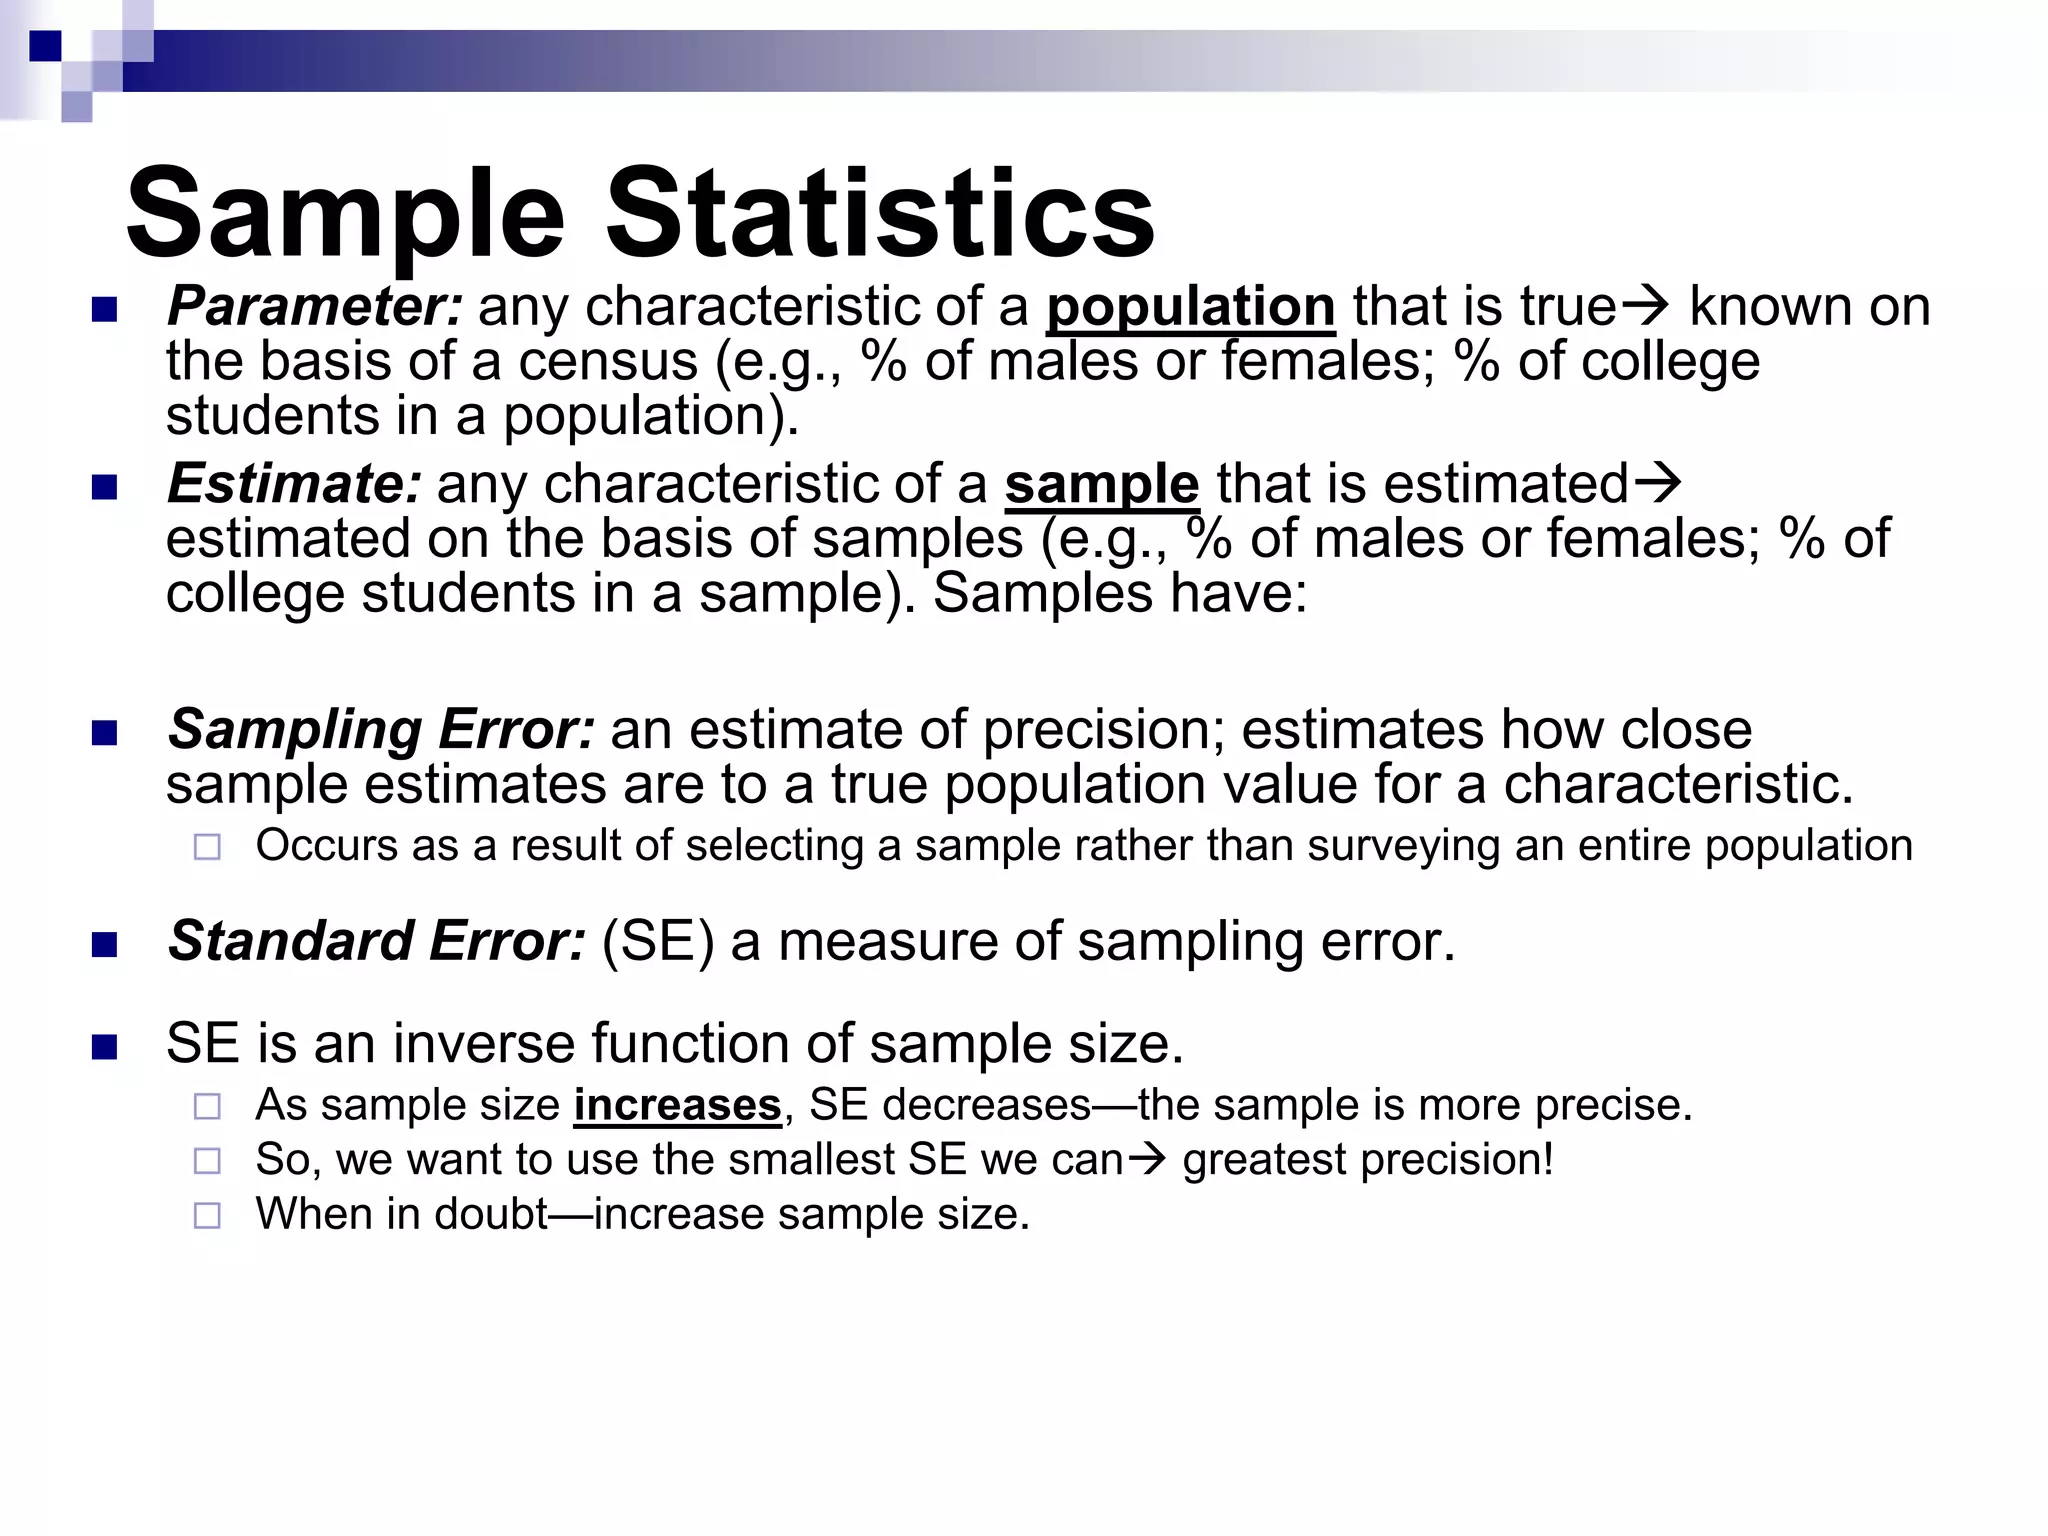
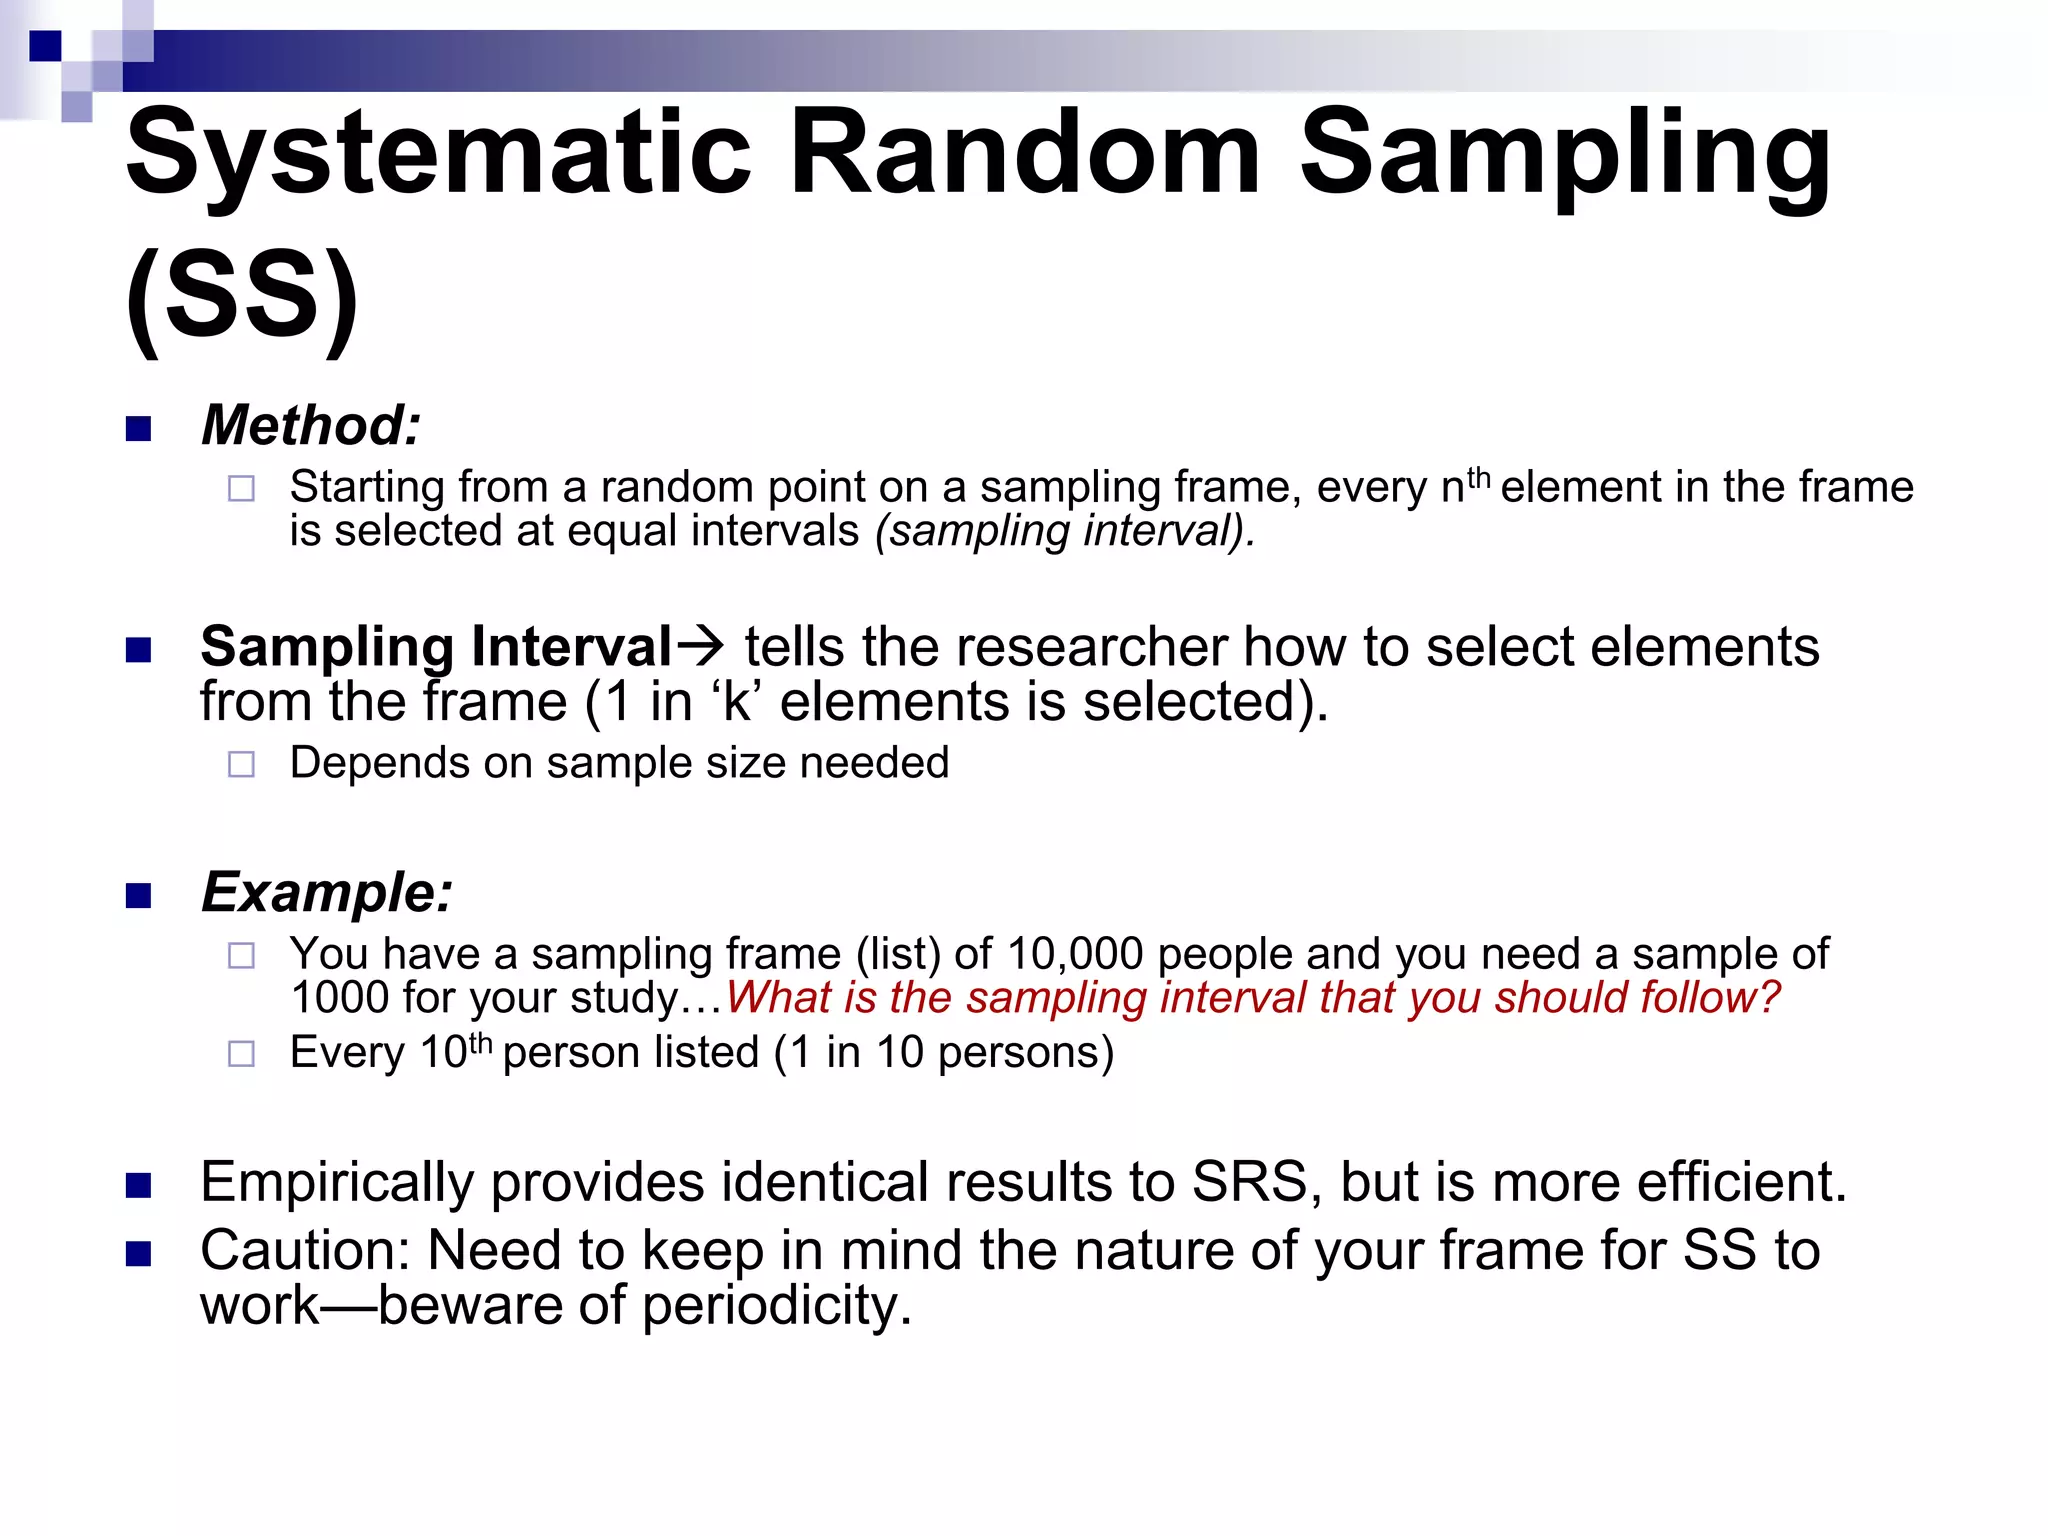
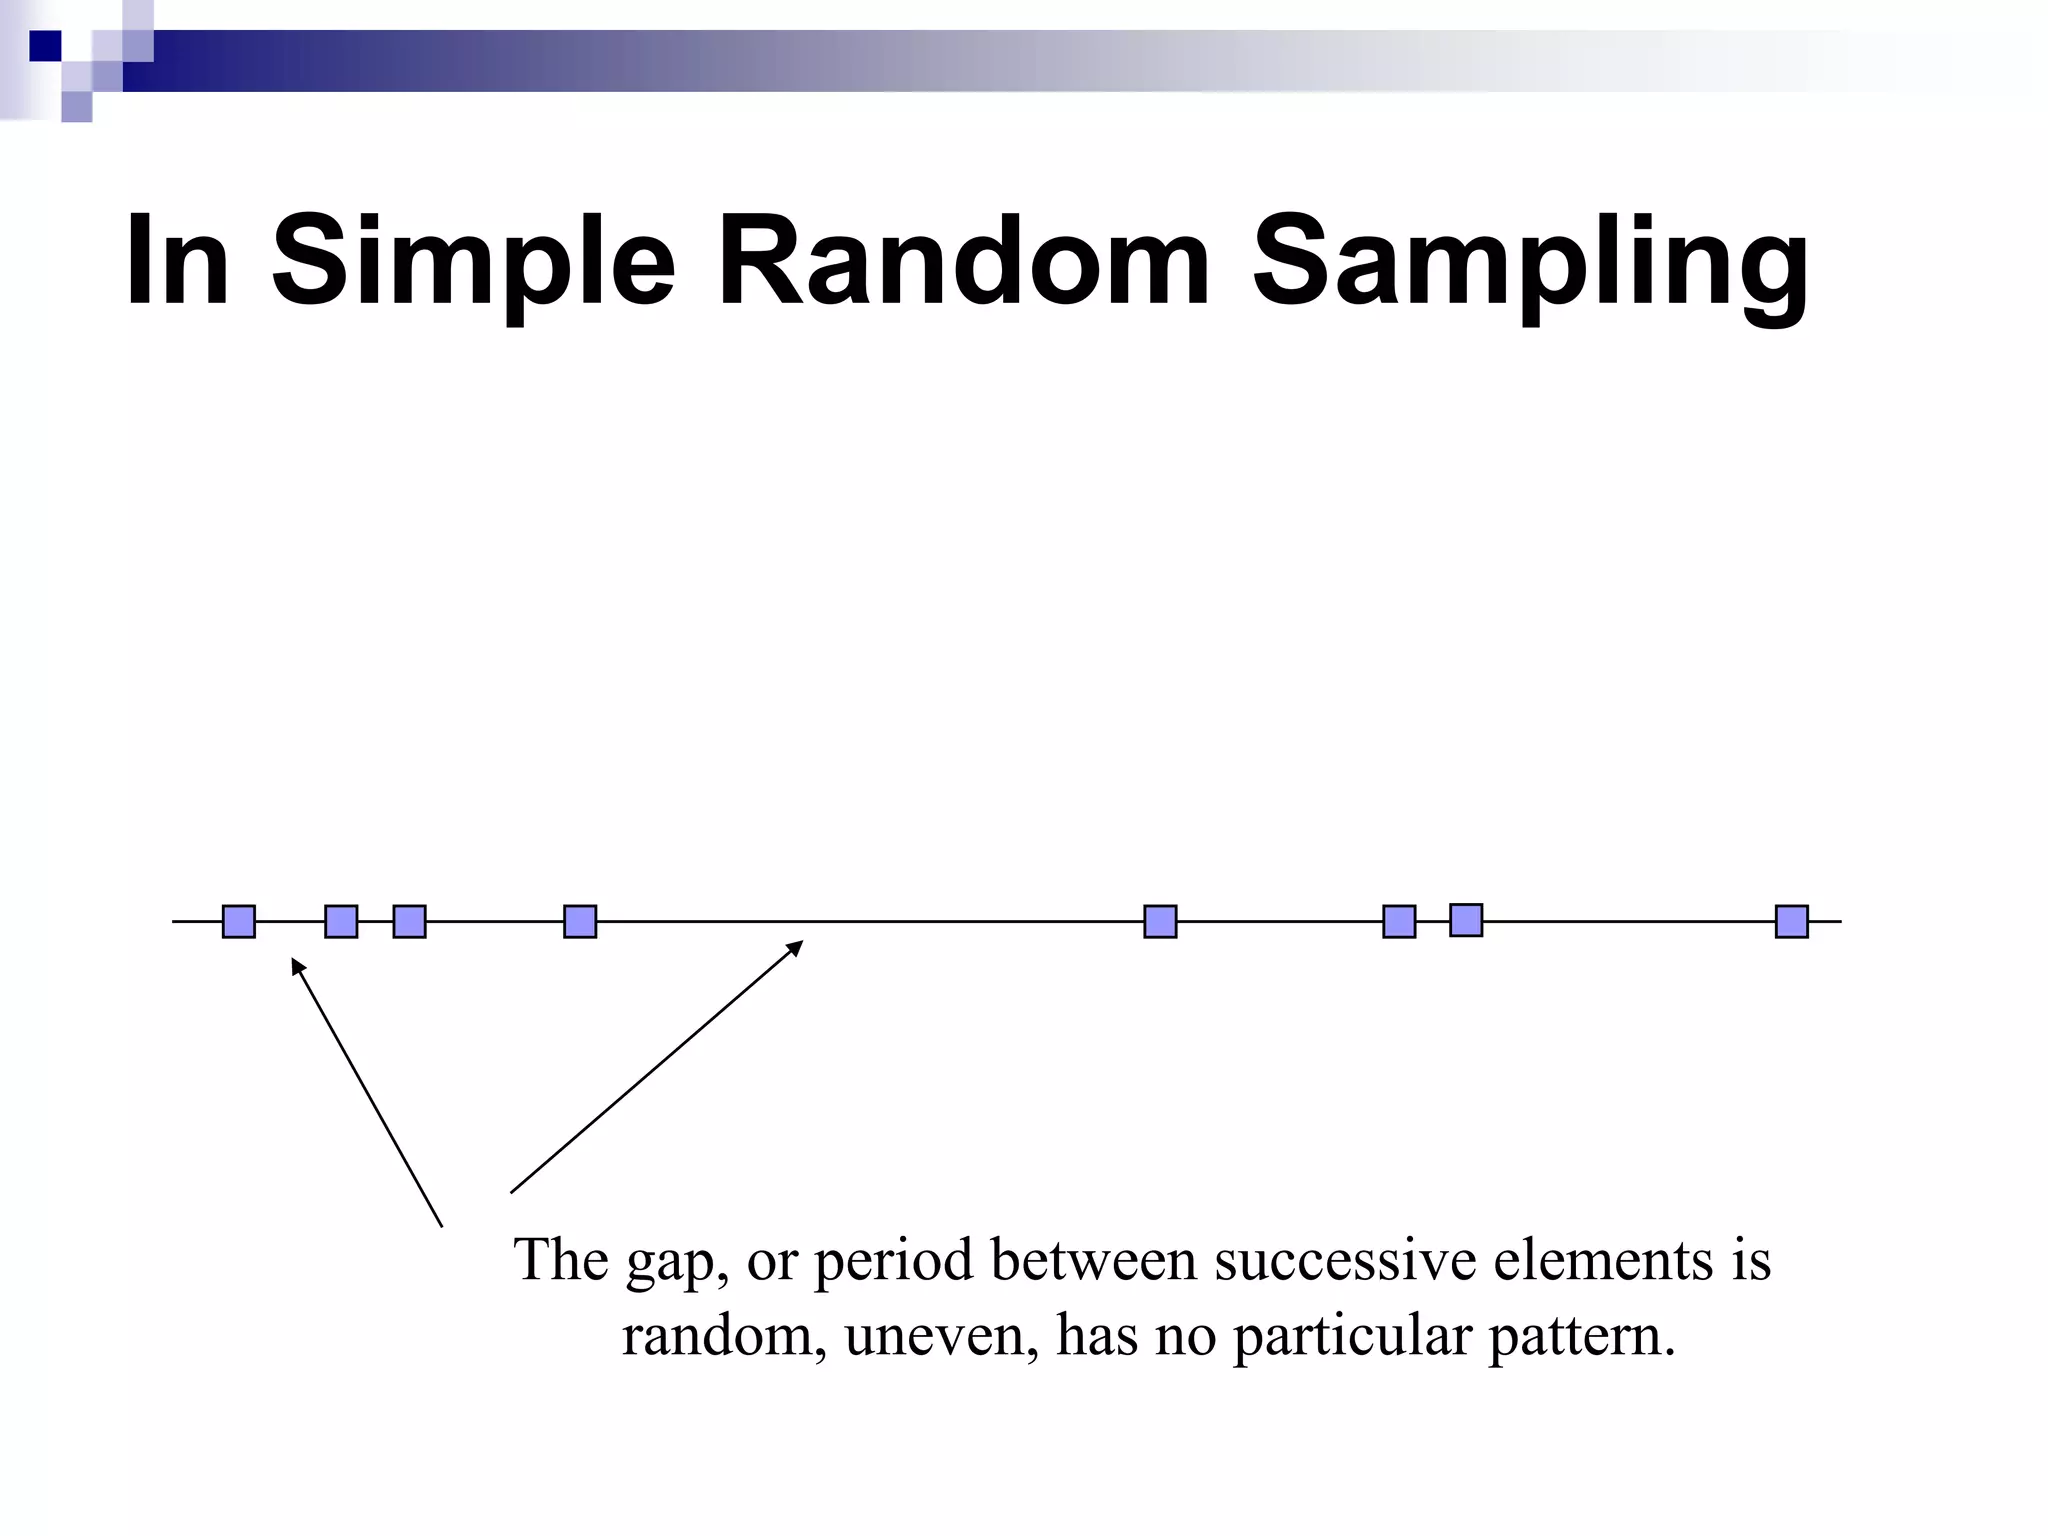
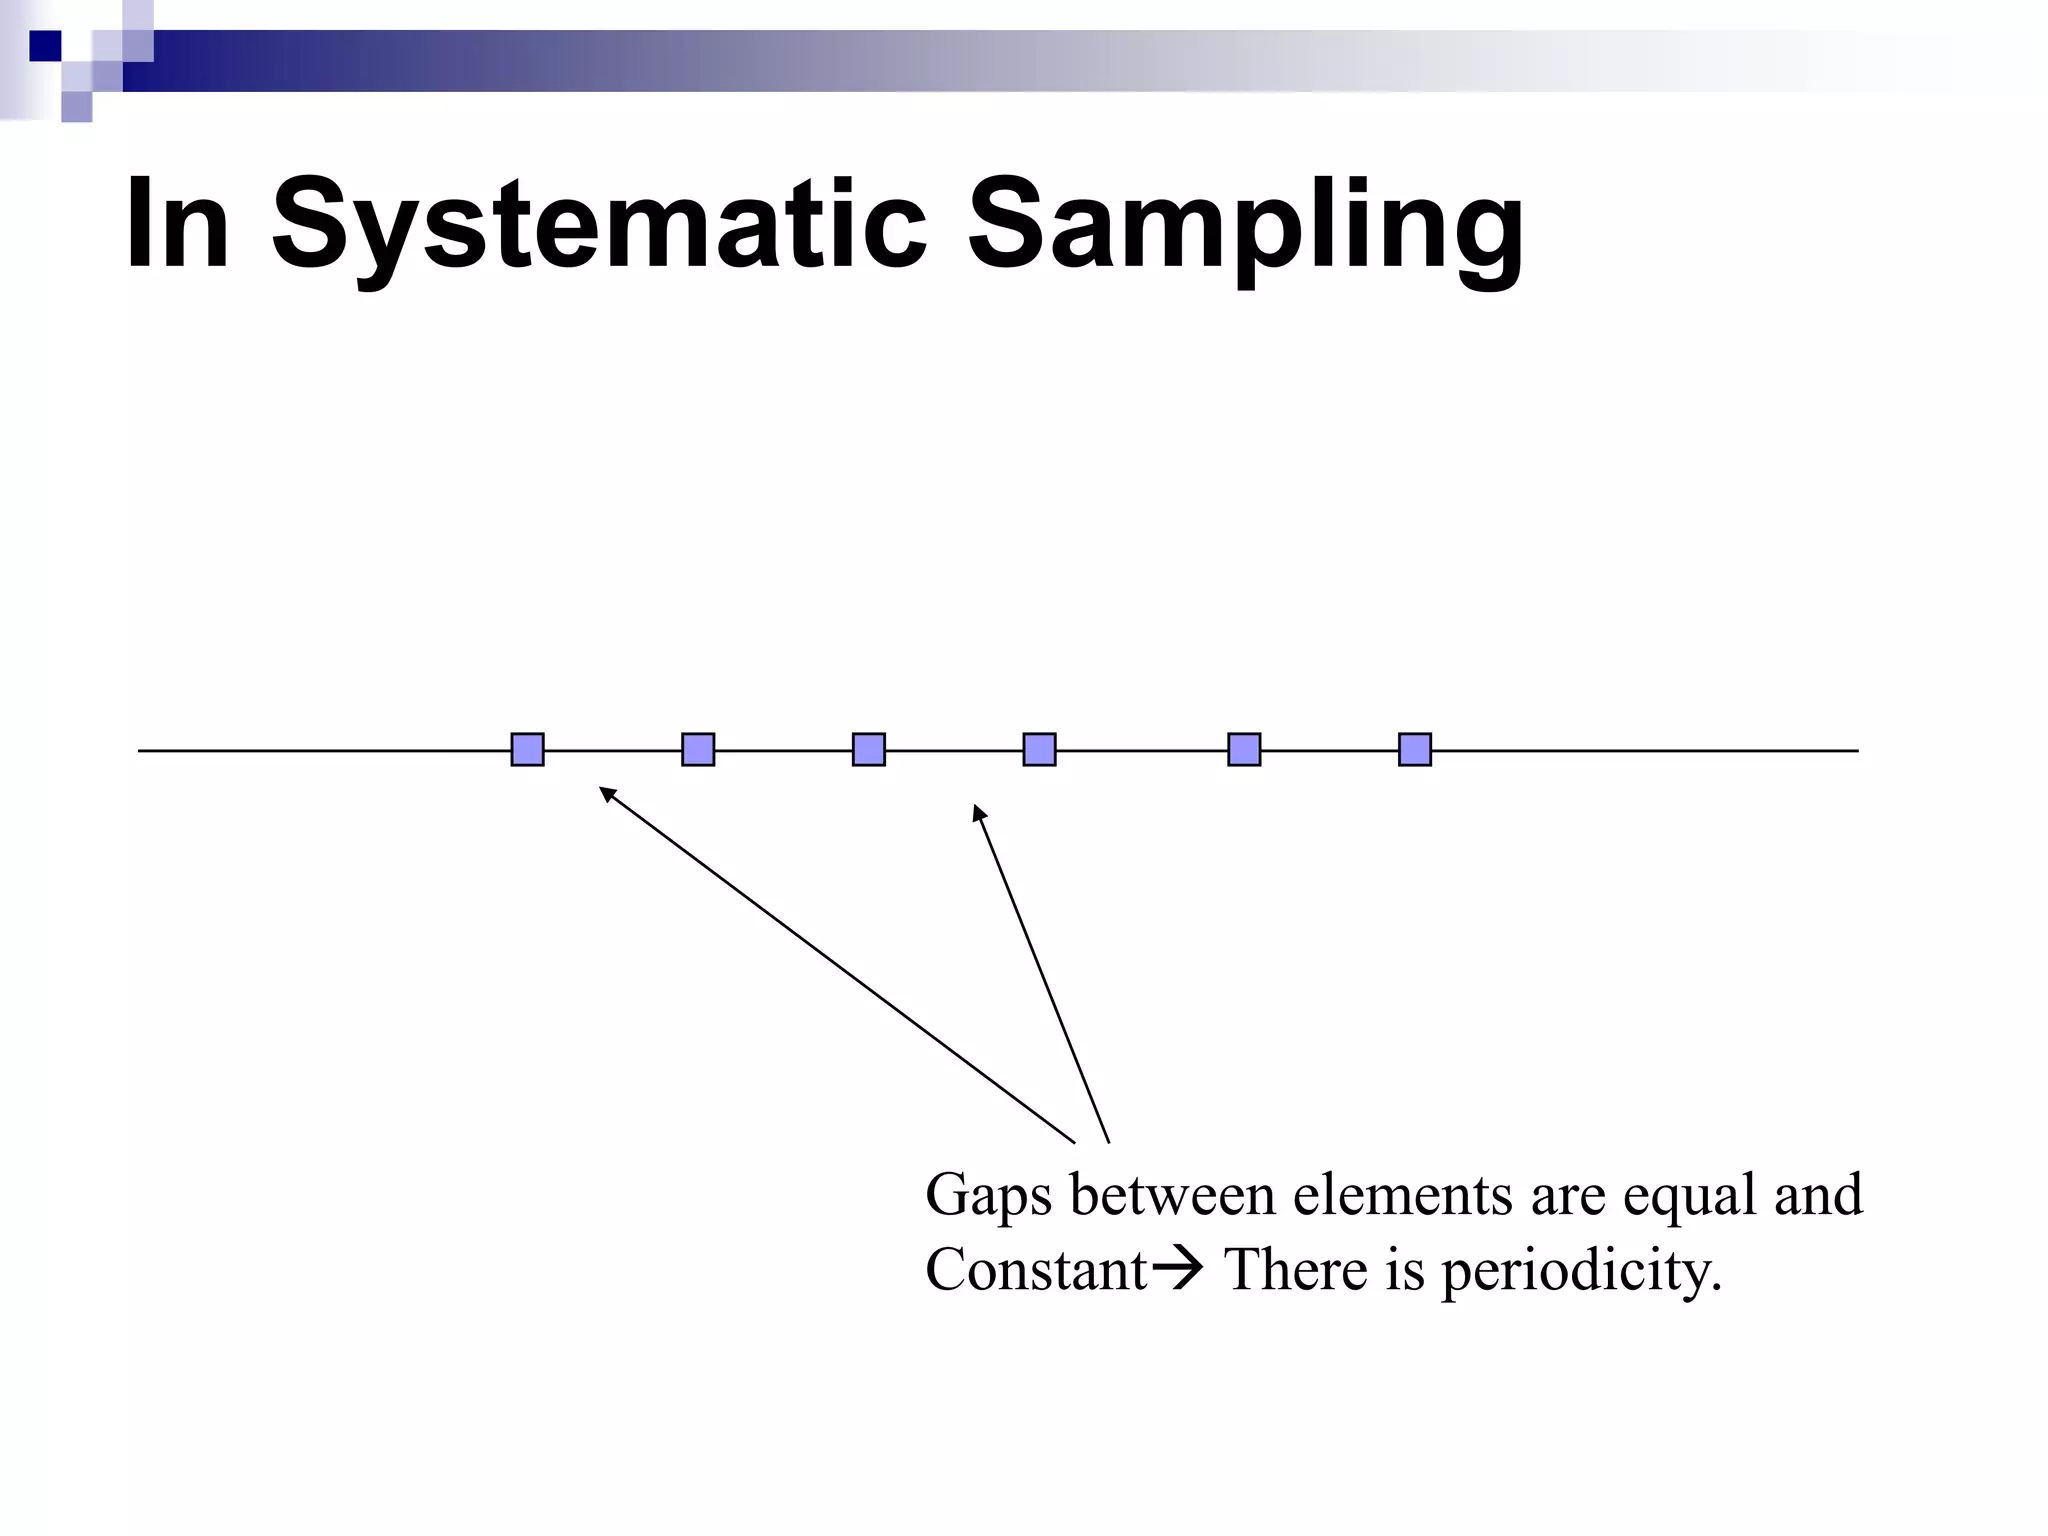
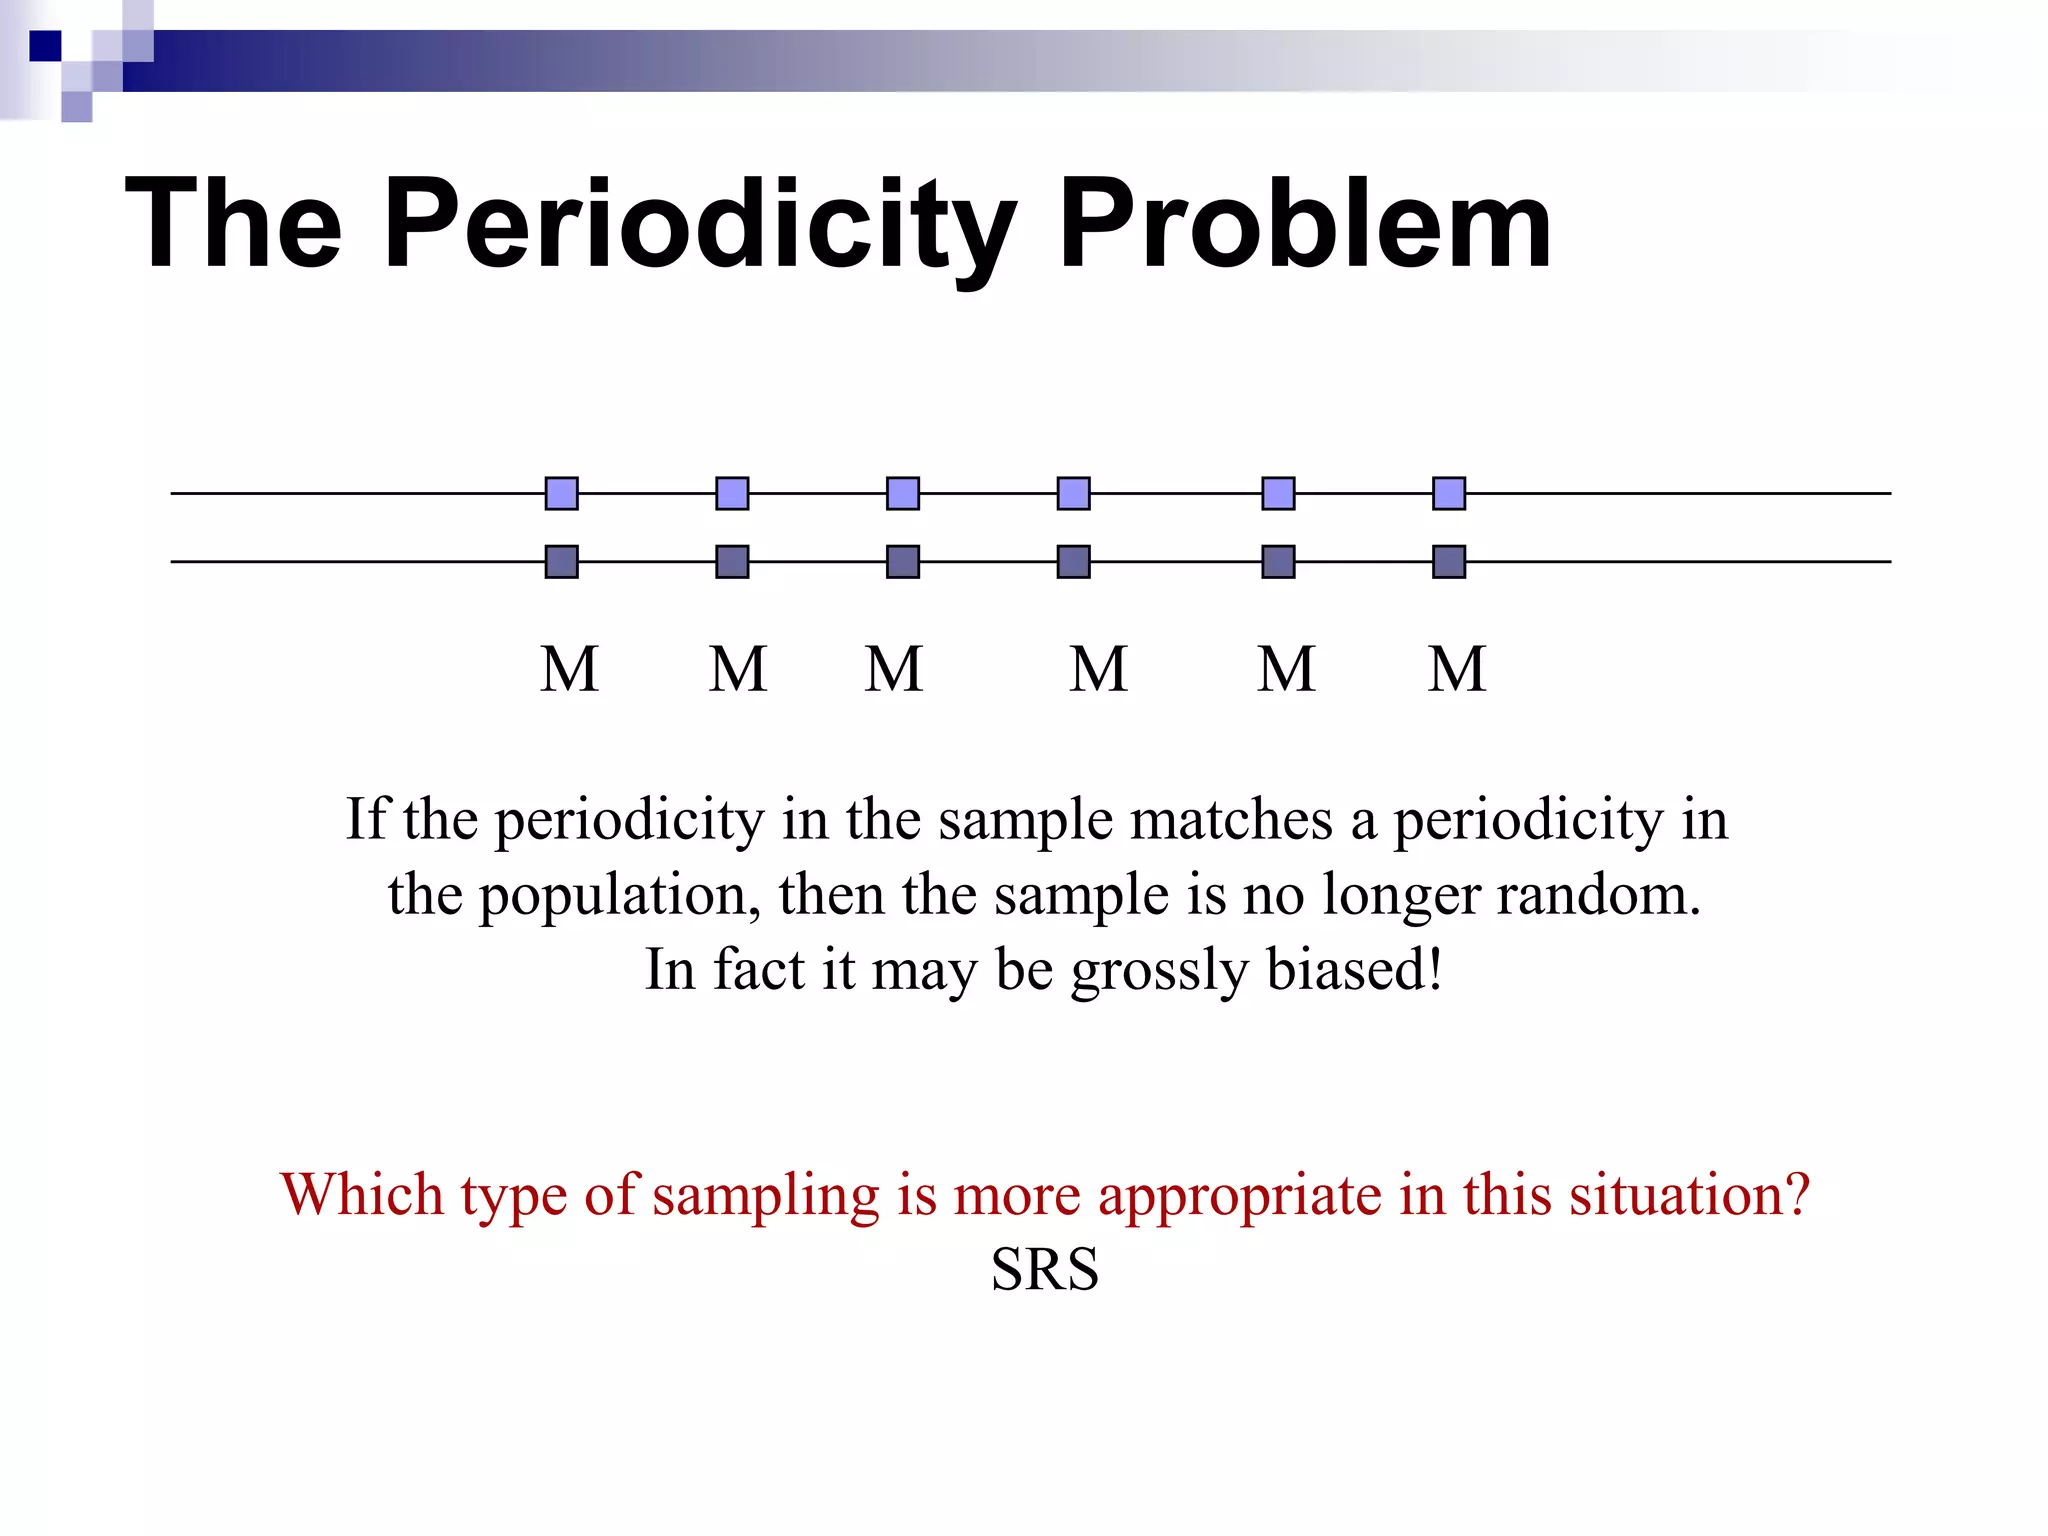
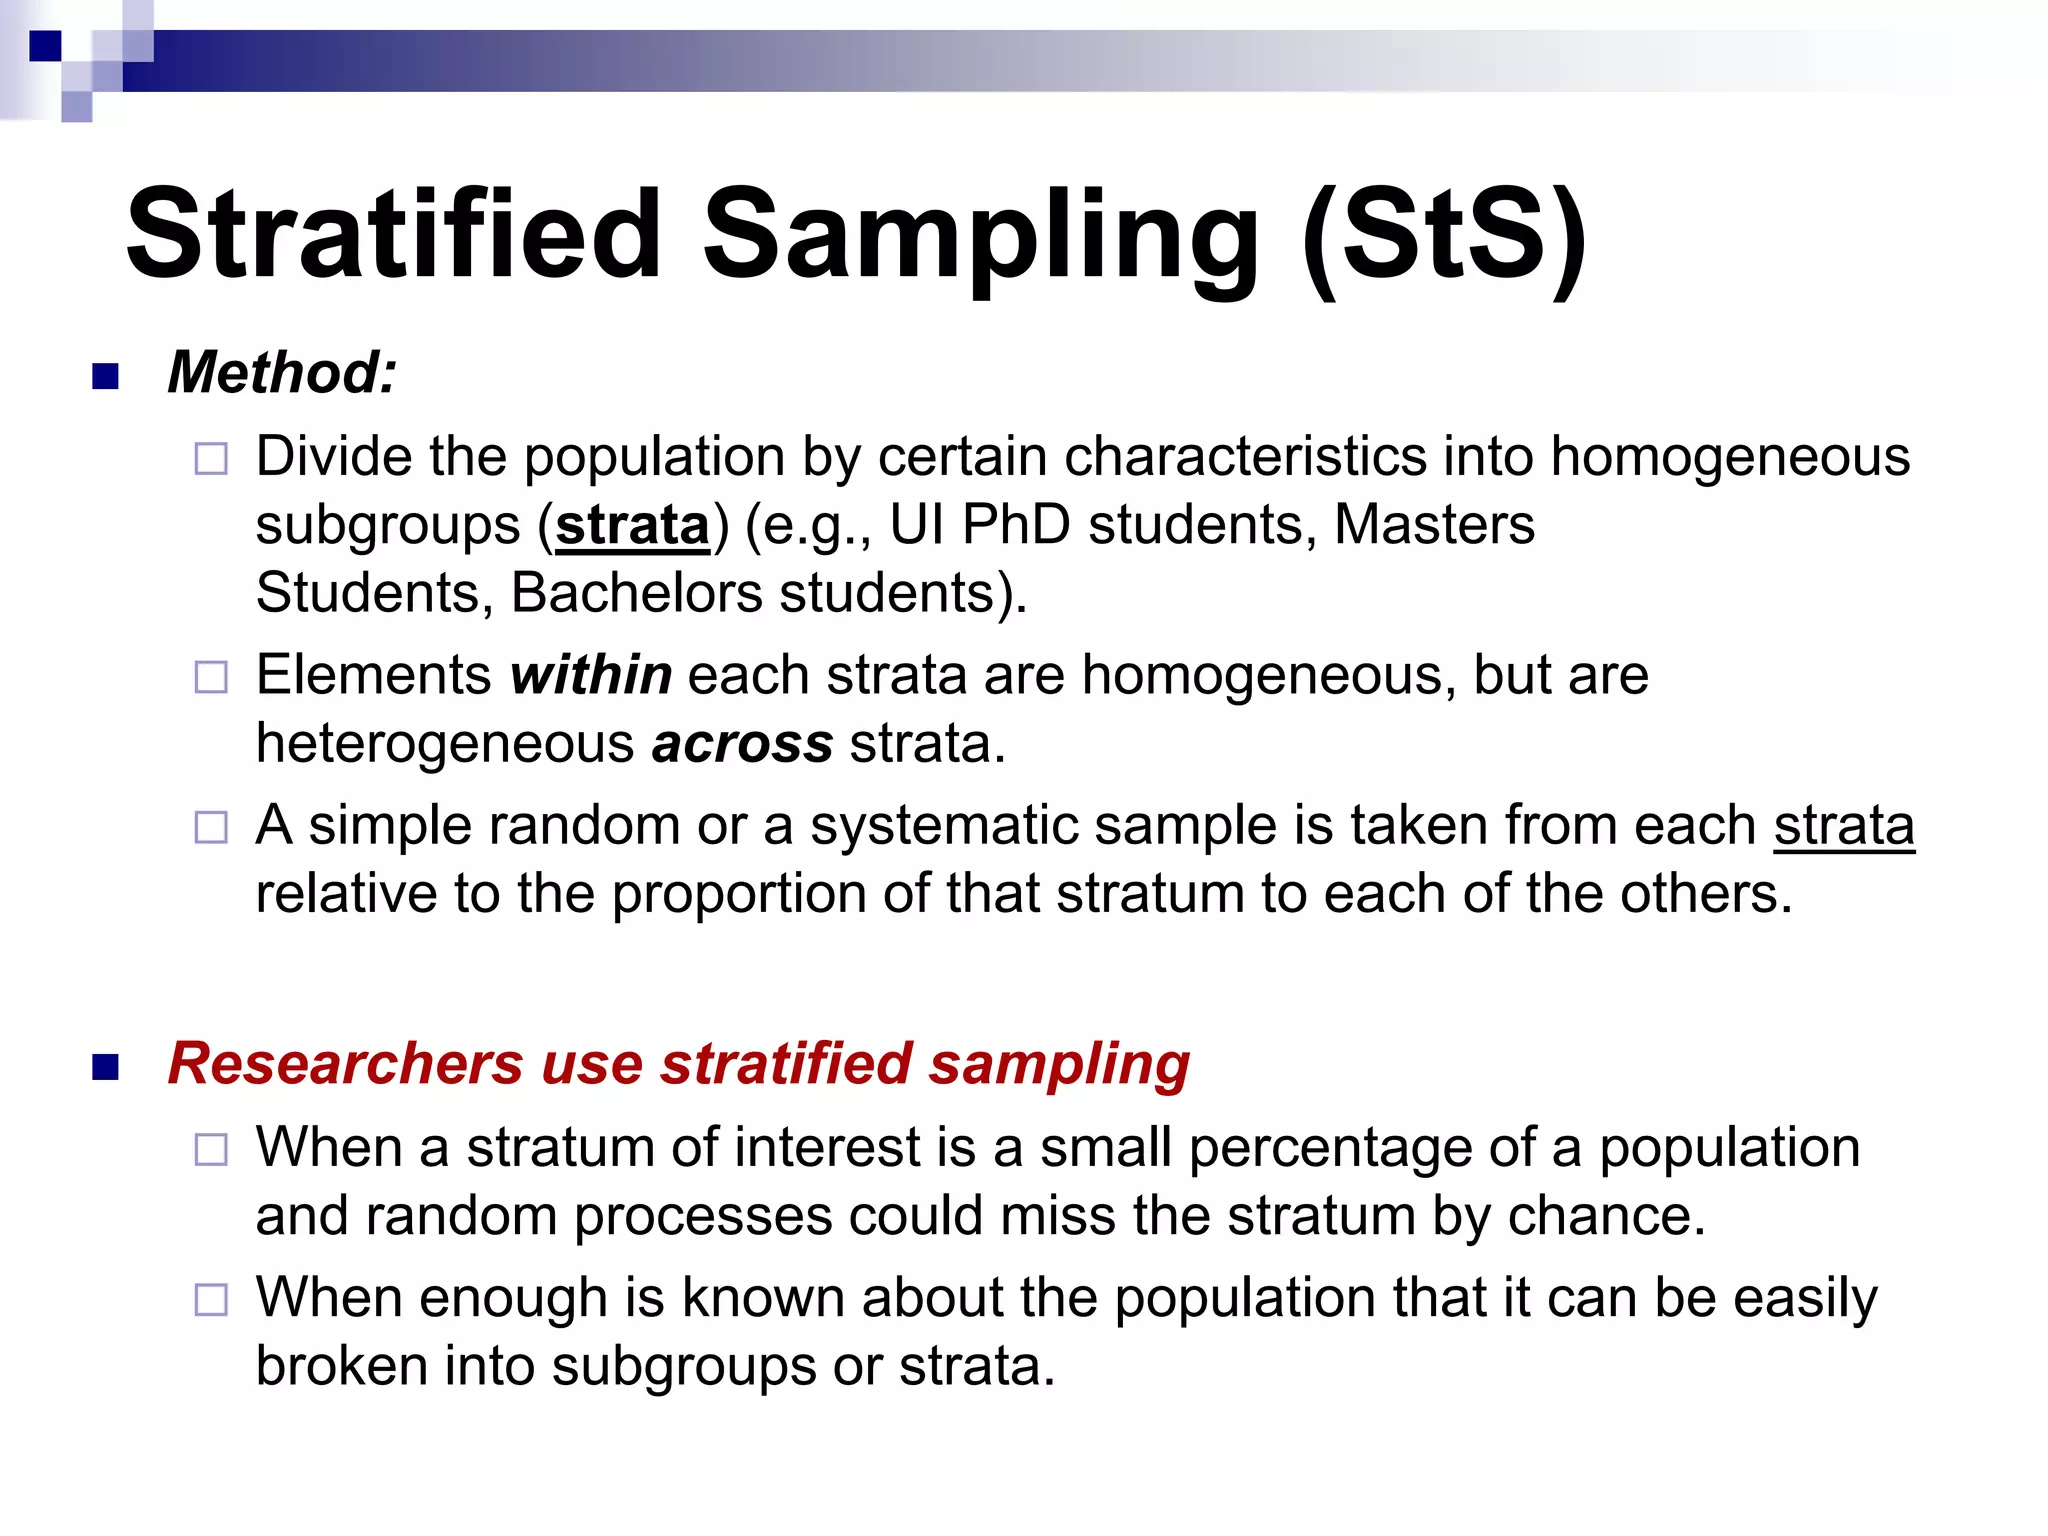
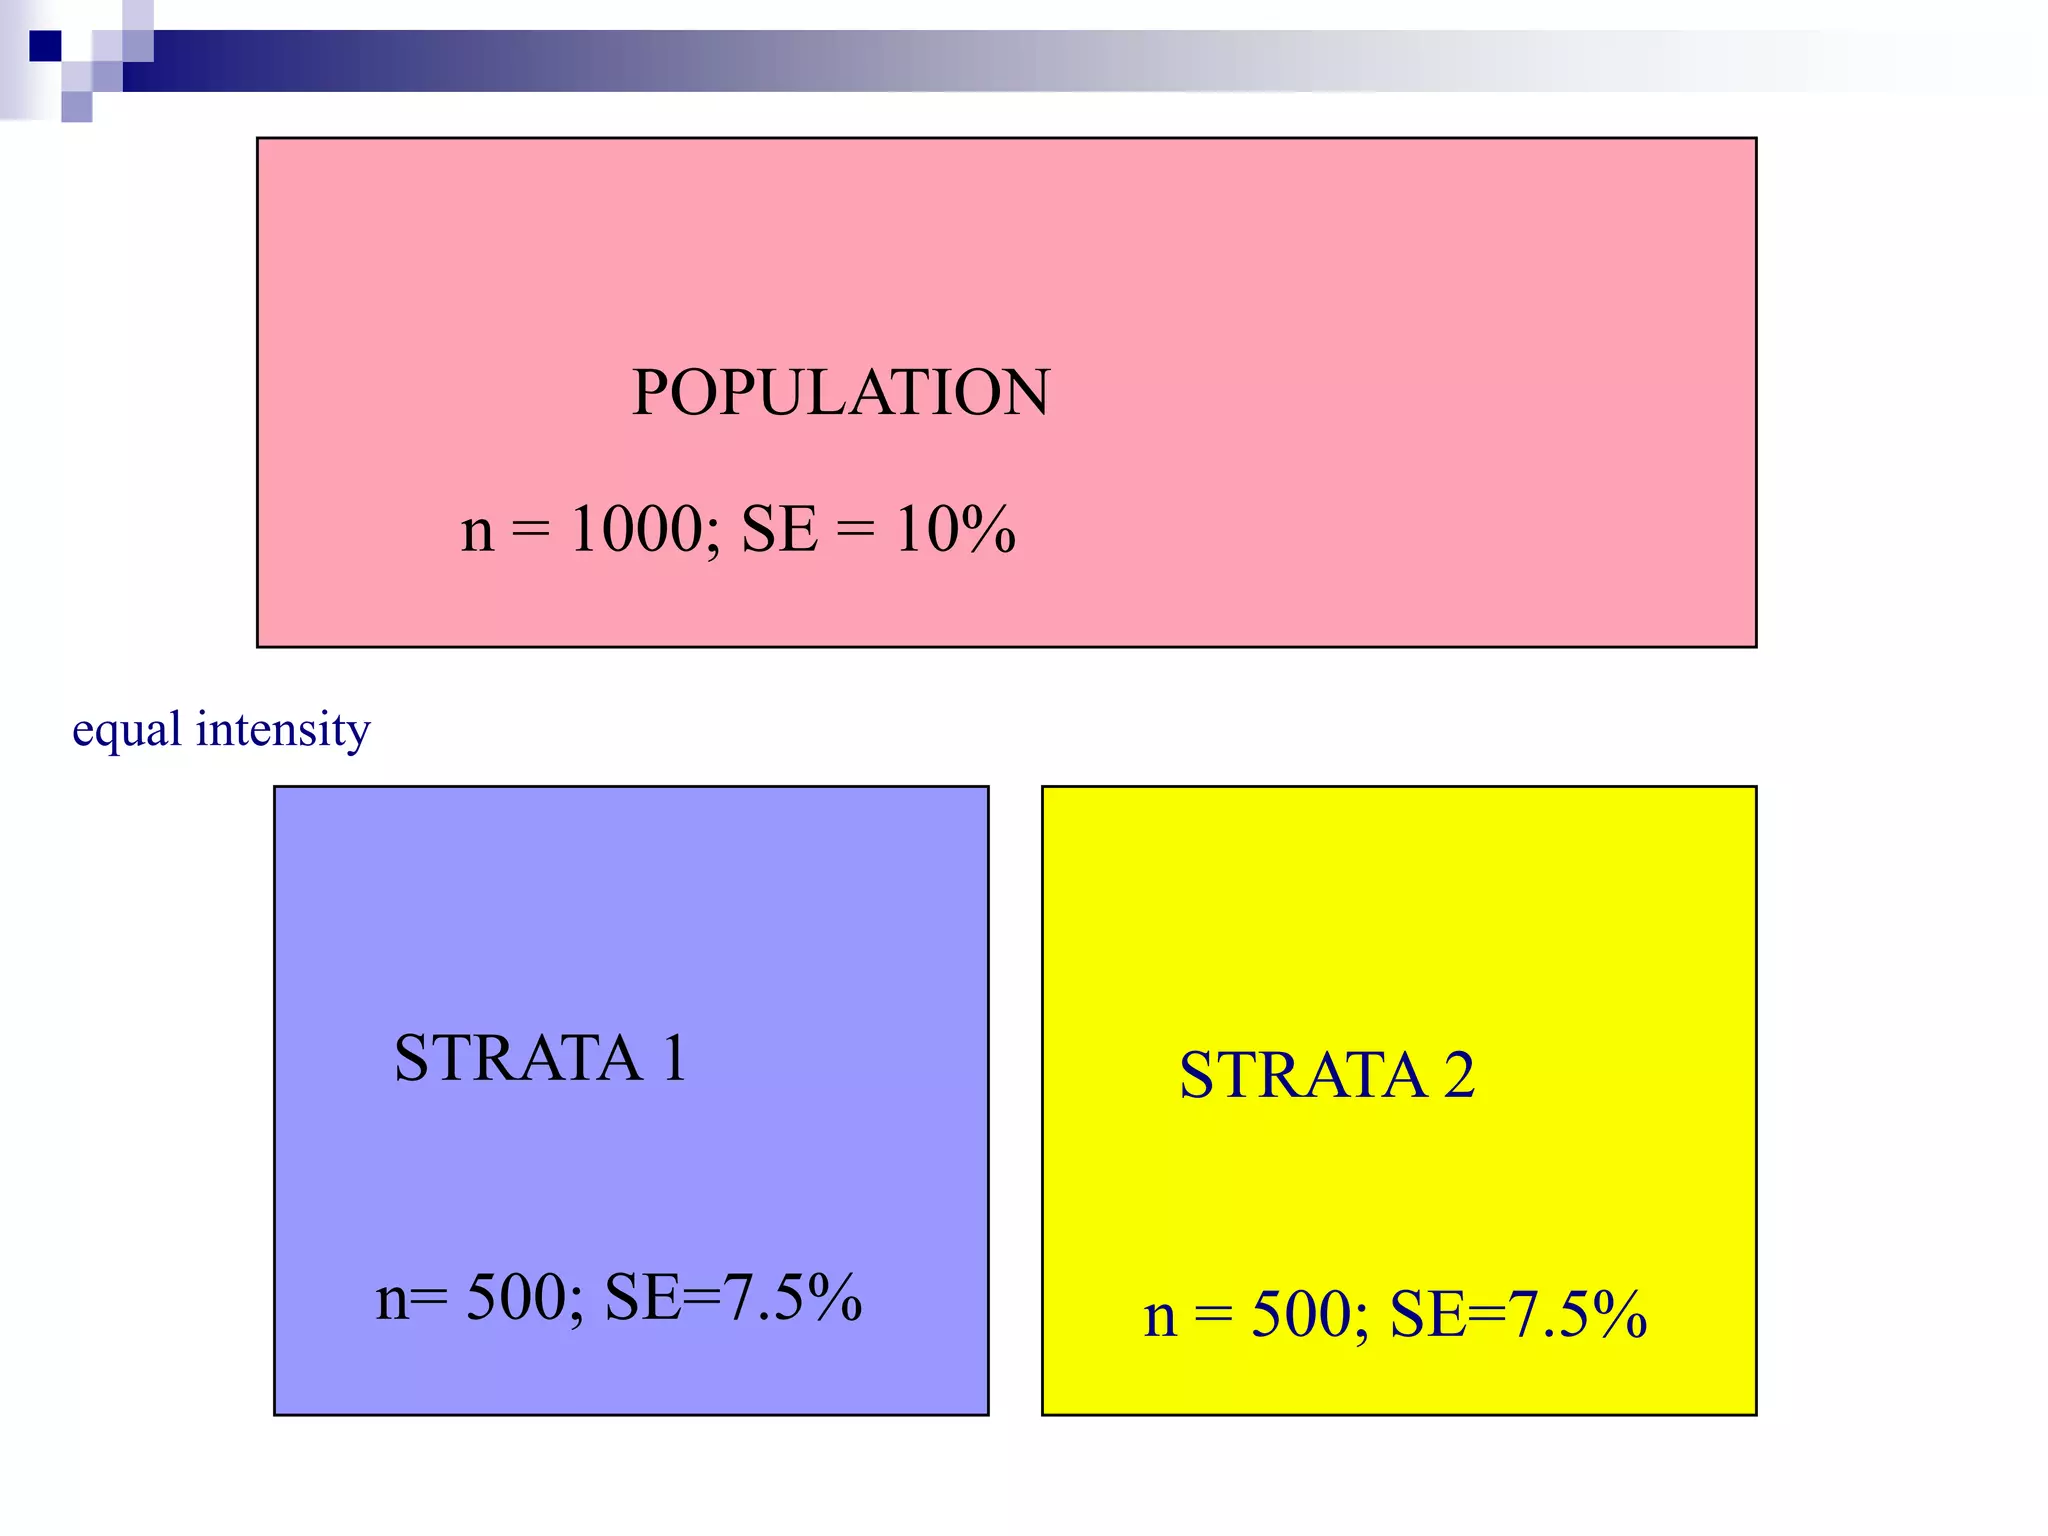
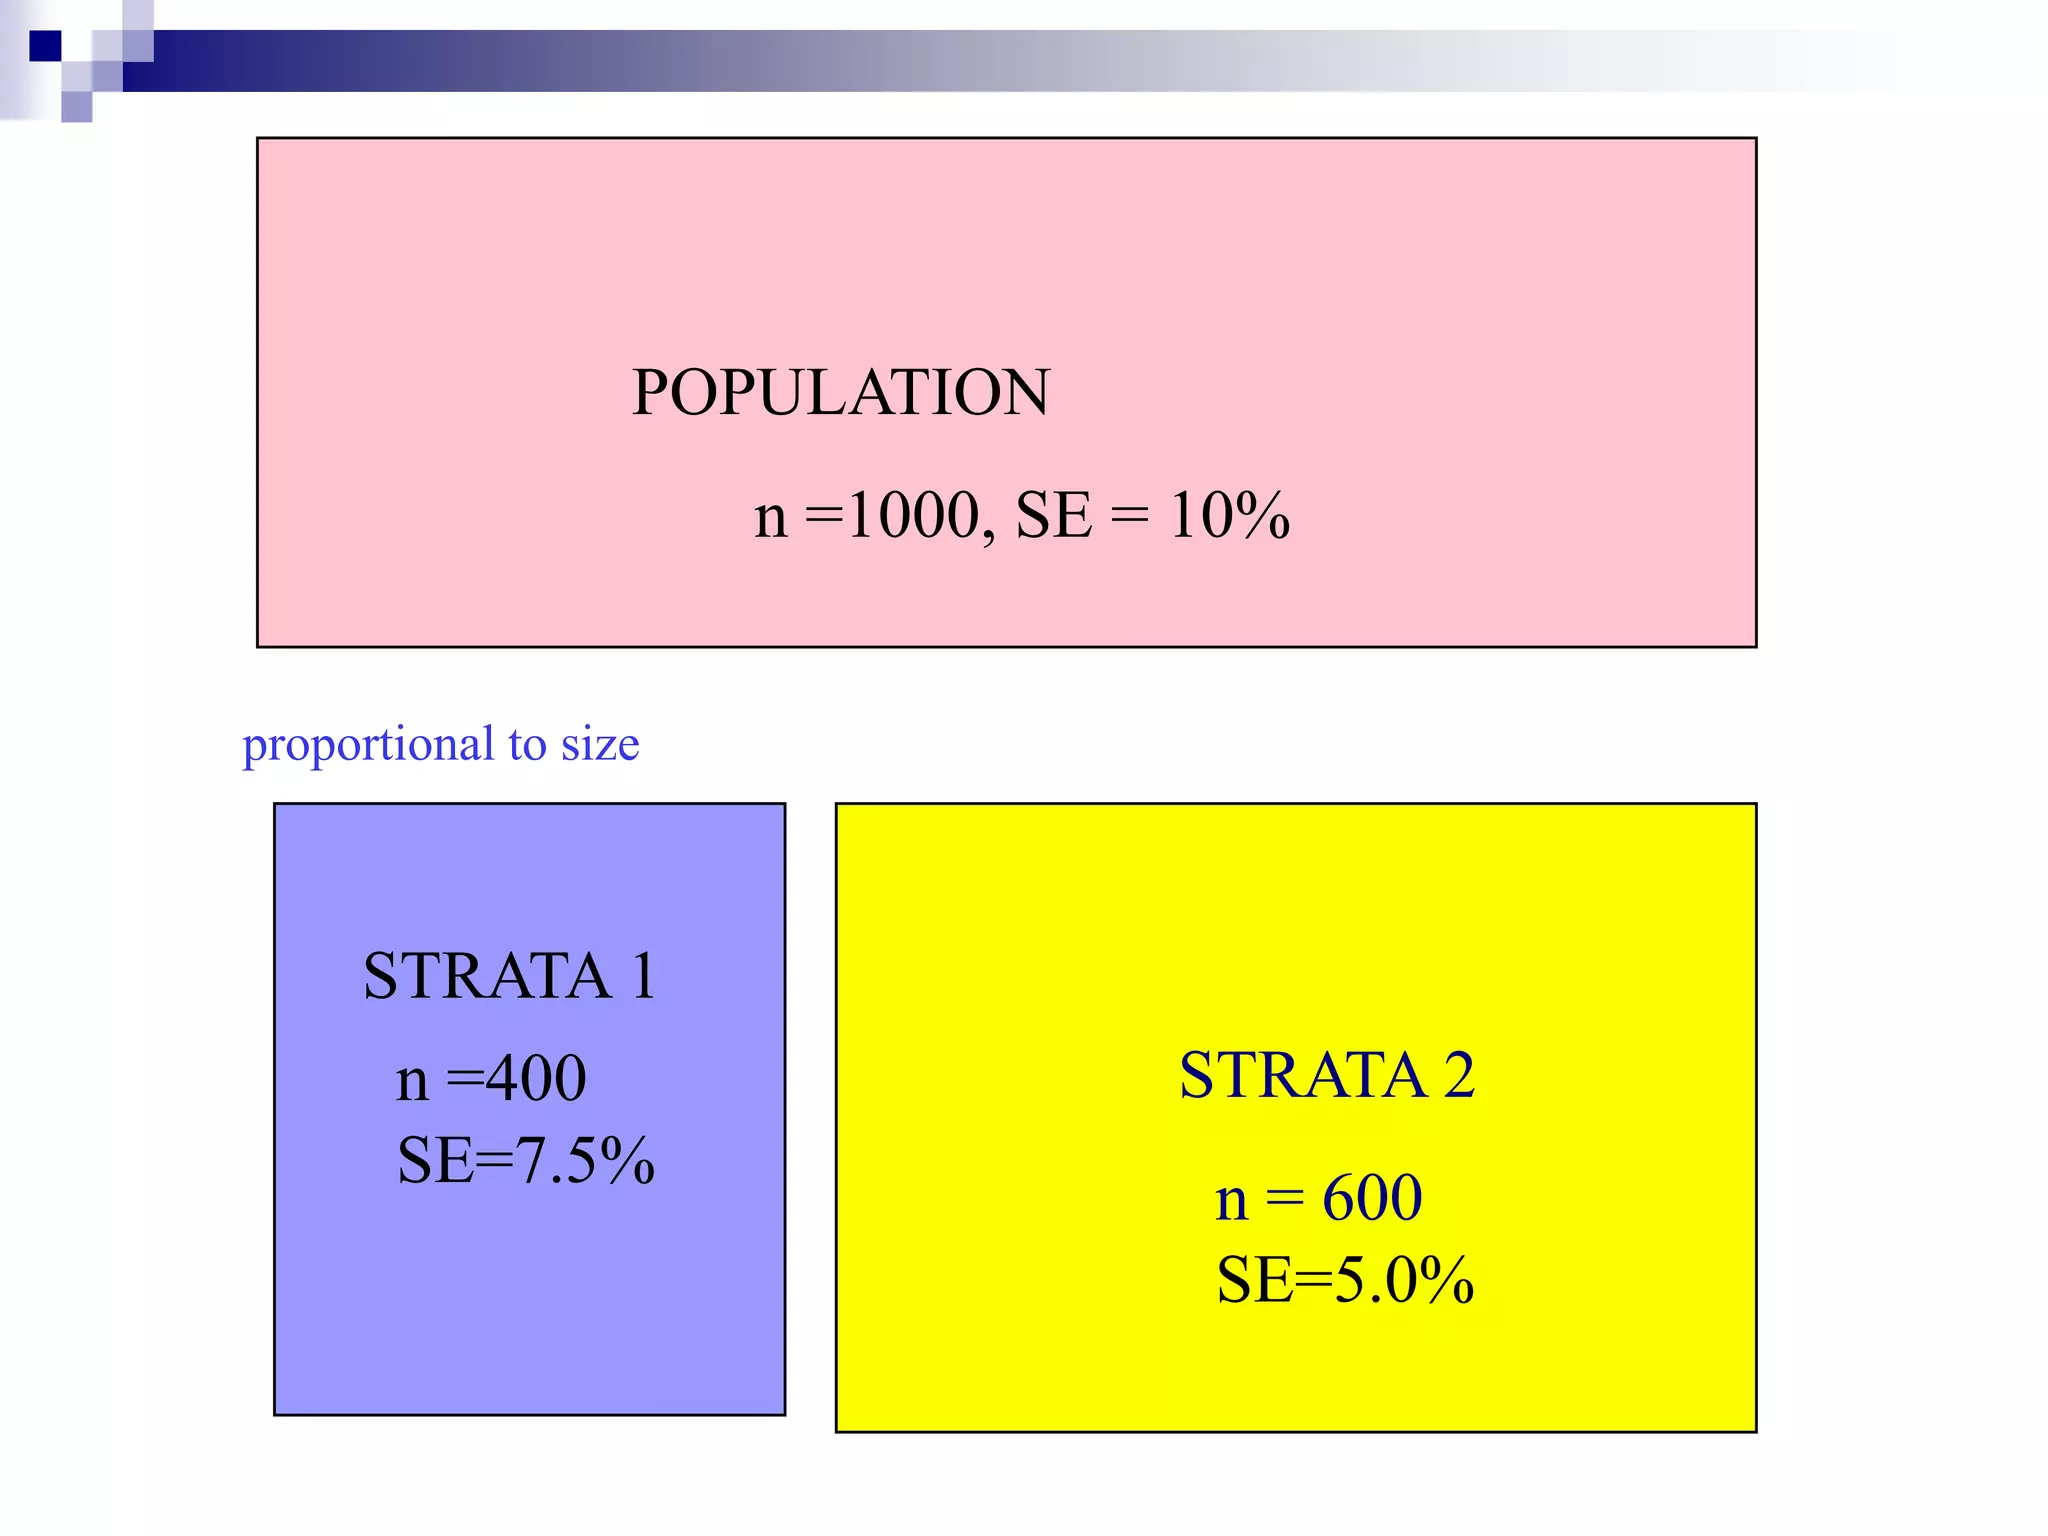
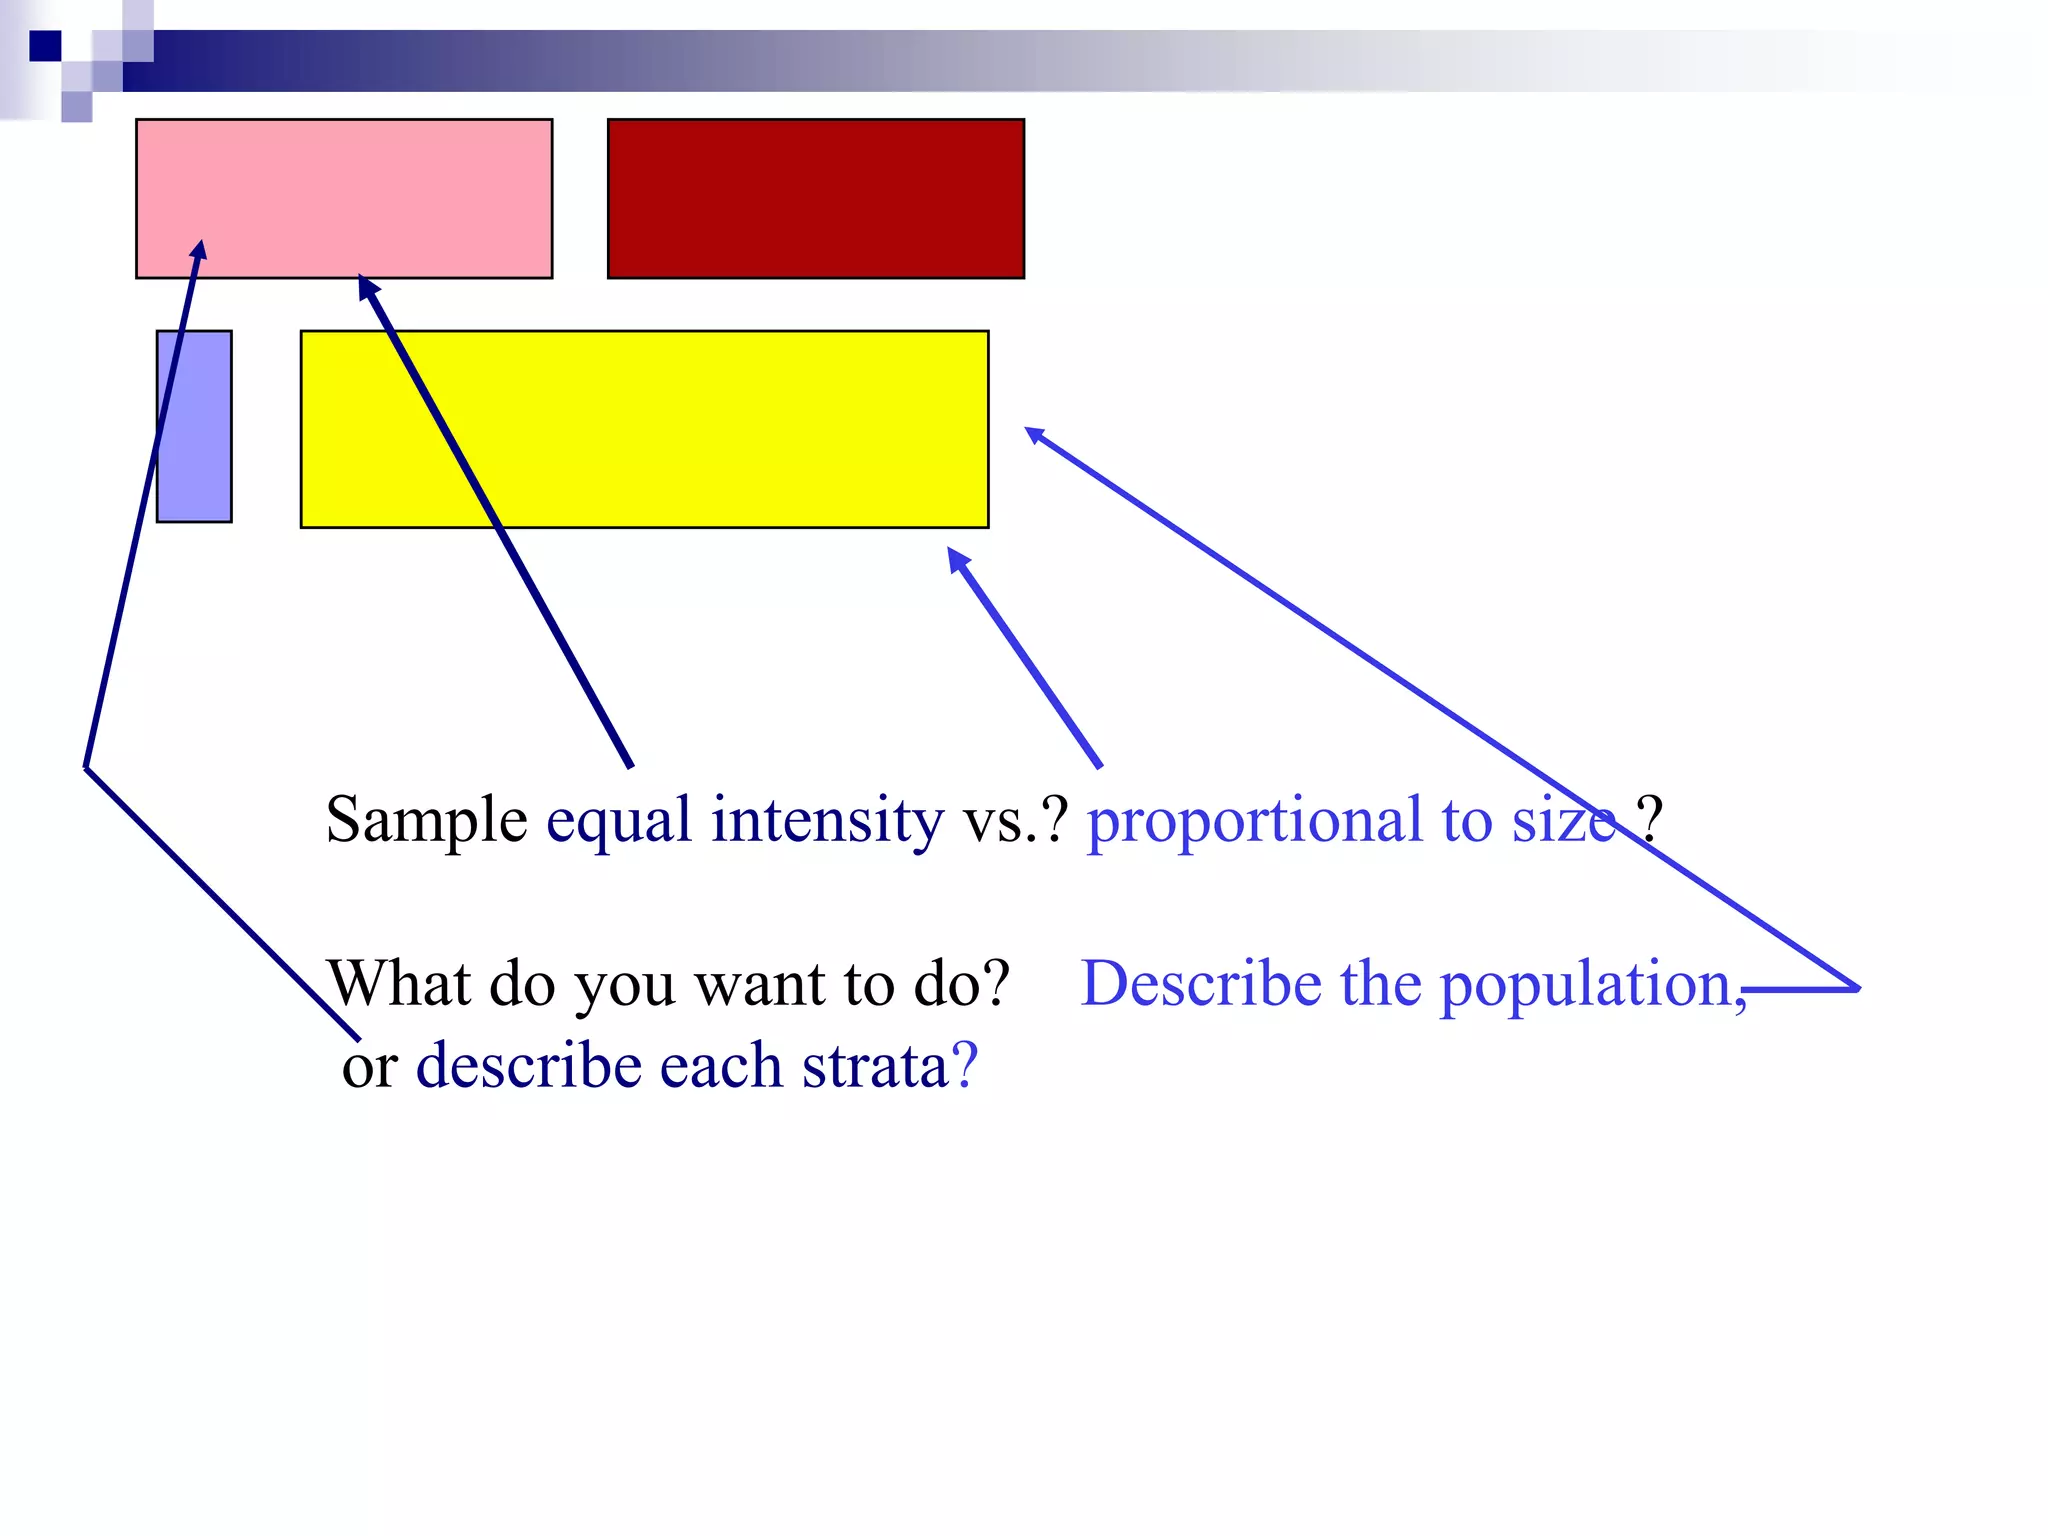
PROBABILITY
SAMPLING:
CONCEPTS AND
TERMINOLOGY

Selecting individual observations to most
efficiently yield knowledge without bias
What is sampling?


If all members of a population were identical, the
population is considered to be homogenous.



That is, the characteristics of any one individual
in the population would be the same as the
characteristics of any other individual (little or no
variation among individuals).

So, if the human population on
Earth was homogenous in
characteristics, how many
people would an alien need to
abduct in order to understand
what humans were like?
What is sampling?





When individual members of a population are different from
each other, the population is considered to be
heterogeneous (having significant variation among
individuals).
How does this change an alien‟s abduction scheme to find
out more about humans?
In order to describe a heterogeneous
population, observations of multiple individuals are needed
to account for all possible characteristics that may exist.
What is Sampling?
What you
want to talk
about

What you
actually
observe in
the data

Population

Sampling Process

Sample

Sampling
Frame
Inference

Using data to say something (make an inference) with confidence, about
a whole (population) based on the study of a only a few (sample).
What is sampling?


If a sample of a population is to provide useful
information about that population, then the sample
must contain essentially the same variation as the
population.



The more heterogeneous a population is…




The greater the chance is that a sample may not
adequately describe a population we could be wrong in
the inferences we make about the population.

And…


The larger the sample needs to be to adequately describe
the population we need more observations to be able to
make accurate inferences.
What is Sampling?


Sampling is the process of selecting observations (a
sample) to provide an adequate description and robust
inferences of the population




The sample is representative of the population.

There are 2 types of sampling:
Non-Probability sampling (Thurday‟s lecture)
 Probability sampling

Probability Sampling





A sample must be representative of the population
with respect to the variables of interest.
A sample will be representative of the population from
which it is selected if each member of the population
has an equal chance (probability) of being selected.
Probability samples are more accurate than nonprobability samples





They remove conscious and unconscious sampling bias.

Probability samples allow us to estimate the accuracy
of the sample.
Probability samples permit the estimation of population
parameters.
The Language of Sampling


Sample element: a case or a single unit that is selected from a population
and measured in some way—the basis of analysis (e.g., an
person, thing, specific time, etc.).



Universe: the theoretical aggregation of all possible elements—unspecified
to time and space (e.g., University of Idaho).



Population: the theoretical aggregation of specified elements as defined
for a given survey defined by time and space (e.g., UI students and staff in
2008).



Sample or Target population: the aggregation of the population from
which the sample is actually drawn (e.g., UI students and faculty in 2008-09
academic year).



Sample frame: a specific list that closely approximates all elements in the
population—from this the researcher selects units to create the study
sample (Vandal database of UI students and faculty in 2008-09).



Sample: a set of cases that is drawn from a larger pool and used to make
generalizations about the population
Conceptual Model
Universe
Population

Sample Population
Sample Frame

Elements
How large should a Sample
Be?


Sample size depends on:


How much sampling error can be tolerated—levels of precision
 Size of the population—sample size matters with small populations
 Variation within the population with respect to the characteristic of
interest—what you are investigating
 Smallest subgroup within the sample for which estimates are needed
 Sample needs to be big enough to properly estimate the smallest
subgroup

 http://www.surveysystem.com/sscalc.htm
How large should a Sample
Be?
Sample Statistics






Parameter: any characteristic of a population that is true known on
the basis of a census (e.g., % of males or females; % of college
students in a population).
Estimate: any characteristic of a sample that is estimated
estimated on the basis of samples (e.g., % of males or females; % of
college students in a sample). Samples have:
Sampling Error: an estimate of precision; estimates how close
sample estimates are to a true population value for a characteristic.


Occurs as a result of selecting a sample rather than surveying an entire population



Standard Error: (SE) a measure of sampling error.



SE is an inverse function of sample size.




As sample size increases, SE decreases—the sample is more precise.
So, we want to use the smallest SE we can greatest precision!
When in doubt—increase sample size.
Sample Statistics


SE will be highest for a population that has a 50:50 distribution on some
characteristic of interest, while it is non-existent with a distribution of 100:0.

s = standard error
n = sample size
p = % having a particular
characteristic (or 1-q)
q = % no having a particular
characteristic (or 1-p)

S=

q*p

S=

n
S=

.9 * .1
100

= .03 or 3%
.

.5 *.5 = .05 or 5%
100
Random Selection or
Assignment











Selection process with no pattern; unpredictable
Each element has an equal probability of being selected for a study
Reduces the likelihood of researcher bias
Researcher can calculate the probability of certain outcomes
Variety of types of probability samples—we’ll touch on soon
Why Random Assignment?
Samples that are assigned in a random fashion are most likely to be
truly representative of the population under consideration.
Can calculate the deviation between sample results and a
population parameter due to random processes.
Simple Random Sampling
(SRS)


The basic sampling method which most others are based on.



Method:
A sample size „n‟ is drawn from a population „N‟ in such a way that every possible
element in the population has the same chance of being selected.
 Take a number of samples to create a sampling distribution




Typically conducted “without replacement”



What are some ways for conducting an SRS?




Random numbers table, drawing out of a hat, random timer, etc.

Not usually the most efficient, but can be most accurate!



Time & money can become an issue
What if you only have enough time and money to conduct one sample?
Systematic Random Sampling
(SS)


Method:




Sampling Interval tells the researcher how to select elements
from the frame (1 in „k‟ elements is selected).




Starting from a random point on a sampling frame, every nth element in the frame
is selected at equal intervals (sampling interval).

Depends on sample size needed

Example:


You have a sampling frame (list) of 10,000 people and you need a sample of
1000 for your study…What is the sampling interval that you should follow?
 Every 10th person listed (1 in 10 persons)



Empirically provides identical results to SRS, but is more efficient.
Caution: Need to keep in mind the nature of your frame for SS to
work—beware of periodicity.
In Simple Random Sampling

The gap, or period between successive elements is
random, uneven, has no particular pattern.
In Systematic Sampling

Gaps between elements are equal and
Constant There is periodicity.
The Periodicity Problem

M

M

M

M

M

M

If the periodicity in the sample matches a periodicity in
the population, then the sample is no longer random.
In fact it may be grossly biased!

Which type of sampling is more appropriate in this situation?
SRS
Stratified Sampling (StS)


Method:
 Divide the population by certain characteristics into homogeneous
subgroups (strata) (e.g., UI PhD students, Masters
Students, Bachelors students).
 Elements within each strata are homogeneous, but are
heterogeneous across strata.
 A simple random or a systematic sample is taken from each strata
relative to the proportion of that stratum to each of the others.



Researchers use stratified sampling
 When a stratum of interest is a small percentage of a population
and random processes could miss the stratum by chance.
 When enough is known about the population that it can be easily
broken into subgroups or strata.
POPULATION

n = 1000; SE = 10%
equal intensity

STRATA 1

n= 500; SE=7.5%

STRATA 2

n = 500; SE=7.5%
POPULATION
n =1000, SE = 10%

proportional to size

STRATA 1
n =400
SE=7.5%

STRATA 2
n = 600
SE=5.0%
Sample equal intensity vs.? proportional to size ?
What do you want to do?
or describe each strata?

Describe the population,
Cluster sampling


Some populations are spread out (over a state or
country).



Elements occur in clumps (towns, districts)—Primary
sampling units (PSU).



Elements are hard to reach and identify.



Trade accuracy for efficiency.



You cannot assume that any one clump is better or
worse than another clump.
POPULATION
“CLUMP”
POPULATION
Primary sampling
Unit
POPULATION

= Randomly selected PRIMARY SAMPLING UNITS.
Randomly selected
PRIMARY SAMPLING UNITS

Elements; sample ALL in the
selected primary sampling unit.
Cluster sampling


Used when:


Researchers lack a good sampling frame for a dispersed
population.
 The cost to reach an element to sample is very high.


Each cluster is as varied heterogeneous internally and
homogeneous to all the other clusters.



Usually less expensive than SRS but not as accurate




Each stage in cluster sampling introduces sampling
error—the more stages there are, the more error there
tends to be.

Can combine SRS, SS, stratification and cluster
sampling!!
Examples of Clusters and
Strata


Recreation Research:
 Strata:

weekday-weekend; gender; type of
travel; season; size of operation; etc.
 What are some others?
 Clusters:

counties; entry points (put-in and takeouts); time of day, city blocks, road or trail
segments.
 What are some others?

Sample

  • 1.
    PROBABILITY SAMPLING: CONCEPTS AND TERMINOLOGY Selecting individualobservations to most efficiently yield knowledge without bias
  • 2.
    What is sampling?  Ifall members of a population were identical, the population is considered to be homogenous.  That is, the characteristics of any one individual in the population would be the same as the characteristics of any other individual (little or no variation among individuals). So, if the human population on Earth was homogenous in characteristics, how many people would an alien need to abduct in order to understand what humans were like?
  • 3.
    What is sampling?    Whenindividual members of a population are different from each other, the population is considered to be heterogeneous (having significant variation among individuals). How does this change an alien‟s abduction scheme to find out more about humans? In order to describe a heterogeneous population, observations of multiple individuals are needed to account for all possible characteristics that may exist.
  • 4.
    What is Sampling? Whatyou want to talk about What you actually observe in the data Population Sampling Process Sample Sampling Frame Inference Using data to say something (make an inference) with confidence, about a whole (population) based on the study of a only a few (sample).
  • 6.
    What is sampling?  Ifa sample of a population is to provide useful information about that population, then the sample must contain essentially the same variation as the population.  The more heterogeneous a population is…   The greater the chance is that a sample may not adequately describe a population we could be wrong in the inferences we make about the population. And…  The larger the sample needs to be to adequately describe the population we need more observations to be able to make accurate inferences.
  • 7.
    What is Sampling?  Samplingis the process of selecting observations (a sample) to provide an adequate description and robust inferences of the population   The sample is representative of the population. There are 2 types of sampling: Non-Probability sampling (Thurday‟s lecture)  Probability sampling 
  • 8.
    Probability Sampling    A samplemust be representative of the population with respect to the variables of interest. A sample will be representative of the population from which it is selected if each member of the population has an equal chance (probability) of being selected. Probability samples are more accurate than nonprobability samples    They remove conscious and unconscious sampling bias. Probability samples allow us to estimate the accuracy of the sample. Probability samples permit the estimation of population parameters.
  • 9.
    The Language ofSampling  Sample element: a case or a single unit that is selected from a population and measured in some way—the basis of analysis (e.g., an person, thing, specific time, etc.).  Universe: the theoretical aggregation of all possible elements—unspecified to time and space (e.g., University of Idaho).  Population: the theoretical aggregation of specified elements as defined for a given survey defined by time and space (e.g., UI students and staff in 2008).  Sample or Target population: the aggregation of the population from which the sample is actually drawn (e.g., UI students and faculty in 2008-09 academic year).  Sample frame: a specific list that closely approximates all elements in the population—from this the researcher selects units to create the study sample (Vandal database of UI students and faculty in 2008-09).  Sample: a set of cases that is drawn from a larger pool and used to make generalizations about the population
  • 11.
  • 12.
    How large shoulda Sample Be?  Sample size depends on:  How much sampling error can be tolerated—levels of precision  Size of the population—sample size matters with small populations  Variation within the population with respect to the characteristic of interest—what you are investigating  Smallest subgroup within the sample for which estimates are needed  Sample needs to be big enough to properly estimate the smallest subgroup  http://www.surveysystem.com/sscalc.htm
  • 13.
    How large shoulda Sample Be?
  • 14.
    Sample Statistics    Parameter: anycharacteristic of a population that is true known on the basis of a census (e.g., % of males or females; % of college students in a population). Estimate: any characteristic of a sample that is estimated estimated on the basis of samples (e.g., % of males or females; % of college students in a sample). Samples have: Sampling Error: an estimate of precision; estimates how close sample estimates are to a true population value for a characteristic.  Occurs as a result of selecting a sample rather than surveying an entire population  Standard Error: (SE) a measure of sampling error.  SE is an inverse function of sample size.    As sample size increases, SE decreases—the sample is more precise. So, we want to use the smallest SE we can greatest precision! When in doubt—increase sample size.
  • 16.
    Sample Statistics  SE willbe highest for a population that has a 50:50 distribution on some characteristic of interest, while it is non-existent with a distribution of 100:0. s = standard error n = sample size p = % having a particular characteristic (or 1-q) q = % no having a particular characteristic (or 1-p) S= q*p S= n S= .9 * .1 100 = .03 or 3% . .5 *.5 = .05 or 5% 100
  • 17.
    Random Selection or Assignment         Selectionprocess with no pattern; unpredictable Each element has an equal probability of being selected for a study Reduces the likelihood of researcher bias Researcher can calculate the probability of certain outcomes Variety of types of probability samples—we’ll touch on soon Why Random Assignment? Samples that are assigned in a random fashion are most likely to be truly representative of the population under consideration. Can calculate the deviation between sample results and a population parameter due to random processes.
  • 18.
    Simple Random Sampling (SRS)  Thebasic sampling method which most others are based on.  Method: A sample size „n‟ is drawn from a population „N‟ in such a way that every possible element in the population has the same chance of being selected.  Take a number of samples to create a sampling distribution   Typically conducted “without replacement”  What are some ways for conducting an SRS?   Random numbers table, drawing out of a hat, random timer, etc. Not usually the most efficient, but can be most accurate!   Time & money can become an issue What if you only have enough time and money to conduct one sample?
  • 19.
    Systematic Random Sampling (SS)  Method:   SamplingInterval tells the researcher how to select elements from the frame (1 in „k‟ elements is selected).   Starting from a random point on a sampling frame, every nth element in the frame is selected at equal intervals (sampling interval). Depends on sample size needed Example:  You have a sampling frame (list) of 10,000 people and you need a sample of 1000 for your study…What is the sampling interval that you should follow?  Every 10th person listed (1 in 10 persons)   Empirically provides identical results to SRS, but is more efficient. Caution: Need to keep in mind the nature of your frame for SS to work—beware of periodicity.
  • 20.
    In Simple RandomSampling The gap, or period between successive elements is random, uneven, has no particular pattern.
  • 21.
    In Systematic Sampling Gapsbetween elements are equal and Constant There is periodicity.
  • 22.
    The Periodicity Problem M M M M M M Ifthe periodicity in the sample matches a periodicity in the population, then the sample is no longer random. In fact it may be grossly biased! Which type of sampling is more appropriate in this situation? SRS
  • 23.
    Stratified Sampling (StS)  Method: Divide the population by certain characteristics into homogeneous subgroups (strata) (e.g., UI PhD students, Masters Students, Bachelors students).  Elements within each strata are homogeneous, but are heterogeneous across strata.  A simple random or a systematic sample is taken from each strata relative to the proportion of that stratum to each of the others.  Researchers use stratified sampling  When a stratum of interest is a small percentage of a population and random processes could miss the stratum by chance.  When enough is known about the population that it can be easily broken into subgroups or strata.
  • 24.
    POPULATION n = 1000;SE = 10% equal intensity STRATA 1 n= 500; SE=7.5% STRATA 2 n = 500; SE=7.5%
  • 25.
    POPULATION n =1000, SE= 10% proportional to size STRATA 1 n =400 SE=7.5% STRATA 2 n = 600 SE=5.0%
  • 26.
    Sample equal intensityvs.? proportional to size ? What do you want to do? or describe each strata? Describe the population,
  • 27.
    Cluster sampling  Some populationsare spread out (over a state or country).  Elements occur in clumps (towns, districts)—Primary sampling units (PSU).  Elements are hard to reach and identify.  Trade accuracy for efficiency.  You cannot assume that any one clump is better or worse than another clump.
  • 28.
  • 29.
  • 30.
    POPULATION = Randomly selectedPRIMARY SAMPLING UNITS.
  • 31.
    Randomly selected PRIMARY SAMPLINGUNITS Elements; sample ALL in the selected primary sampling unit.
  • 32.
    Cluster sampling  Used when:  Researcherslack a good sampling frame for a dispersed population.  The cost to reach an element to sample is very high.  Each cluster is as varied heterogeneous internally and homogeneous to all the other clusters.  Usually less expensive than SRS but not as accurate   Each stage in cluster sampling introduces sampling error—the more stages there are, the more error there tends to be. Can combine SRS, SS, stratification and cluster sampling!!
  • 33.
    Examples of Clustersand Strata  Recreation Research:  Strata: weekday-weekend; gender; type of travel; season; size of operation; etc.  What are some others?  Clusters: counties; entry points (put-in and takeouts); time of day, city blocks, road or trail segments.  What are some others?