Here is an alphabetical list of biases mentioned in the document along with their type and which study design they can occur in:
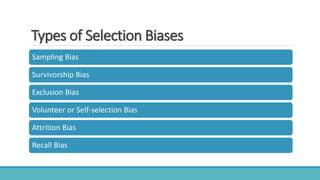
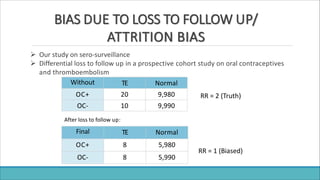
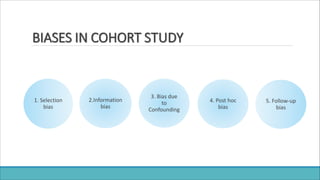
- Attrition bias (selection bias) - Can occur in cohort studies
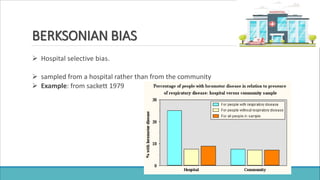
- Berksonian bias (selection bias) - Can occur in observational studies
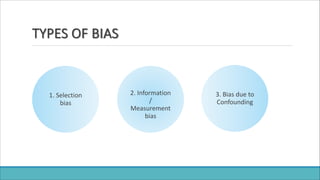
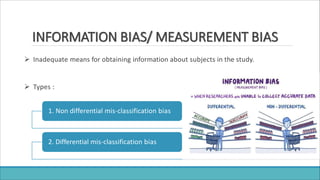
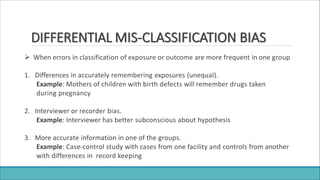
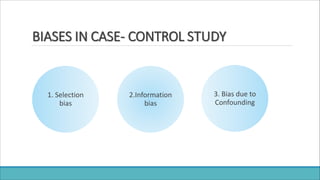
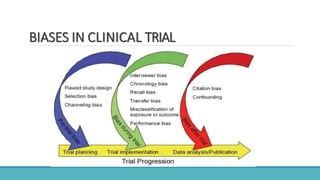
- Information bias/Measurement bias - Can occur in all study designs
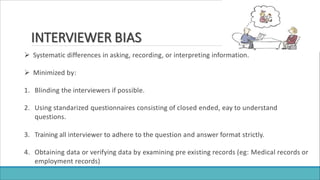
- Interview bias (information bias) - Can occur in case-control and cohort studies
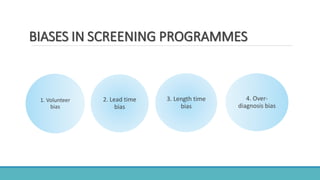
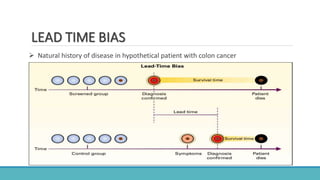
- Lead time bias (selection bias) - Can occur in screening studies
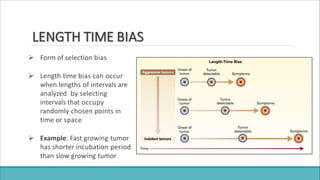
- Length time bias (selection bias) - Can occur in screening studies
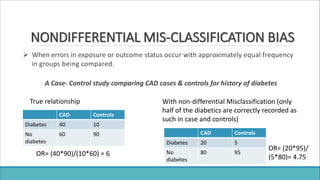
- Non-differential misclassification bias (information bias) - Can occur in all study designs
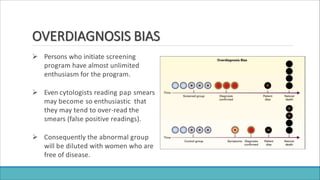
- Overdiagnosis bias (selection bias