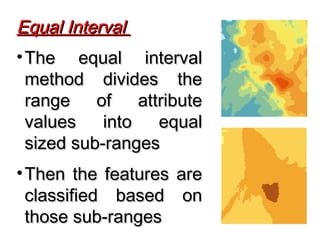
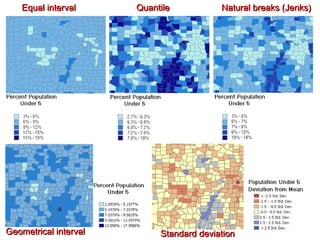
Classification method changes a continuousClassification method changes a continuous
data theme (e.g. a DEM) to discrete classesdata theme (e.g. a DEM) to discrete classes
  
The purpose of classification is two-fold:The purpose of classification is two-fold:
  
•To make the process of reading andTo make the process of reading and
understanding a map easierunderstanding a map easier
•To show something about the area which isTo show something about the area which is
being studied that is not self-evidentbeing studied that is not self-evident
Classificaiton methods in GISClassificaiton methods in GIS
There areThere are sixsix classificationclassification
methods, which are commonlymethods, which are commonly
used in GIS:used in GIS:
  
•Equal IntervalEqual Interval
•Natural Breaks (Jenks)Natural Breaks (Jenks)
•QuantileQuantile
•Equal AreaEqual Area
•Standard DeviationsStandard Deviations
•Geometrical intervalGeometrical interval
Equal IntervalEqual Interval  
• The equal intervalThe equal interval
method divides themethod divides the
range of attributerange of attribute
values into equalvalues into equal
sized sub-rangessized sub-ranges
• Then the features areThen the features are
classified based onclassified based on
those sub-rangesthose sub-ranges
Natural Breaks (Jenks)Natural Breaks (Jenks)
  
•This method identifies breakpoints betweenThis method identifies breakpoints between
classes using a statistical formula (Jenk’sclasses using a statistical formula (Jenk’s
optimization)optimization)
•This method is rather complex, butThis method is rather complex, but
basically the Jenk’s method minimizes thebasically the Jenk’s method minimizes the
sum of the variance within each of thesum of the variance within each of the
classesclasses
•Natural Breaks finds groupings andNatural Breaks finds groupings and
patterns inherent in your datapatterns inherent in your data
QuantileQuantile
  
•In this method, each classIn this method, each class
contains the same numbercontains the same number
of featuresof features
•Quantile classes areQuantile classes are
perhaps the easiest toperhaps the easiest to
understand, but they canunderstand, but they can
be misleading.be misleading.
• Population counts (as opposed toPopulation counts (as opposed to
density or percentage), for example,density or percentage), for example,
are usually not suitable for quantileare usually not suitable for quantile
classification because only a fewclassification because only a few
places are highly populated.places are highly populated.
• One can overcome this distortion byOne can overcome this distortion by
increasing the number of classes.increasing the number of classes.
• Quantiles are best suited for data thatQuantiles are best suited for data that
is linearly distributedis linearly distributed
Equal AreaEqual Area
  
This method classifiesThis method classifies
polygon features by findingpolygon features by finding
breakpoints so that the totalbreakpoints so that the total
area of the polygons in eacharea of the polygons in each
class is the approximately theclass is the approximately the
same.same.
• Classes determined with theClasses determined with the
equal area method are typicallyequal area method are typically
very similar to Quantile classesvery similar to Quantile classes
when the sizes of all the featureswhen the sizes of all the features
are roughly the same.are roughly the same.
• Equal Area will differ fromEqual Area will differ from
Quantile if the features are ofQuantile if the features are of
vastly different areas.vastly different areas.
Standard DeviationsStandard Deviations
  
In this method, the mean valueIn this method, the mean value
is found and then class breaksis found and then class breaks
above and below the mean atabove and below the mean at
intervals of either 1/4, 1/2, or 1intervals of either 1/4, 1/2, or 1
standard deviations are placedstandard deviations are placed
until all the data values areuntil all the data values are
contained within the classes.contained within the classes.
Further, values are aggregatedFurther, values are aggregated
those are beyond three standardthose are beyond three standard
deviations from the mean into twodeviations from the mean into two
classes, greater than threeclasses, greater than three
standard deviations above thestandard deviations above the
mean ("> 3 Std Dev.") and lessmean ("> 3 Std Dev.") and less
than three standard deviationsthan three standard deviations
below the mean ("< -3 Std. Dev.").below the mean ("< -3 Std. Dev.").
• This is a classification scheme whereThis is a classification scheme where
the class breaks are based on classthe class breaks are based on class
intervals that have a geometricalintervals that have a geometrical
series.series.
Geometrical intervalGeometrical interval
• The geometric coefficient in thisThe geometric coefficient in this
classifier can change once (to itsclassifier can change once (to its
inverse) to optimize the classinverse) to optimize the class
ranges.ranges.
• The algorithm creates theseThe algorithm creates these
geometrical intervals bygeometrical intervals by
minimizing the square sum ofminimizing the square sum of
element per class.element per class.
• This ensures that each class range hasThis ensures that each class range has
approximately the same number ofapproximately the same number of
values with each class and that thevalues with each class and that the
change between intervals is fairlychange between intervals is fairly
consistent.consistent.
• This algorithm was specifically designedThis algorithm was specifically designed
to accommodate continuous datato accommodate continuous data
• It produces a result that is visuallyIt produces a result that is visually
appealing and cartographicallyappealing and cartographically
comprehensive.comprehensive.
• It minimizes variance withinIt minimizes variance within
classes, and can even workclasses, and can even work
reasonably well on data that is notreasonably well on data that is not
normally distributed.normally distributed.
• This classification method is alsoThis classification method is also
called Smart Quantilescalled Smart Quantiles
Equal intervalEqual interval QuantileQuantile Natural breaks (Jenks)Natural breaks (Jenks)
Geometrical intervalGeometrical interval Standard deviationStandard deviation
ManuallyManually
classification isclassification is
done to emphasizedone to emphasize
a particular rangea particular range
of values, such asof values, such as
those above orthose above or
below a thresholdbelow a threshold
value.value.
Manual ClassificationManual Classification
For example, one may want to emphasizeFor example, one may want to emphasize
areas below a certain elevation level thatareas below a certain elevation level that
are susceptible to flooding.are susceptible to flooding.
LATUR
BID
PUNE
NASHIK
DHULE
AKOLA
SOLAPUR
THANE
SATARA
YAVATMAL
NANDED
JALGAON
JALNA
NAGPUR
AMRAVATI
AHMADNAGAR
GADCHIROLI
SANGLI
PARBHANI
BULDANA
BHANDARA
CHANDRAPUR
RATNAGIRI
RAIGARH
AURANGABAD
KOLHAPUR
WARDHA
OSMANABAD
SINDHUDURG
Rural Houses (%)
0 - 10
10 - 20
20 - 30
30 - 40
40 - 50
50 - 60
60 - 70
70 - 80
80 - 90
90 - 100
0 50 100 150 Kilometers
MAHARASTRA (District classification based on Rural Houses Percentage)
…there has been lot of discussion about
Latur Earthquake….
Why there is not much discussion about
Jabalpur?
JABALPUR
KHARGON
KHANDAWA
Rural Houses (%)
0 - 10
10 - 20
20 - 30
30 - 40
40 - 50
50 - 60
60 - 70
70 - 80
80 - 90
90 - 100
0 100 200 Kilometers
MADHAYA PRADESH (District classification based on Rural Houses Percentage)
DISTRICT LATUR KHARGON JABALPUR
THEME
RURAL POPULATION
(%)
79.6 85.0 54.5
URBAN POPULATION
(%)
20.4 15.0 45.5
RURAL HOUSES (%) 79.6 83.9 55.6
URBAN HOUSES (%) 20.4 16.1 44.4

Lecture 13 classification_methods

  • 1.
    Classification method changesa continuousClassification method changes a continuous data theme (e.g. a DEM) to discrete classesdata theme (e.g. a DEM) to discrete classes    The purpose of classification is two-fold:The purpose of classification is two-fold:    •To make the process of reading andTo make the process of reading and understanding a map easierunderstanding a map easier •To show something about the area which isTo show something about the area which is being studied that is not self-evidentbeing studied that is not self-evident Classificaiton methods in GISClassificaiton methods in GIS
  • 2.
    There areThere aresixsix classificationclassification methods, which are commonlymethods, which are commonly used in GIS:used in GIS:    •Equal IntervalEqual Interval •Natural Breaks (Jenks)Natural Breaks (Jenks) •QuantileQuantile •Equal AreaEqual Area •Standard DeviationsStandard Deviations •Geometrical intervalGeometrical interval
  • 3.
    Equal IntervalEqual Interval   •The equal intervalThe equal interval method divides themethod divides the range of attributerange of attribute values into equalvalues into equal sized sub-rangessized sub-ranges • Then the features areThen the features are classified based onclassified based on those sub-rangesthose sub-ranges
  • 4.
    Natural Breaks (Jenks)NaturalBreaks (Jenks)    •This method identifies breakpoints betweenThis method identifies breakpoints between classes using a statistical formula (Jenk’sclasses using a statistical formula (Jenk’s optimization)optimization) •This method is rather complex, butThis method is rather complex, but basically the Jenk’s method minimizes thebasically the Jenk’s method minimizes the sum of the variance within each of thesum of the variance within each of the classesclasses •Natural Breaks finds groupings andNatural Breaks finds groupings and patterns inherent in your datapatterns inherent in your data
  • 5.
    QuantileQuantile    •In this method,each classIn this method, each class contains the same numbercontains the same number of featuresof features •Quantile classes areQuantile classes are perhaps the easiest toperhaps the easiest to understand, but they canunderstand, but they can be misleading.be misleading.
  • 6.
    • Population counts(as opposed toPopulation counts (as opposed to density or percentage), for example,density or percentage), for example, are usually not suitable for quantileare usually not suitable for quantile classification because only a fewclassification because only a few places are highly populated.places are highly populated. • One can overcome this distortion byOne can overcome this distortion by increasing the number of classes.increasing the number of classes. • Quantiles are best suited for data thatQuantiles are best suited for data that is linearly distributedis linearly distributed
  • 7.
    Equal AreaEqual Area    Thismethod classifiesThis method classifies polygon features by findingpolygon features by finding breakpoints so that the totalbreakpoints so that the total area of the polygons in eacharea of the polygons in each class is the approximately theclass is the approximately the same.same.
  • 8.
    • Classes determinedwith theClasses determined with the equal area method are typicallyequal area method are typically very similar to Quantile classesvery similar to Quantile classes when the sizes of all the featureswhen the sizes of all the features are roughly the same.are roughly the same. • Equal Area will differ fromEqual Area will differ from Quantile if the features are ofQuantile if the features are of vastly different areas.vastly different areas.
  • 9.
    Standard DeviationsStandard Deviations    Inthis method, the mean valueIn this method, the mean value is found and then class breaksis found and then class breaks above and below the mean atabove and below the mean at intervals of either 1/4, 1/2, or 1intervals of either 1/4, 1/2, or 1 standard deviations are placedstandard deviations are placed until all the data values areuntil all the data values are contained within the classes.contained within the classes.
  • 10.
    Further, values areaggregatedFurther, values are aggregated those are beyond three standardthose are beyond three standard deviations from the mean into twodeviations from the mean into two classes, greater than threeclasses, greater than three standard deviations above thestandard deviations above the mean ("> 3 Std Dev.") and lessmean ("> 3 Std Dev.") and less than three standard deviationsthan three standard deviations below the mean ("< -3 Std. Dev.").below the mean ("< -3 Std. Dev.").
  • 11.
    • This isa classification scheme whereThis is a classification scheme where the class breaks are based on classthe class breaks are based on class intervals that have a geometricalintervals that have a geometrical series.series. Geometrical intervalGeometrical interval
  • 12.
    • The geometriccoefficient in thisThe geometric coefficient in this classifier can change once (to itsclassifier can change once (to its inverse) to optimize the classinverse) to optimize the class ranges.ranges. • The algorithm creates theseThe algorithm creates these geometrical intervals bygeometrical intervals by minimizing the square sum ofminimizing the square sum of element per class.element per class.
  • 13.
    • This ensuresthat each class range hasThis ensures that each class range has approximately the same number ofapproximately the same number of values with each class and that thevalues with each class and that the change between intervals is fairlychange between intervals is fairly consistent.consistent. • This algorithm was specifically designedThis algorithm was specifically designed to accommodate continuous datato accommodate continuous data • It produces a result that is visuallyIt produces a result that is visually appealing and cartographicallyappealing and cartographically comprehensive.comprehensive.
  • 14.
    • It minimizesvariance withinIt minimizes variance within classes, and can even workclasses, and can even work reasonably well on data that is notreasonably well on data that is not normally distributed.normally distributed. • This classification method is alsoThis classification method is also called Smart Quantilescalled Smart Quantiles
  • 15.
    Equal intervalEqual intervalQuantileQuantile Natural breaks (Jenks)Natural breaks (Jenks) Geometrical intervalGeometrical interval Standard deviationStandard deviation
  • 16.
    ManuallyManually classification isclassification is doneto emphasizedone to emphasize a particular rangea particular range of values, such asof values, such as those above orthose above or below a thresholdbelow a threshold value.value. Manual ClassificationManual Classification For example, one may want to emphasizeFor example, one may want to emphasize areas below a certain elevation level thatareas below a certain elevation level that are susceptible to flooding.are susceptible to flooding.
  • 17.
    LATUR BID PUNE NASHIK DHULE AKOLA SOLAPUR THANE SATARA YAVATMAL NANDED JALGAON JALNA NAGPUR AMRAVATI AHMADNAGAR GADCHIROLI SANGLI PARBHANI BULDANA BHANDARA CHANDRAPUR RATNAGIRI RAIGARH AURANGABAD KOLHAPUR WARDHA OSMANABAD SINDHUDURG Rural Houses (%) 0- 10 10 - 20 20 - 30 30 - 40 40 - 50 50 - 60 60 - 70 70 - 80 80 - 90 90 - 100 0 50 100 150 Kilometers MAHARASTRA (District classification based on Rural Houses Percentage)
  • 18.
    …there has beenlot of discussion about Latur Earthquake…. Why there is not much discussion about Jabalpur?
  • 19.
    JABALPUR KHARGON KHANDAWA Rural Houses (%) 0- 10 10 - 20 20 - 30 30 - 40 40 - 50 50 - 60 60 - 70 70 - 80 80 - 90 90 - 100 0 100 200 Kilometers MADHAYA PRADESH (District classification based on Rural Houses Percentage)
  • 21.
    DISTRICT LATUR KHARGONJABALPUR THEME RURAL POPULATION (%) 79.6 85.0 54.5 URBAN POPULATION (%) 20.4 15.0 45.5 RURAL HOUSES (%) 79.6 83.9 55.6 URBAN HOUSES (%) 20.4 16.1 44.4