Hydrology and WaterResource Management
What Do We Understand Hydrology?
“Hydor” means water
“Logos” means Science
It is the science that deals with the Occurrence, circulation and distribution of water of the
earth and earths atmosphere.
Why Study Hydrology
People study this because water is an essential ingredient for life here on the earth.
2.
Hydrology and WaterResources Management
The objective of this course is to give an easily comprehensive introduction
to hydrology and water resources.
This course give a holistic view of the water environments i.e., hydrology
seen as a water carrier in nature with human influence.
Water is a chemical union between hydrogen and oxygen.
Water is unique in the sense that it can exist in three phases at almost the
same temperature viz., solid sate (ice); liquid and gas (water vapour).
On earth, about 2/3 of the surface is covered by water and about 1/3 by
land.
Water is prerequisite of all forms of life.
A biological cell is usually made up of at least 70% water.
Human contains 55-60% water by weight (men about 60% and women
about 55%).
Water is a basic, natural resource for agriculture and industry.
3.
History of Hydrology
The first hydraulic engineers created canals, levees, dams,
subsurface water conduits and wells as early as 5000-6000
years ago.
Egyptian knew the importance of the stage measurement
of rivers, and records the stages of the Nile date back to
1800BC.
Rainfall measuring instruments were first utilized
approximately 2400 years ago by Kautilya of India.
The idea of a global hydrologic cycle dates at least 3000
years back when early Greek philosophers and poets like
Plato (400BC), Thales (650BC), and Homer (1000BC)
conceptualized the basic ideas governing this process.
4.
Leonard daVinci (1442-1519) and Bernard Palissy (1509-
1589) correctly understood the hydrological process and
they are considered as pioneers in advocating correct
hydrological principle.
In the seventh century, the modern scientific approach to
study the hydrological cycle was initiated by Pierre
Perault (1608-1680), Edme Marriott (1620-1684) and
Edmund Halley (1656-1742).
Perault observed the discharge from rivers and noticed
that it was only one-sixth of the precipitation.
Marriott made observations on the same river and
accepted Perrault’s results.
5.
Halley addedto the work of Perrault and marriott by
estimating the quantity of water involved in the hydrological
cycle of the Mediterranean sea and its surrounding lands. These
three scientists considered as founders of Hydrology.
Substantial progress was made during the 18th
century. The
term Hydrology got its current meaning around 1750.
Until 19th century, slow progress was made in the development
of hydrology.
The first half of the 20th
century saw a great advancement in
hydrological sciences starting with the addition of the section of
Scientific Hydrology in the International Union of Geodesy and
Geophysics in 1922.
6.
HYDROLOGIC CYCLE
Hydrologymeans “the science of water”. It is the
science that deals with the occurrence, circulation
and distribution of water on the earth and earth’s
atmosphere.
Hydrology is basically an applied science. To
further emphasize the degree of applicability, the
subject is sometimes classified as: (i) Scientific
hydrology- the study which is concerned chiefly
with academic aspects, (ii) Engineering or applied
hydrology- a study concerned with engineering
applications.
7.
The constantmovement of water in its three
states, Solid, Liquid and Gas, through the
biosphere is known as the hydrologic cycle.
The hydrologic cycle is the central focus of
hydrology. The cycle has no beginning or end,
and its many processes occur continuously as
shown schematically in Fig. 1.
A convenient starting point to describe the cycle
is in oceans.
9.
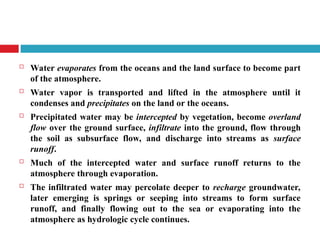
Water evaporatesfrom the oceans and the land surface to become part
of the atmosphere.
Water vapor is transported and lifted in the atmosphere until it
condenses and precipitates on the land or the oceans.
Precipitated water may be intercepted by vegetation, become overland
flow over the ground surface, infiltrate into the ground, flow through
the soil as subsurface flow, and discharge into streams as surface
runoff.
Much of the intercepted water and surface runoff returns to the
atmosphere through evaporation.
The infiltrated water may percolate deeper to recharge groundwater,
later emerging is springs or seeping into streams to form surface
runoff, and finally flowing out to the sea or evaporating into the
atmosphere as hydrologic cycle continues.
10.
Each pathof the hydrologic cycle involves one or more of
the following aspects: (i) transportation of water, (ii)
temporary storage, and (iii) change of state. For example,
(a) the process of rainfall has the change of state and
transportation, and (b) the groundwater path has storage
and transportation aspects.
The main components of the hydrologic cycle can be
broadly classified as transportation (flow) components and
storage components.
11.
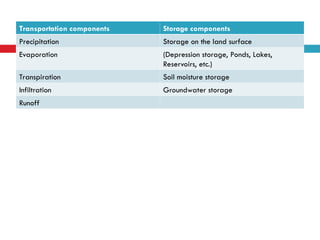
Transportation components Storagecomponents
Precipitation Storage on the land surface
Evaporation (Depression storage, Ponds, Lakes,
Reservoirs, etc.)
Transpiration Soil moisture storage
Infiltration Groundwater storage
Runoff
12.
It isimportant to note that the total water resources of the
earth are constant and the sun is the source of energy for
the hydrologic cycle.
The hydrological cycle has important influences in
agriculture, forestry, geography, economics, sociology and
political scene.
13.
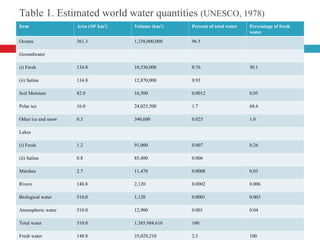
Table 1. Estimatedworld water quantities (UNESCO, 1978)
Item Area (106
km2
) Volume (km3
) Percent of total water Percentage of fresh
water
Oceans 361.3 1,338,000,000 96.5
Groundwater
(i) Fresh 134.8 10,530,000 0.76 30.1
(ii) Saline 134.8 12,870,000 0.93
Soil Moisture 82.0 16,500 0.0012 0.05
Polar ice 16.0 24,023,500 1.7 68.6
Other ice and snow 0.3 340,600 0.025 1.0
Lakes
(i) Fresh 1.2 91,000 0.007 0.26
(ii) Saline 0.8 85,400 0.006
Marshes 2.7 11,470 0.0008 0.03
Rivers 148.8 2,120 0.0002 0.006
Biological water 510,0 1,120 0.0001 0.003
Atmospheric water 510.0 12,900 0.001 0.04
Total water 510.0 1,385,984,610 100
Fresh water 148.8 35,029,210 2.5 100
14.
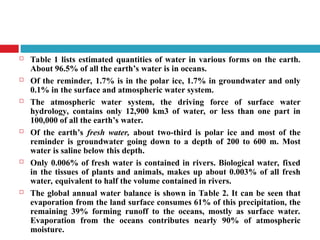
Table 1lists estimated quantities of water in various forms on the earth.
About 96.5% of all the earth’s water is in oceans.
Of the reminder, 1.7% is in the polar ice, 1.7% in groundwater and only
0.1% in the surface and atmospheric water system.
The atmospheric water system, the driving force of surface water
hydrology, contains only 12,900 km3 of water, or less than one part in
100,000 of all the earth’s water.
Of the earth’s fresh water, about two-third is polar ice and most of the
reminder is groundwater going down to a depth of 200 to 600 m. Most
water is saline below this depth.
Only 0.006% of fresh water is contained in rivers. Biological water, fixed
in the tissues of plants and animals, makes up about 0.003% of all fresh
water, equivalent to half the volume contained in rivers.
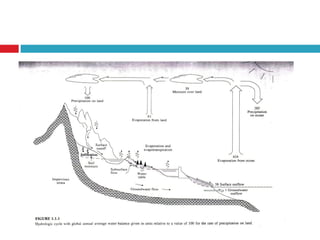
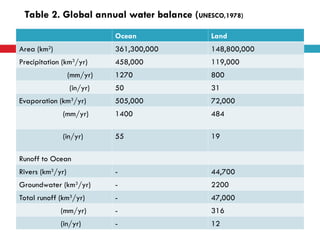
The global annual water balance is shown in Table 2. It can be seen that
evaporation from the land surface consumes 61% of this precipitation, the
remaining 39% forming runoff to the oceans, mostly as surface water.
Evaporation from the oceans contributes nearly 90% of atmospheric
moisture.
15.
Ocean Land
Area (km2
)361,300,000 148,800,000
Precipitation (km3
/yr) 458,000 119,000
(mm/yr) 1270 800
(in/yr) 50 31
Evaporation (km3
/yr) 505,000 72,000
(mm/yr) 1400 484
(in/yr) 55 19
Runoff to Ocean
Rivers (km3
/yr) - 44,700
Groundwater (km3
/yr) - 2200
Total runoff (km3
/yr) - 47,000
(mm/yr) - 316
(in/yr) - 12
Table 2. Global annual water balance (UNESCO,1978)
16.
It isseen from Table 2 that annual evaporation from the world’s
oceans and inland areas are 0.505 and 0.072 M km3
respectively. Thus,
over the oceans about 9% more water evaporates than that falls back
as precipitation.
The differential, which is estimated to be about 0.047 M km3
is the
runoff from land mass to oceans and groundwater outflow to oceans.
It is interesting to know that less than 4% of this total river flow is
used for irrigation and the rest flows down to sea.
The hydrology of a region is determined by its weather patterns and
by physical factors such as topography, geology and vegetation.
Civilization progress, human activities gradually encroach on the
natural water environment, altering the dynamic equilibrium of the
hydrologic cycle and initiating new processes and events. For example,
climate change have far-reaching effects on global hydrology.
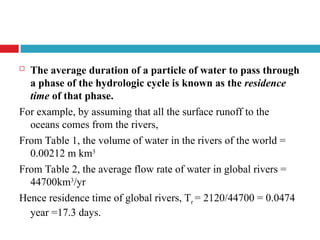
17.
The averageduration of a particle of water to pass through
a phase of the hydrologic cycle is known as the residence
time of that phase.
For example, by assuming that all the surface runoff to the
oceans comes from the rivers,
From Table 1, the volume of water in the rivers of the world =
0.00212 m km3
From Table 2, the average flow rate of water in global rivers =
44700km3
/yr
Hence residence time of global rivers, Tr = 2120/44700 = 0.0474
year =17.3 days.
18.
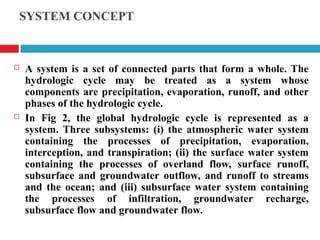
SYSTEM CONCEPT
Asystem is a set of connected parts that form a whole. The
hydrologic cycle may be treated as a system whose
components are precipitation, evaporation, runoff, and other
phases of the hydrologic cycle.
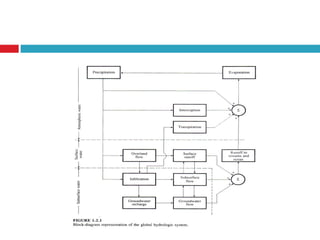
In Fig 2, the global hydrologic cycle is represented as a
system. Three subsystems: (i) the atmospheric water system
containing the processes of precipitation, evaporation,
interception, and transpiration; (ii) the surface water system
containing the processes of overland flow, surface runoff,
subsurface and groundwater outflow, and runoff to streams
and the ocean; and (iii) subsurface water system containing
the processes of infiltration, groundwater recharge,
subsurface flow and groundwater flow.
20.
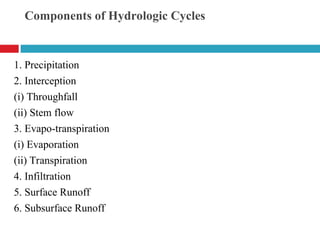
Components of HydrologicCycles
1. Precipitation
2. Interception
(i) Throughfall
(ii) Stem flow
3. Evapo-transpiration
(i) Evaporation
(ii) Transpiration
4. Infiltration
5. Surface Runoff
6. Subsurface Runoff
21.
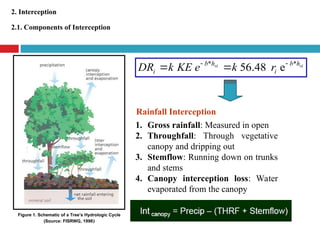
2. Interception
2.1. Componentsof Interception
1. Gross rainfall: Measured in open
2. Throughfall: Through vegetative
canopy and dripping out
3. Stemflow: Running down on trunks
and stems
4. Canopy interception loss: Water
evaporated from the canopy
Figure 1. Schematic of a Tree’s Hydrologic Cycle
(Source: FISRWG, 1998)
Rainfall Interception
si
si h
b
i
h
b
i r
k
e
KE
k
DR *
*
e
48
.
56
22.
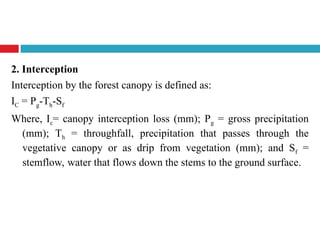
2. Interception
Interception bythe forest canopy is defined as:
IC = Pg-Th-Sf
Where, Ic= canopy interception loss (mm); Pg = gross precipitation
(mm); Th = throughfall, precipitation that passes through the
vegetative canopy or as drip from vegetation (mm); and Sf =
stemflow, water that flows down the stems to the ground surface.
23.
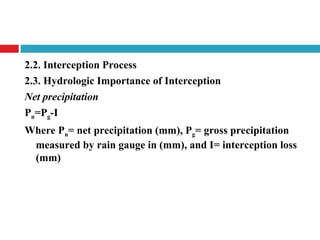
2.2. Interception Process
2.3.Hydrologic Importance of Interception
Net precipitation
Pn=Pg-I
Where Pn= net precipitation (mm), Pg= gross precipitation
measured by rain gauge in (mm), and I= interception loss
(mm)
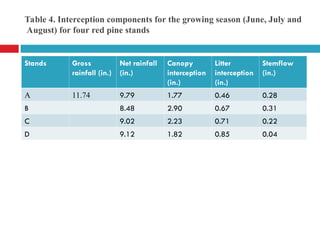
24.
Table 4. Interceptioncomponents for the growing season (June, July and
August) for four red pine stands
Stands Gross
rainfall (in.)
Net rainfall
(in.)
Canopy
interception
(in.)
Litter
interception
(in.)
Stemflow
(in.)
A 11.74 9.79 1.77 0.46 0.28
B 8.48 2.90 0.67 0.31
C 9.02 2.23 0.71 0.22
D 9.12 1.82 0.85 0.04
25.
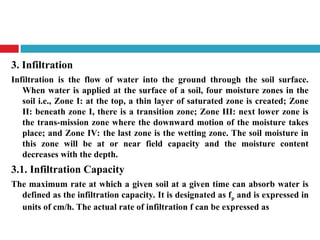
3. Infiltration
Infiltration isthe flow of water into the ground through the soil surface.
When water is applied at the surface of a soil, four moisture zones in the
soil i.e., Zone I: at the top, a thin layer of saturated zone is created; Zone
II: beneath zone I, there is a transition zone; Zone III: next lower zone is
the trans-mission zone where the downward motion of the moisture takes
place; and Zone IV: the last zone is the wetting zone. The soil moisture in
this zone will be at or near field capacity and the moisture content
decreases with the depth.
3.1. Infiltration Capacity
The maximum rate at which a given soil at a given time can absorb water is
defined as the infiltration capacity. It is designated as fp and is expressed in
units of cm/h. The actual rate of infiltration f can be expressed as
26.
f= fp wheni>fp
and f= I when i<fp
Where, i=intensity of rainfall. The infiltration capacity of a soil is
high at the beginning of a storm and has an exponential decay
as the time elapses.
The infiltration capacity of an area is dependent on a large
number of factors, chief of them are: (i) characteristics of the
soil (texture, porosity and hydraulic conductivity); (ii)
condition of the soil surface; (iii) current moisture content; (iv)
vegetative cover; and (v) soil temperature
27.
4. EVAPOTRANSPIRATION
4.1. Evaporation
Evaporationis the process in which a liquid changes to the gaseous state at the free
surface, below the boiling point through the transfer of heat energy. The rate of
evaporation is dependent on (i) the vapour pressure at the water surface and air
above, (ii) air and water temperature, (iii) wind speed, (iv) atmospheric
pressure, (v) quality of water, and (vi) size of the water body.
4.2. TRANSPIRATION
Transpiration is the process by which water leaves the body of a living plant and
reaches the atmosphere as water vapour. The water is taken up by the plant-root
system and escapes through the leaves.The important factors affecting
transpiration are: atmospheric vapour pressure, temperature, wind, light
intensity and characteristics of the plant, such as the root and leaf systems.
Transpiration is essentially confined to daylight hours and the rate of transpiration
depends upon the growth periods of the plant. Where as evaporation continues
all through the day and night although the rate are different.
28.
If sufficientmoisture is always available to completely meet the
needs of vegetation fully covering the area, the resulting
evapotranspiration is called Potential Evapotranspiration (PET).
The real evapotranspiration occurring in a specific situation is
called Actual Evapotranspiration (AET).
If the water supply to the plant is adequate, soil moisture will be at
the field capacity and AET will be equal to PET.
If the water supply is less than PET, the soil dries out and the ratio
AET/PET would then be less than unity. The decrease of the ratio
AET/PET with available moisture depends upon the type of soil
and rate of drying.
29.
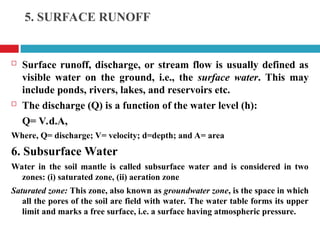
5. SURFACE RUNOFF
Surface runoff, discharge, or stream flow is usually defined as
visible water on the ground, i.e., the surface water. This may
include ponds, rivers, lakes, and reservoirs etc.
The discharge (Q) is a function of the water level (h):
Q= V.d.A,
Where, Q= discharge; V= velocity; d=depth; and A= area
6. Subsurface Water
Water in the soil mantle is called subsurface water and is considered in two
zones: (i) saturated zone, (ii) aeration zone
Saturated zone: This zone, also known as groundwater zone, is the space in which
all the pores of the soil are field with water. The water table forms its upper
limit and marks a free surface, i.e. a surface having atmospheric pressure.
30.
Zone ofAeration: In this zone the soil pores are only
partially saturated with water. The space between the land
surface and the water table marks the extent of this zone.
The zone of aeration have three subzones: (i) soil water
zone; (ii) Capillary fringe; and (iii) intermediate zone