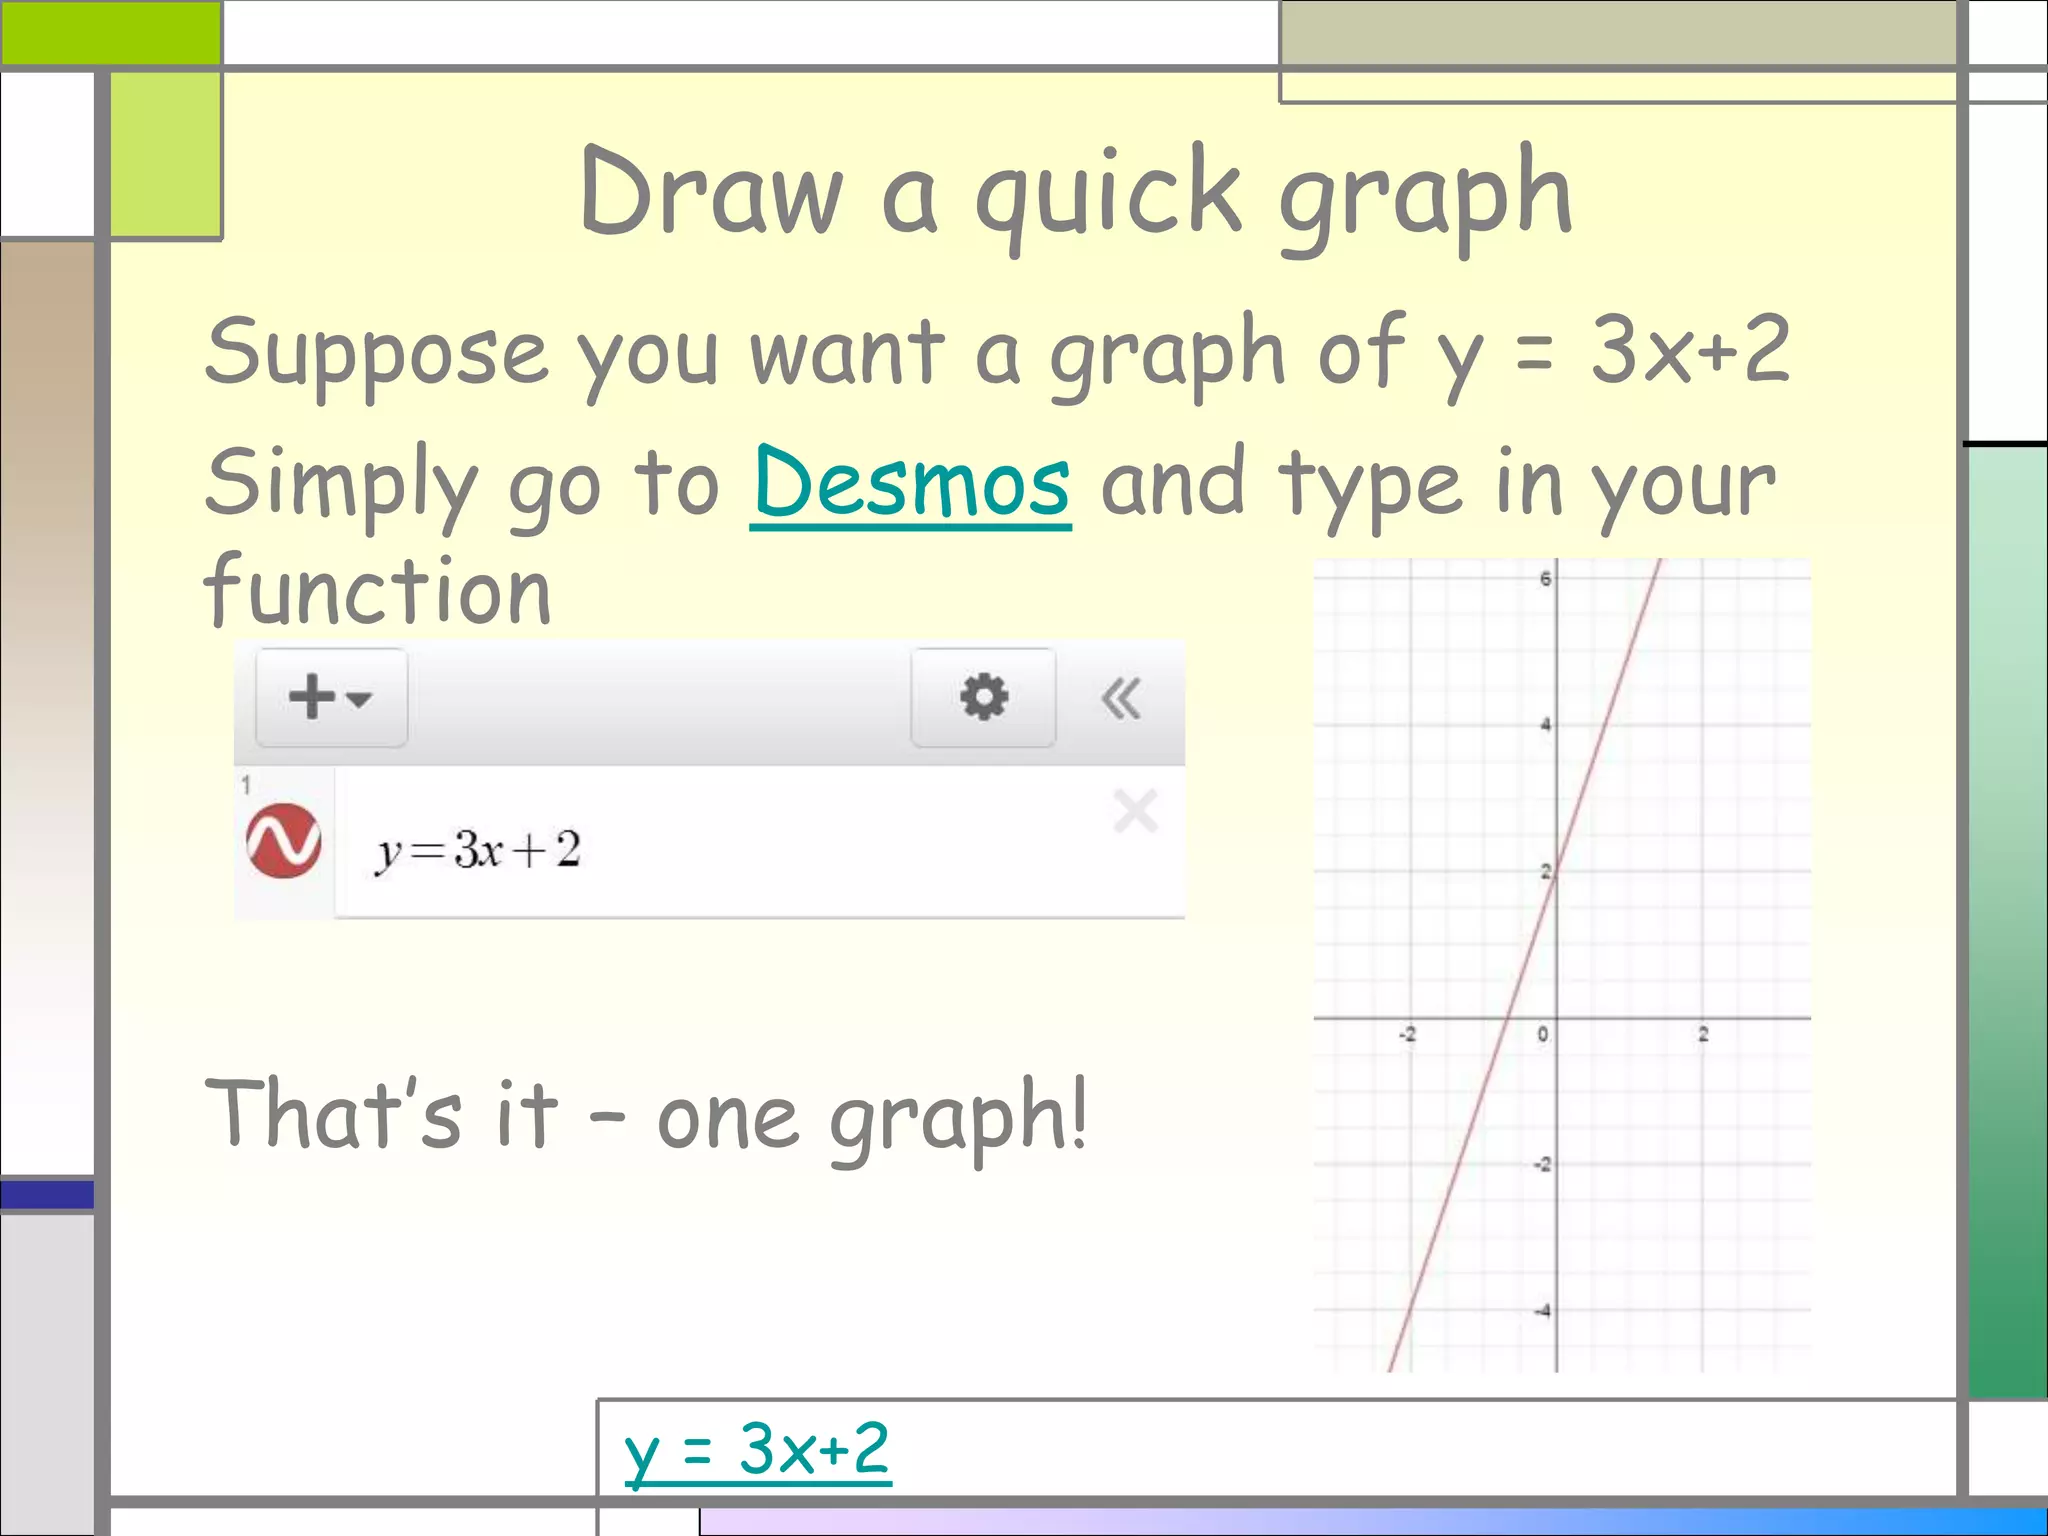
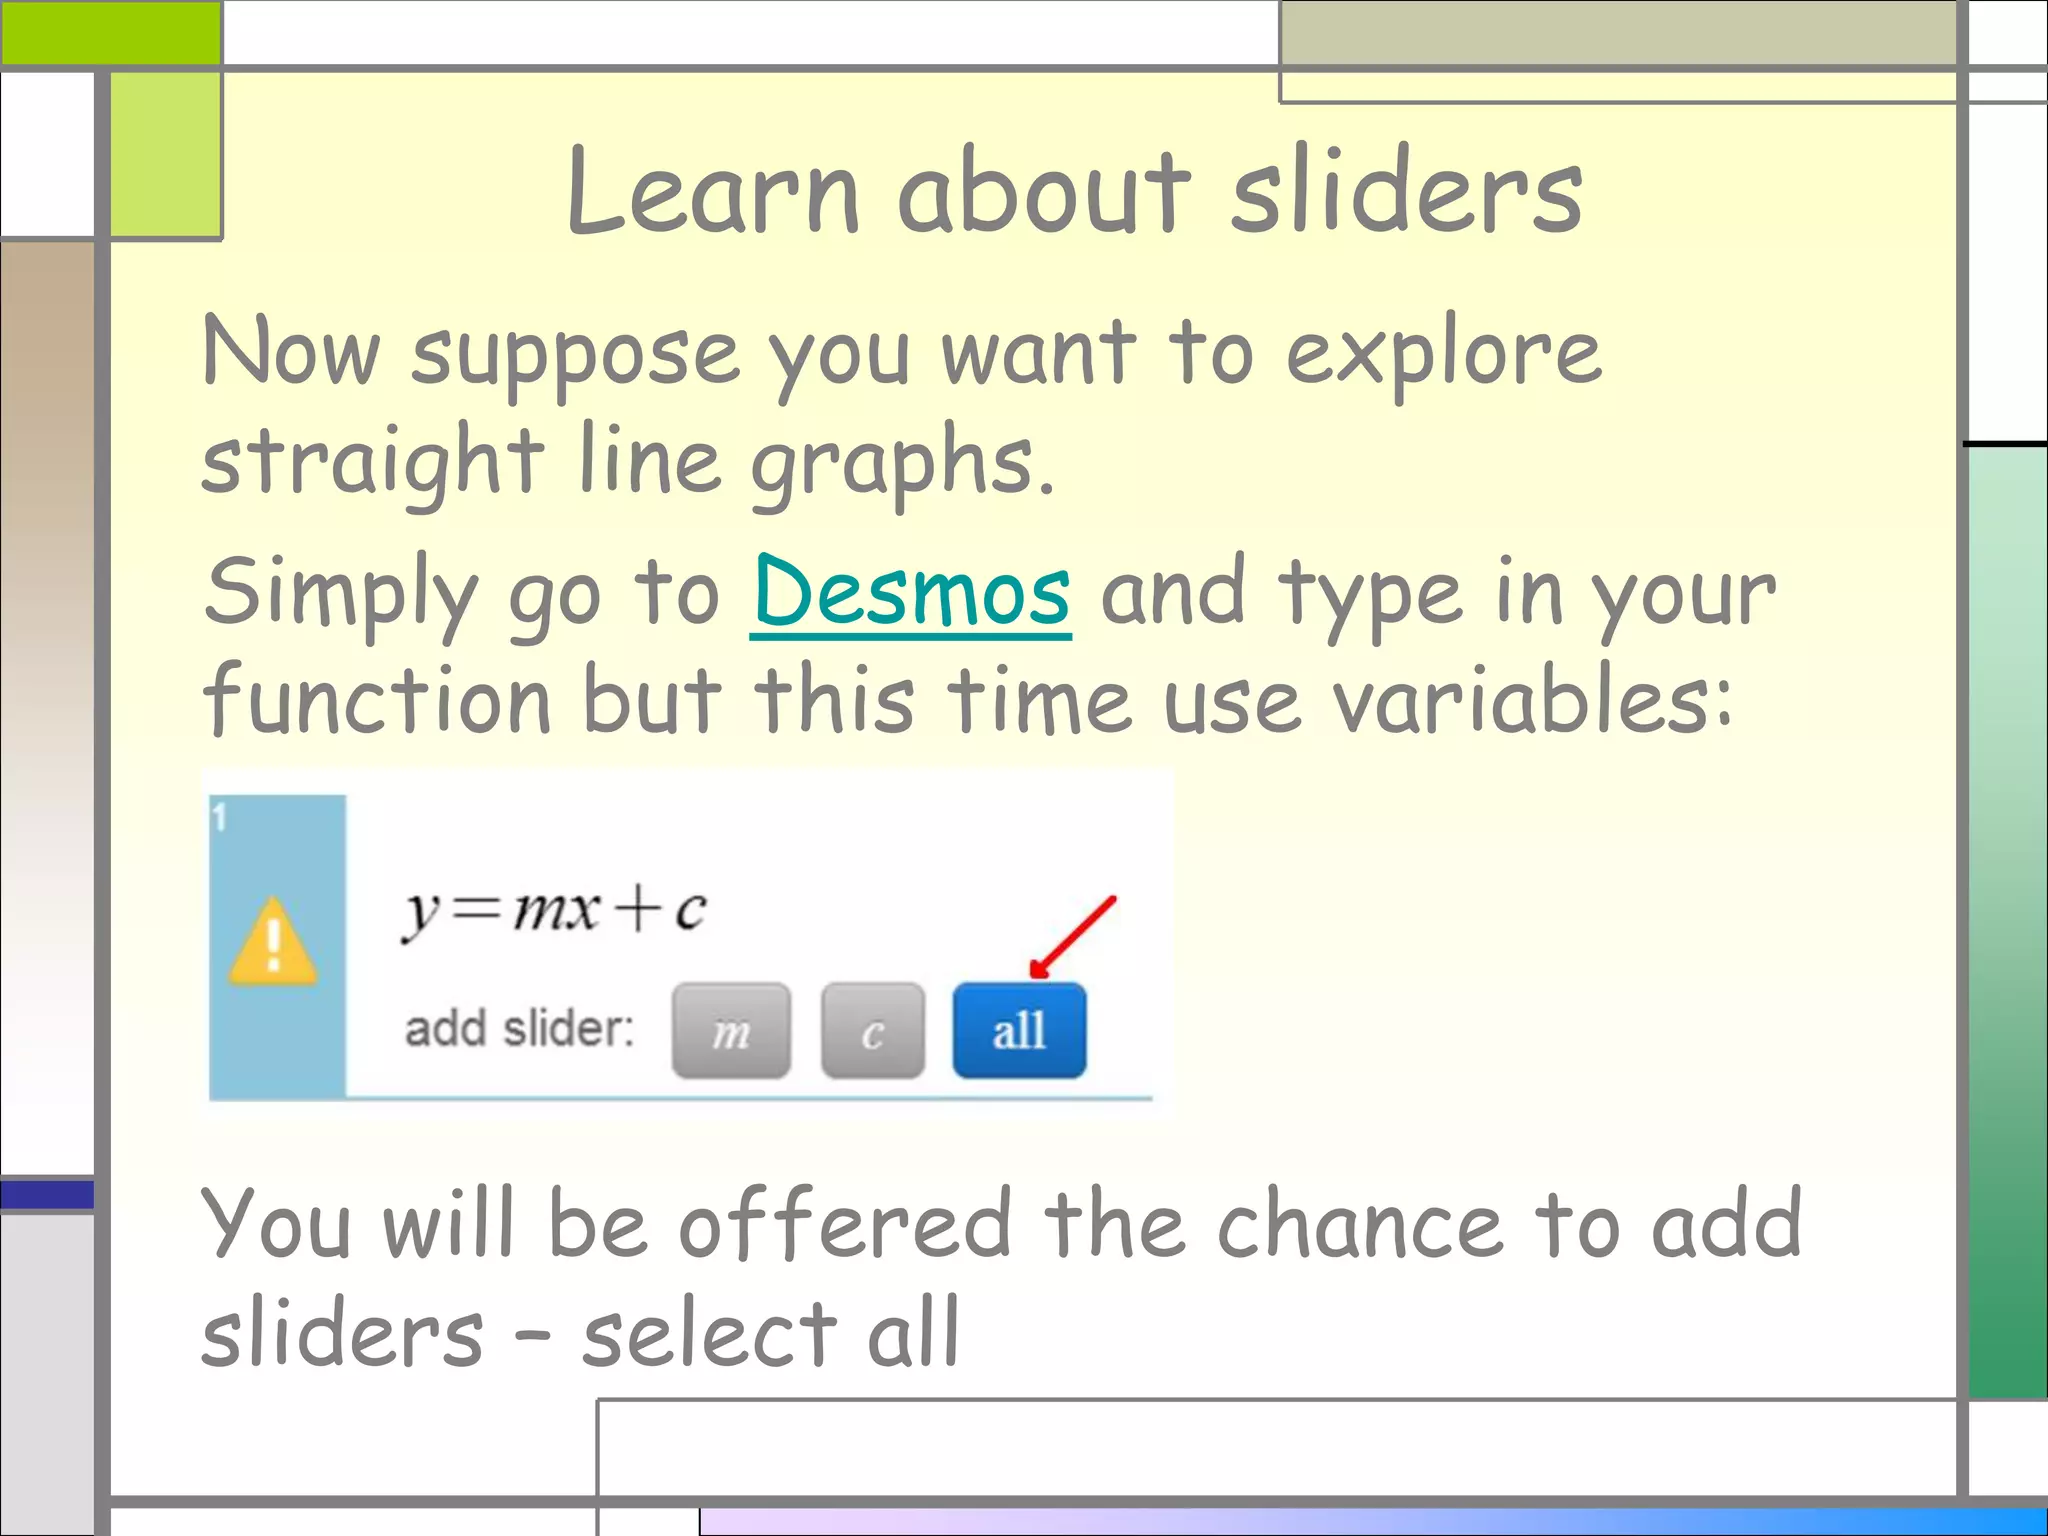
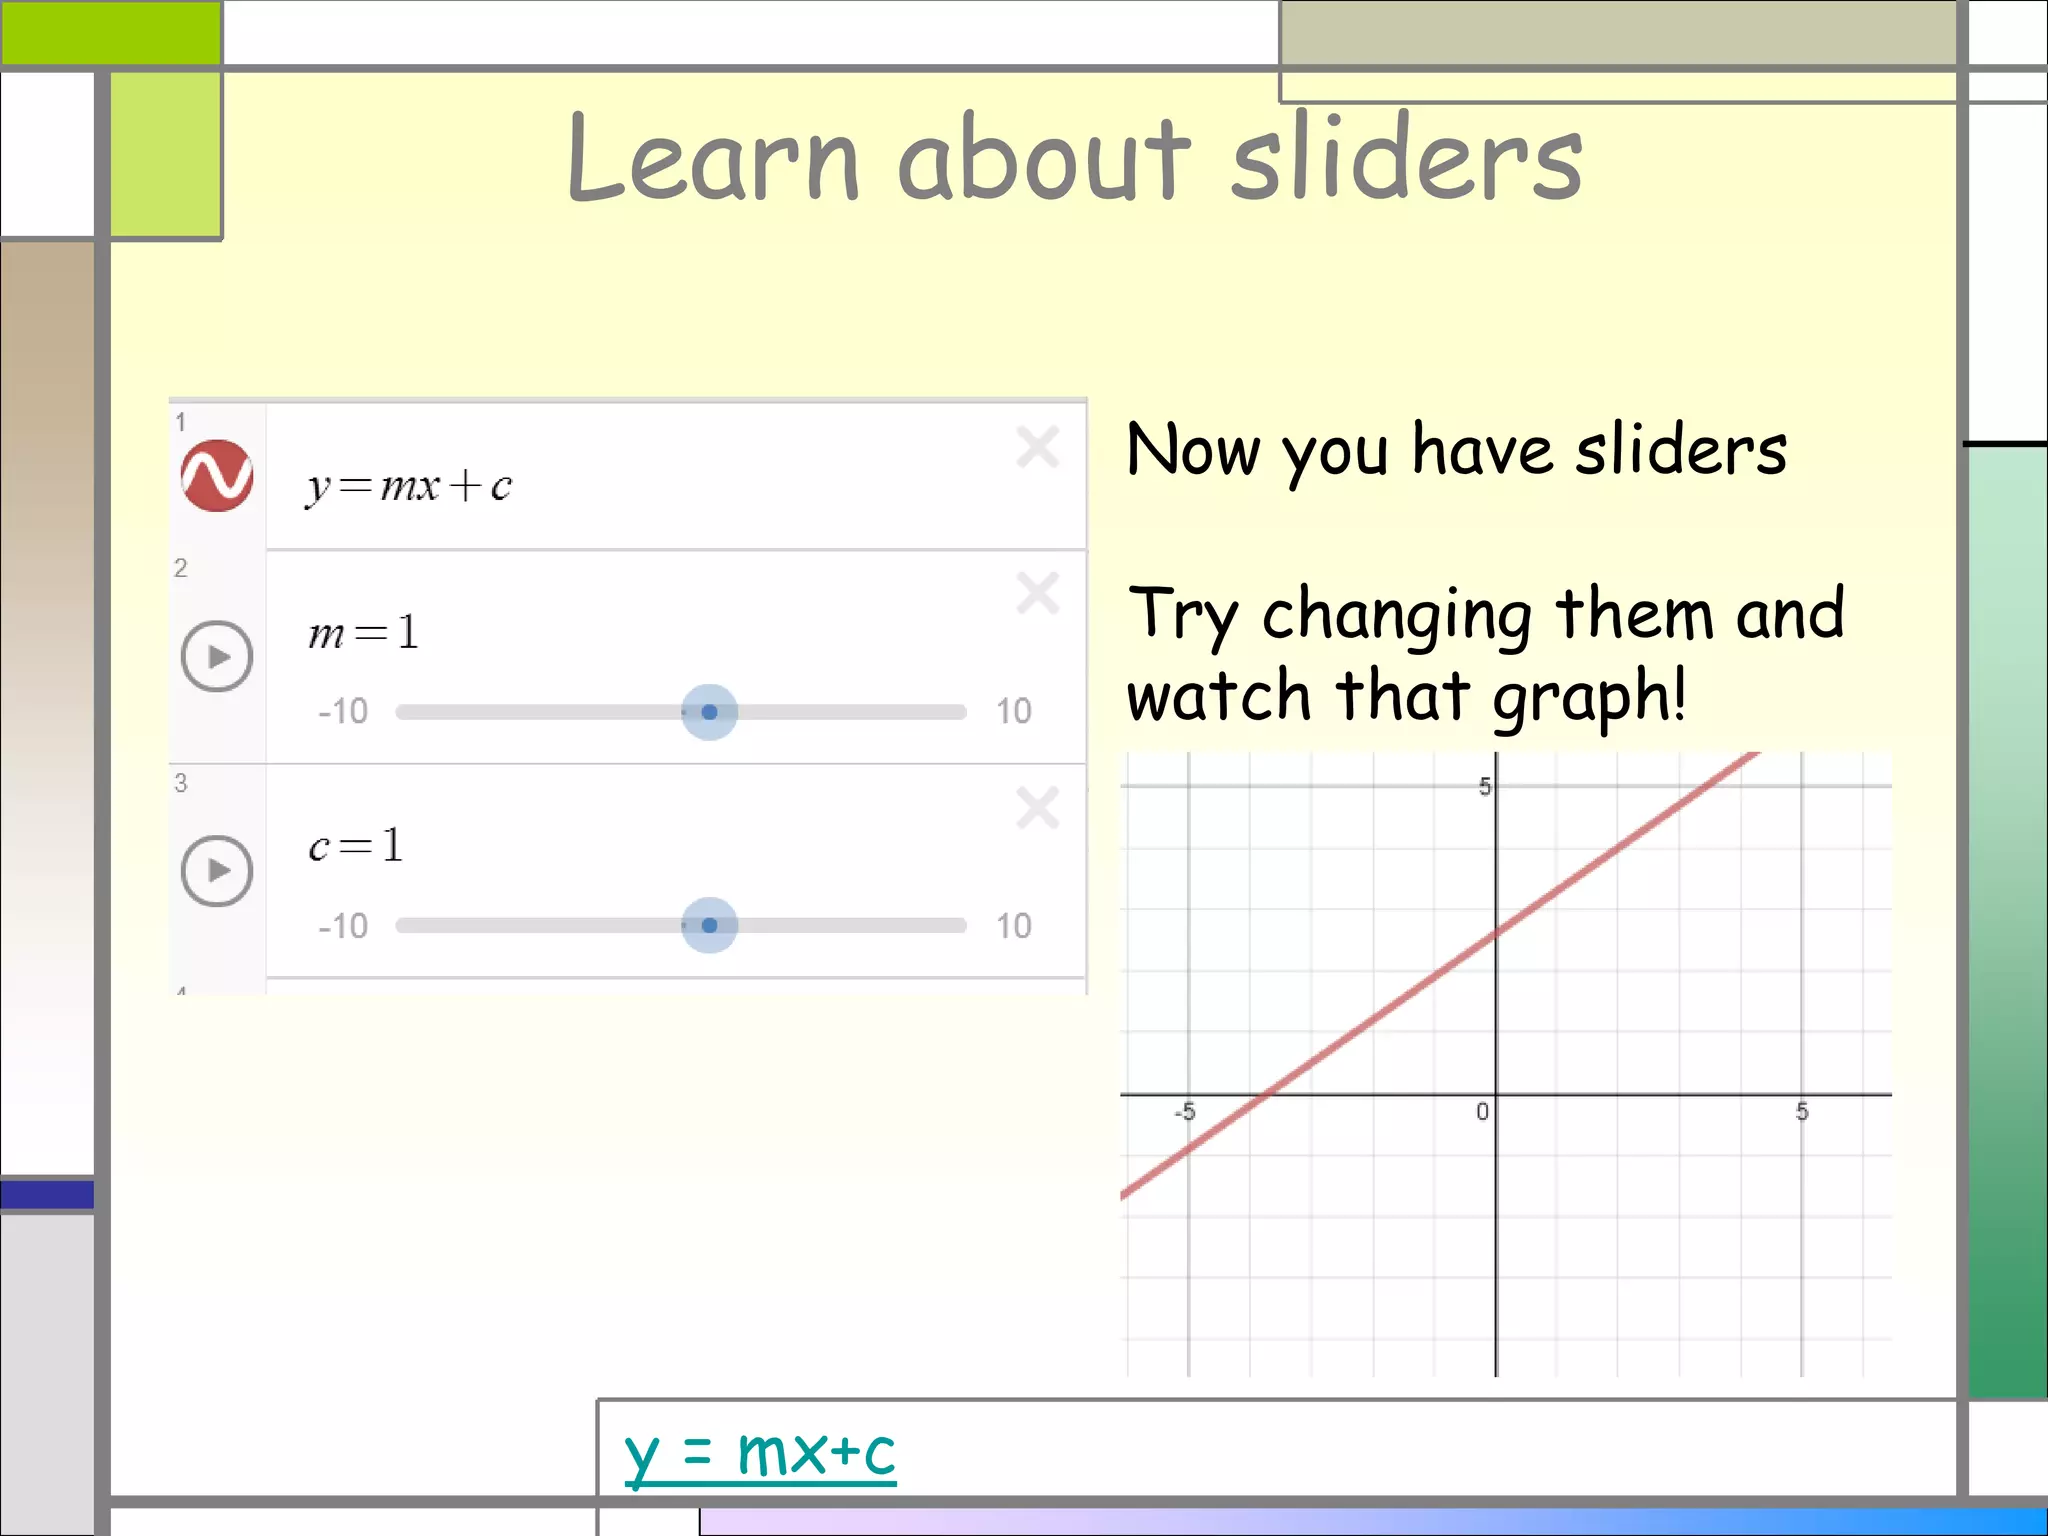
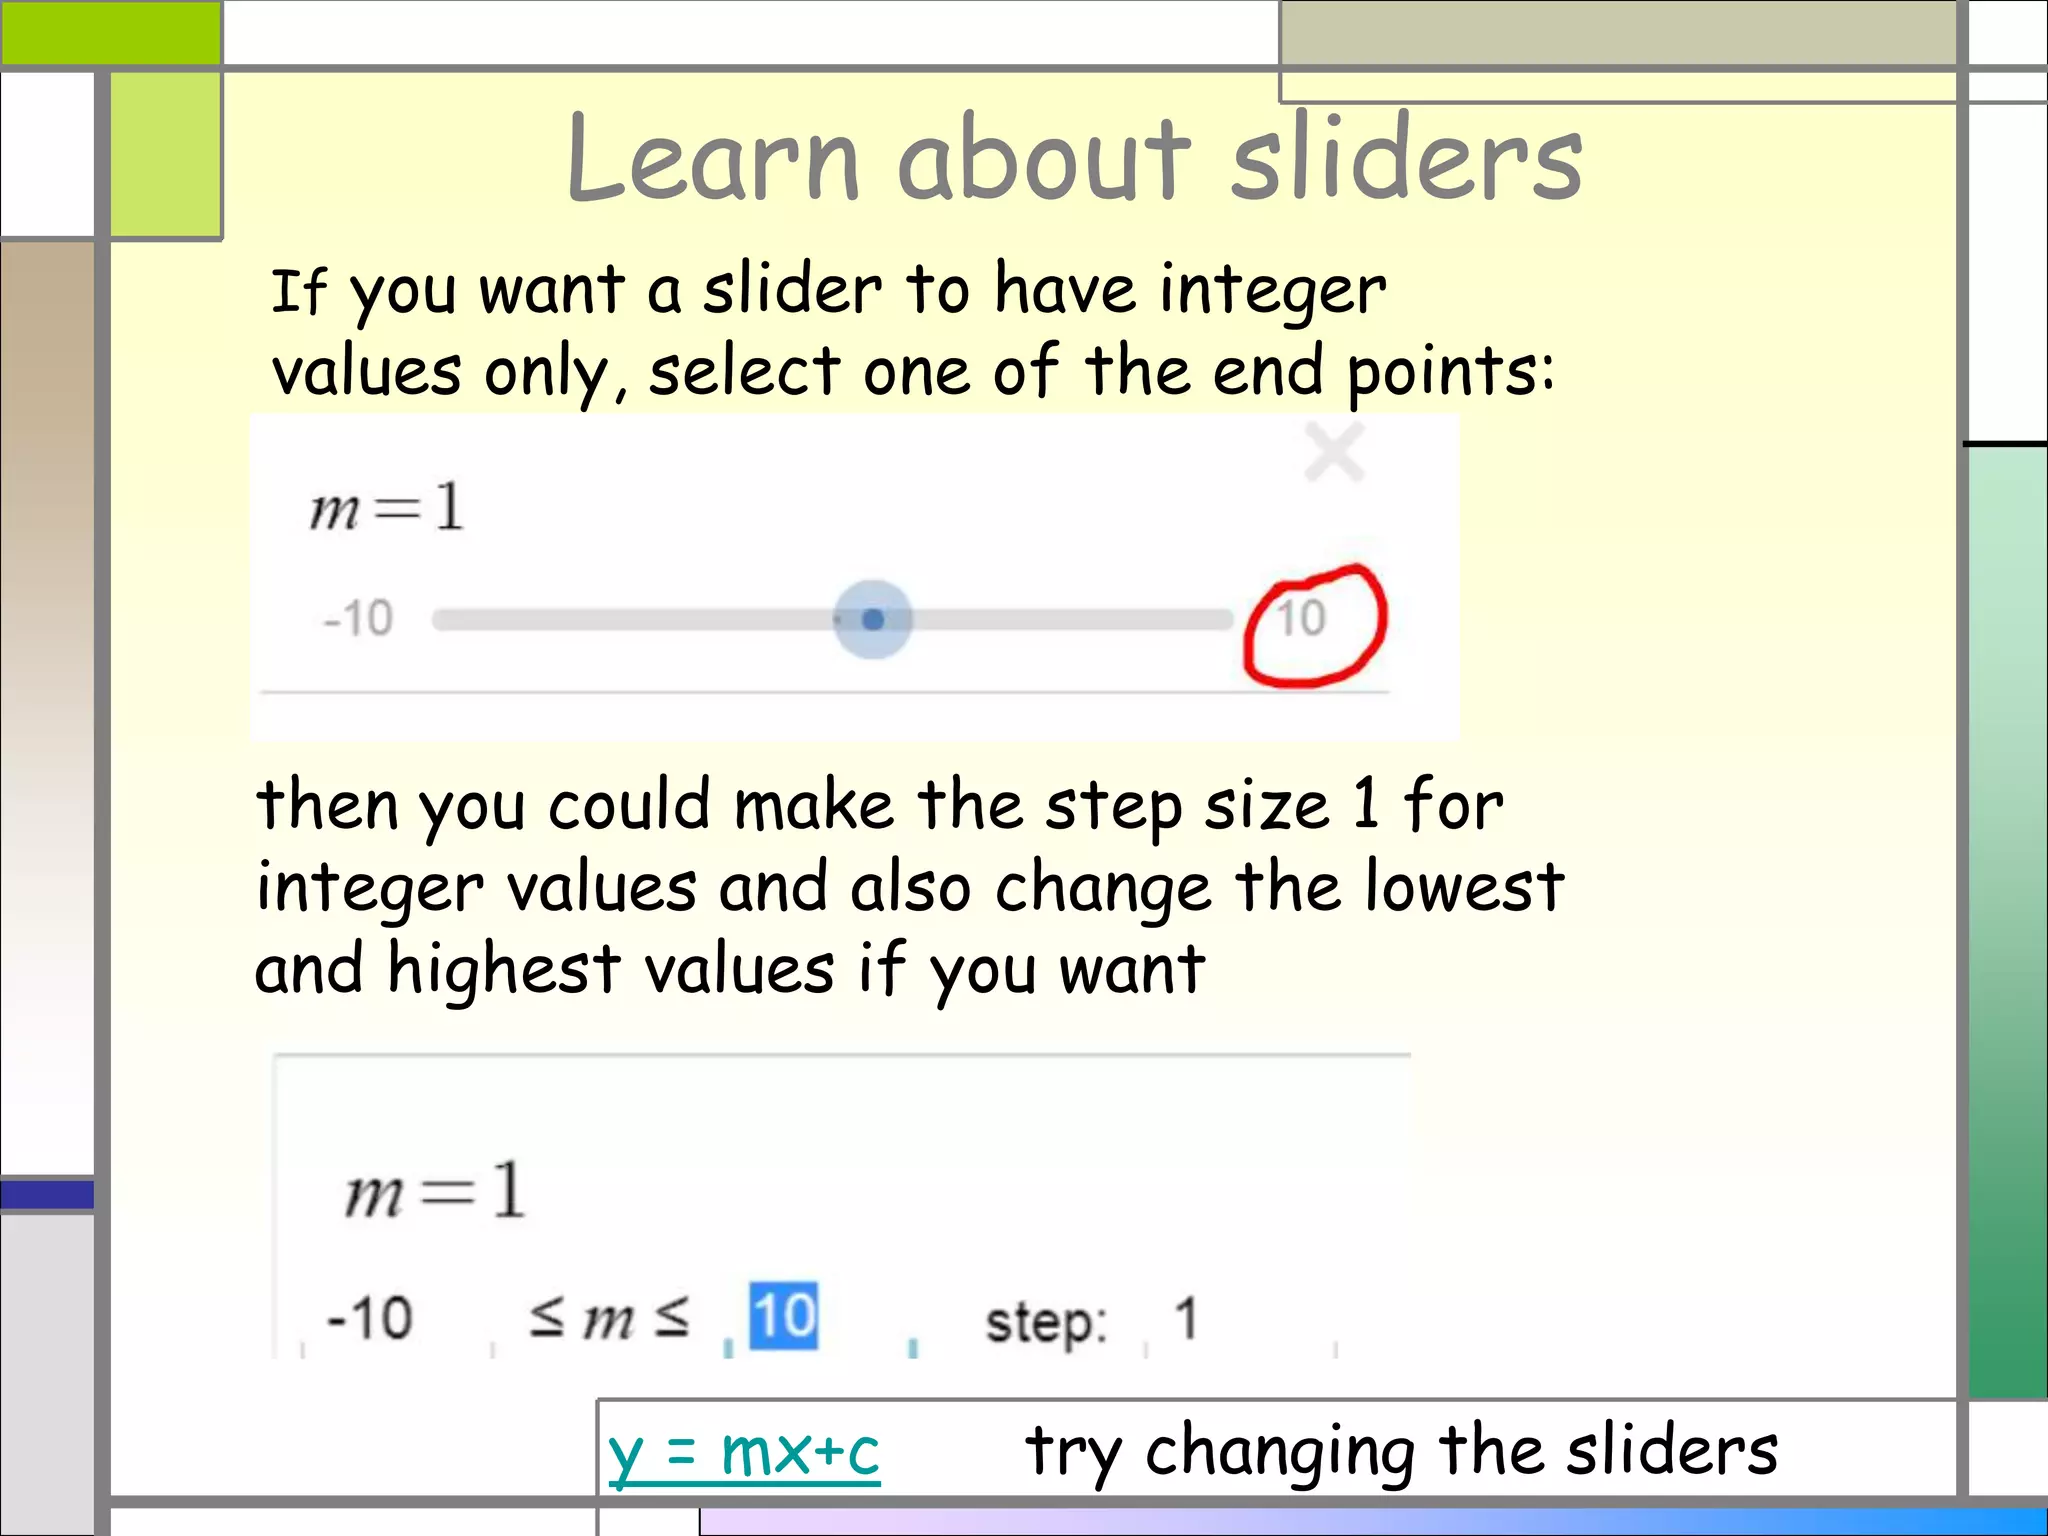
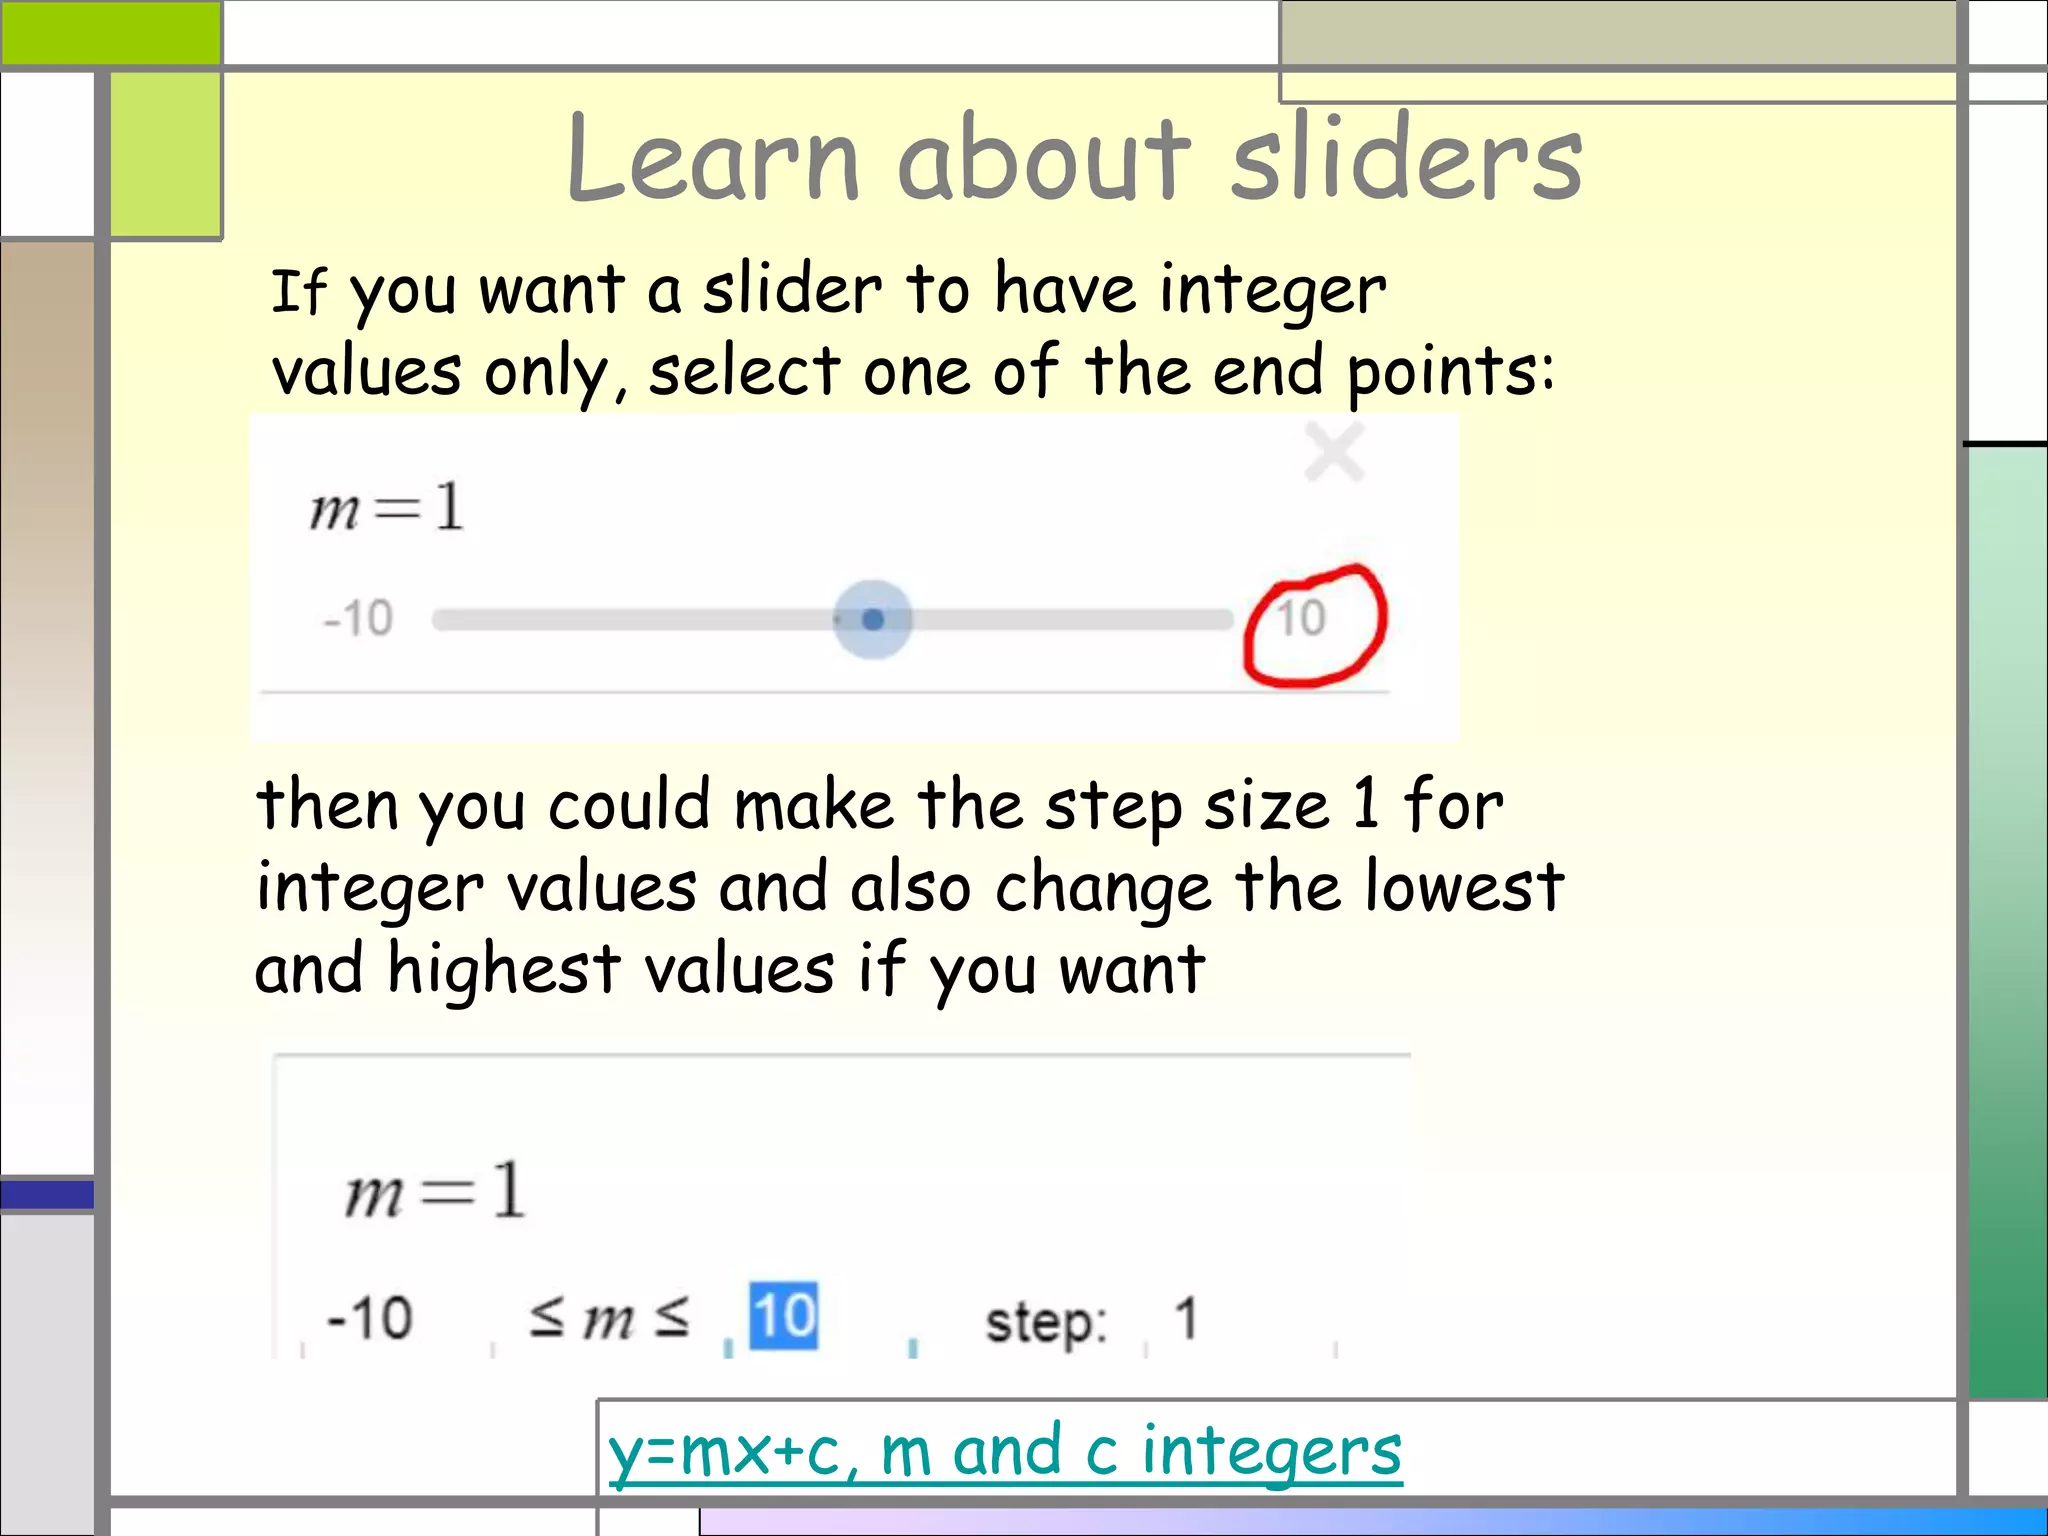
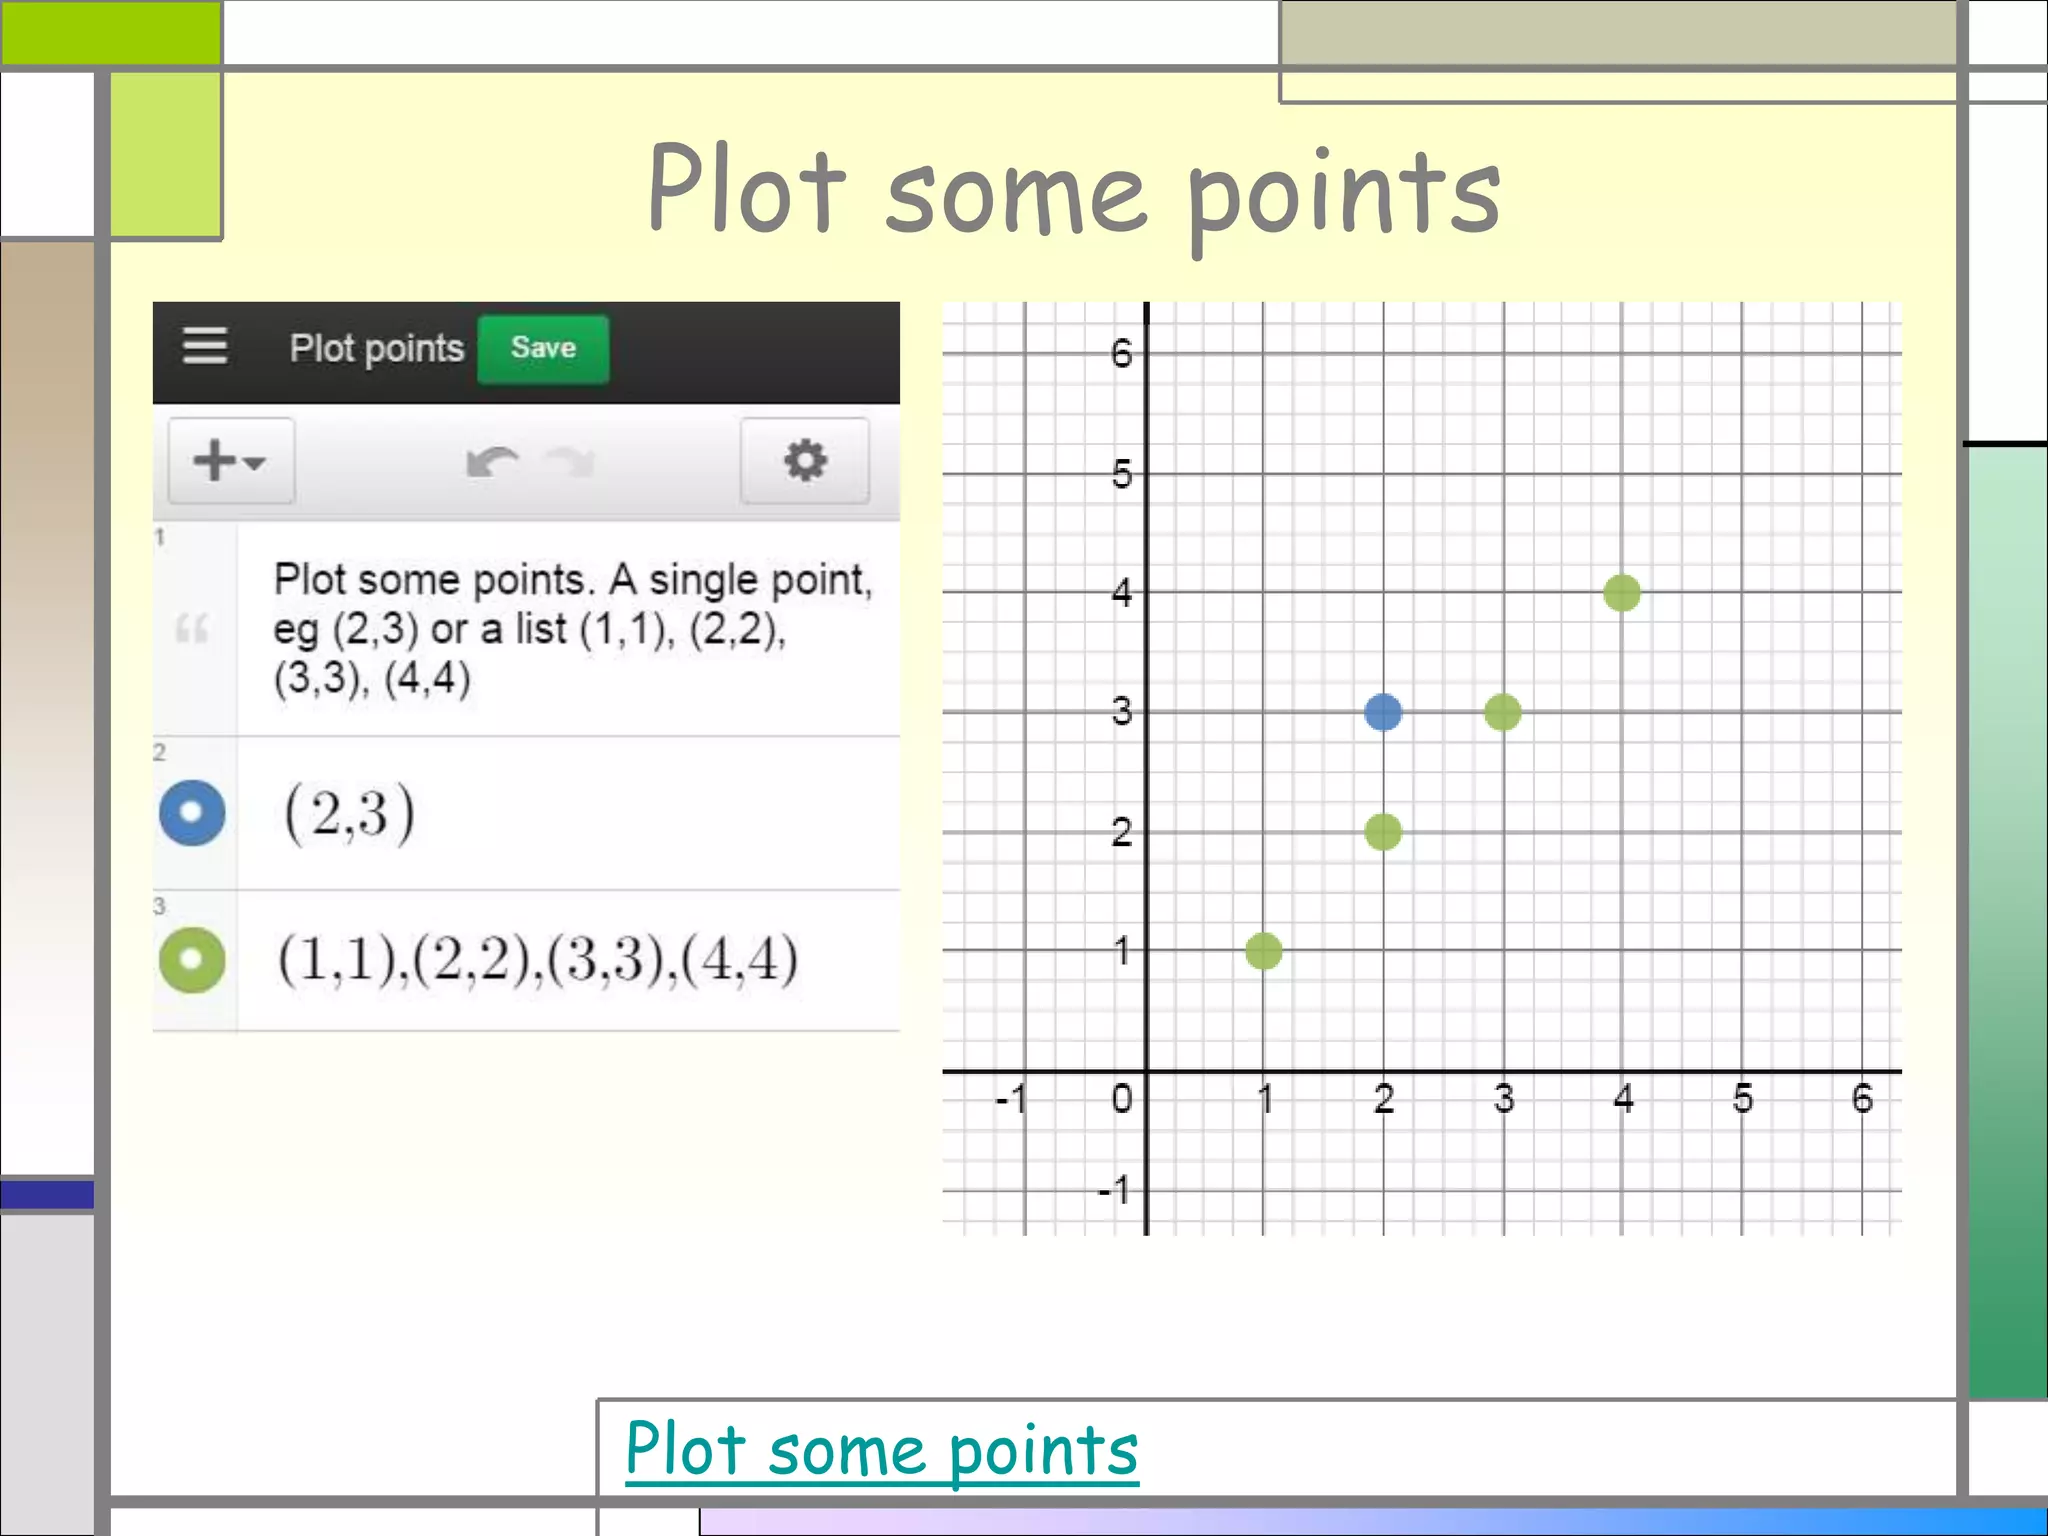
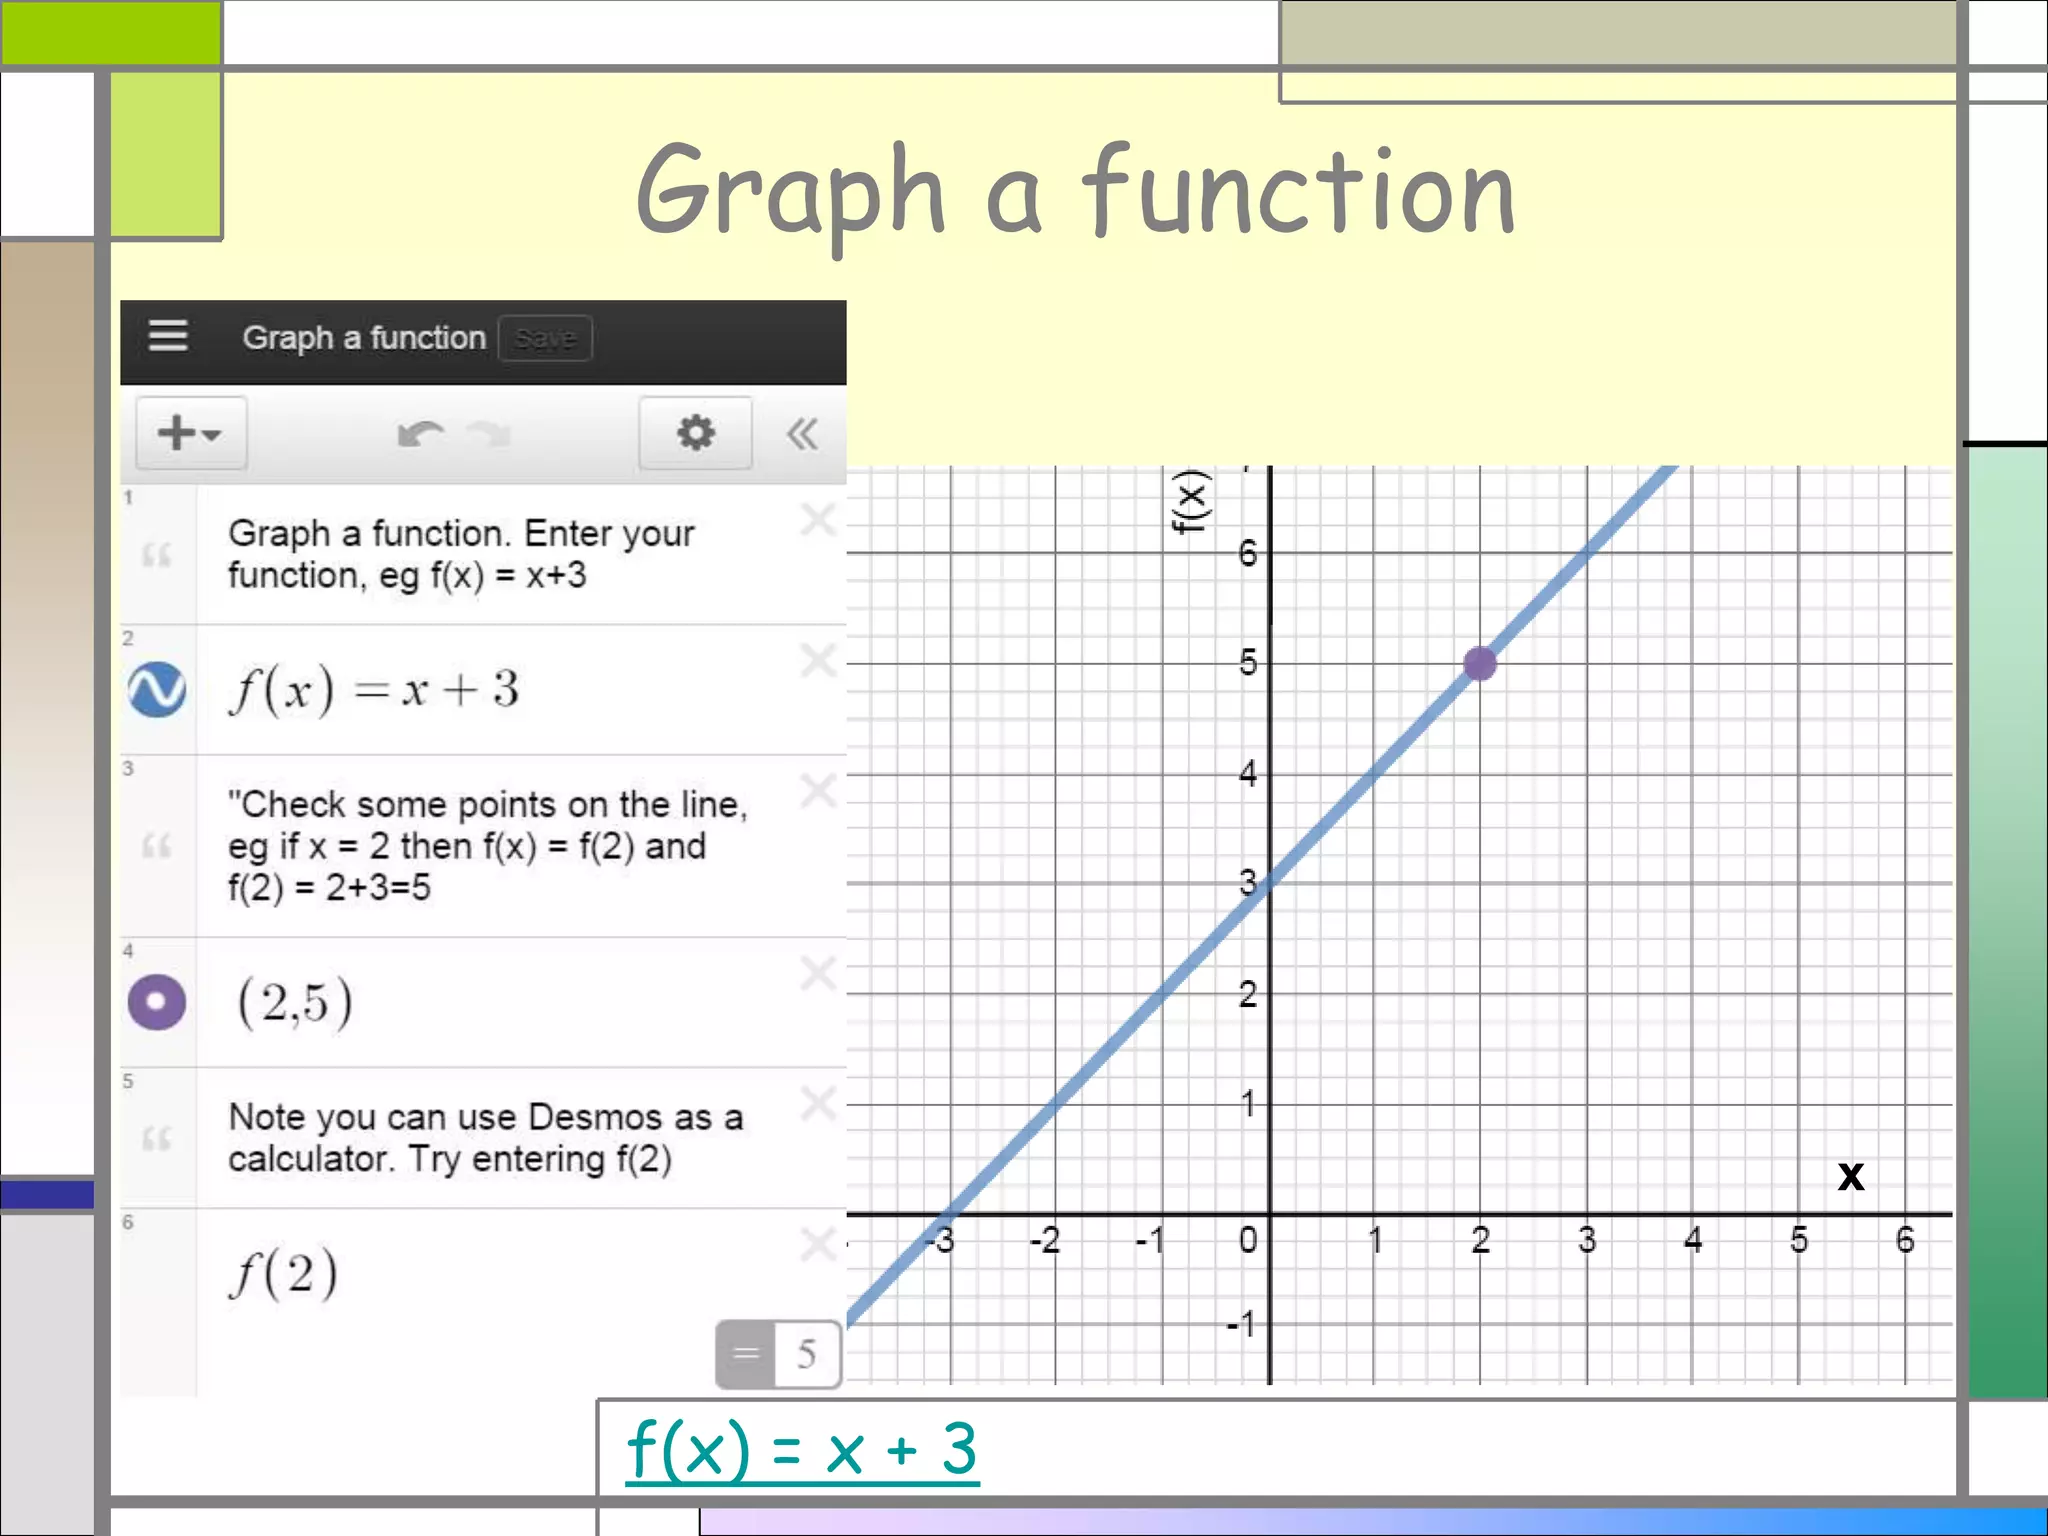
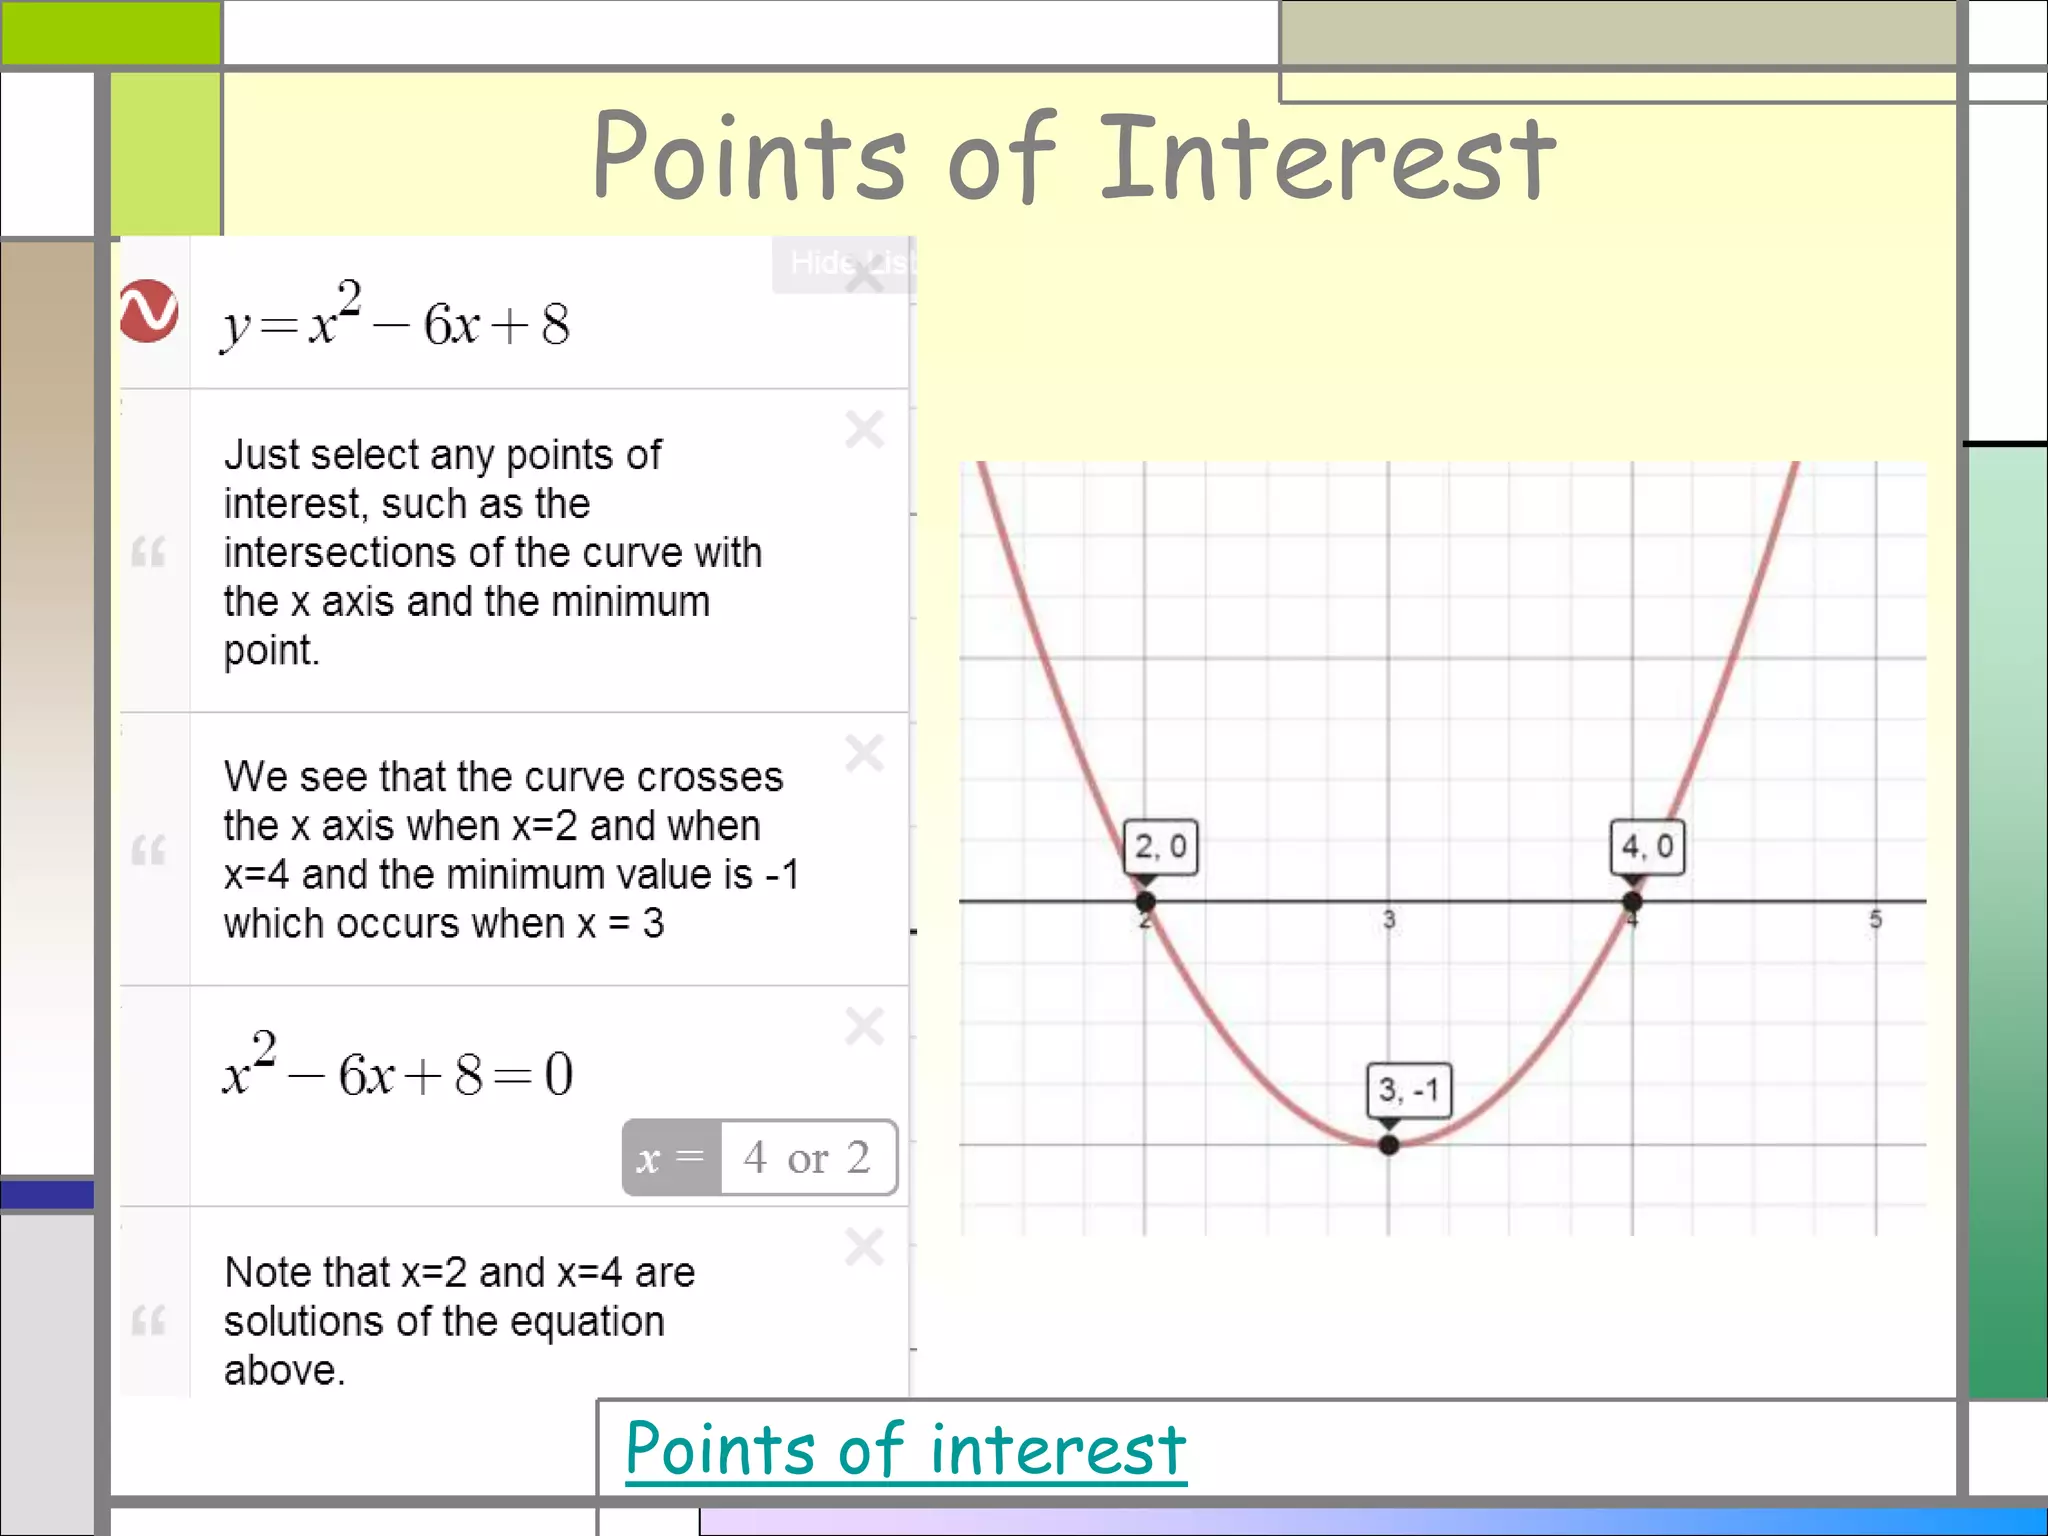
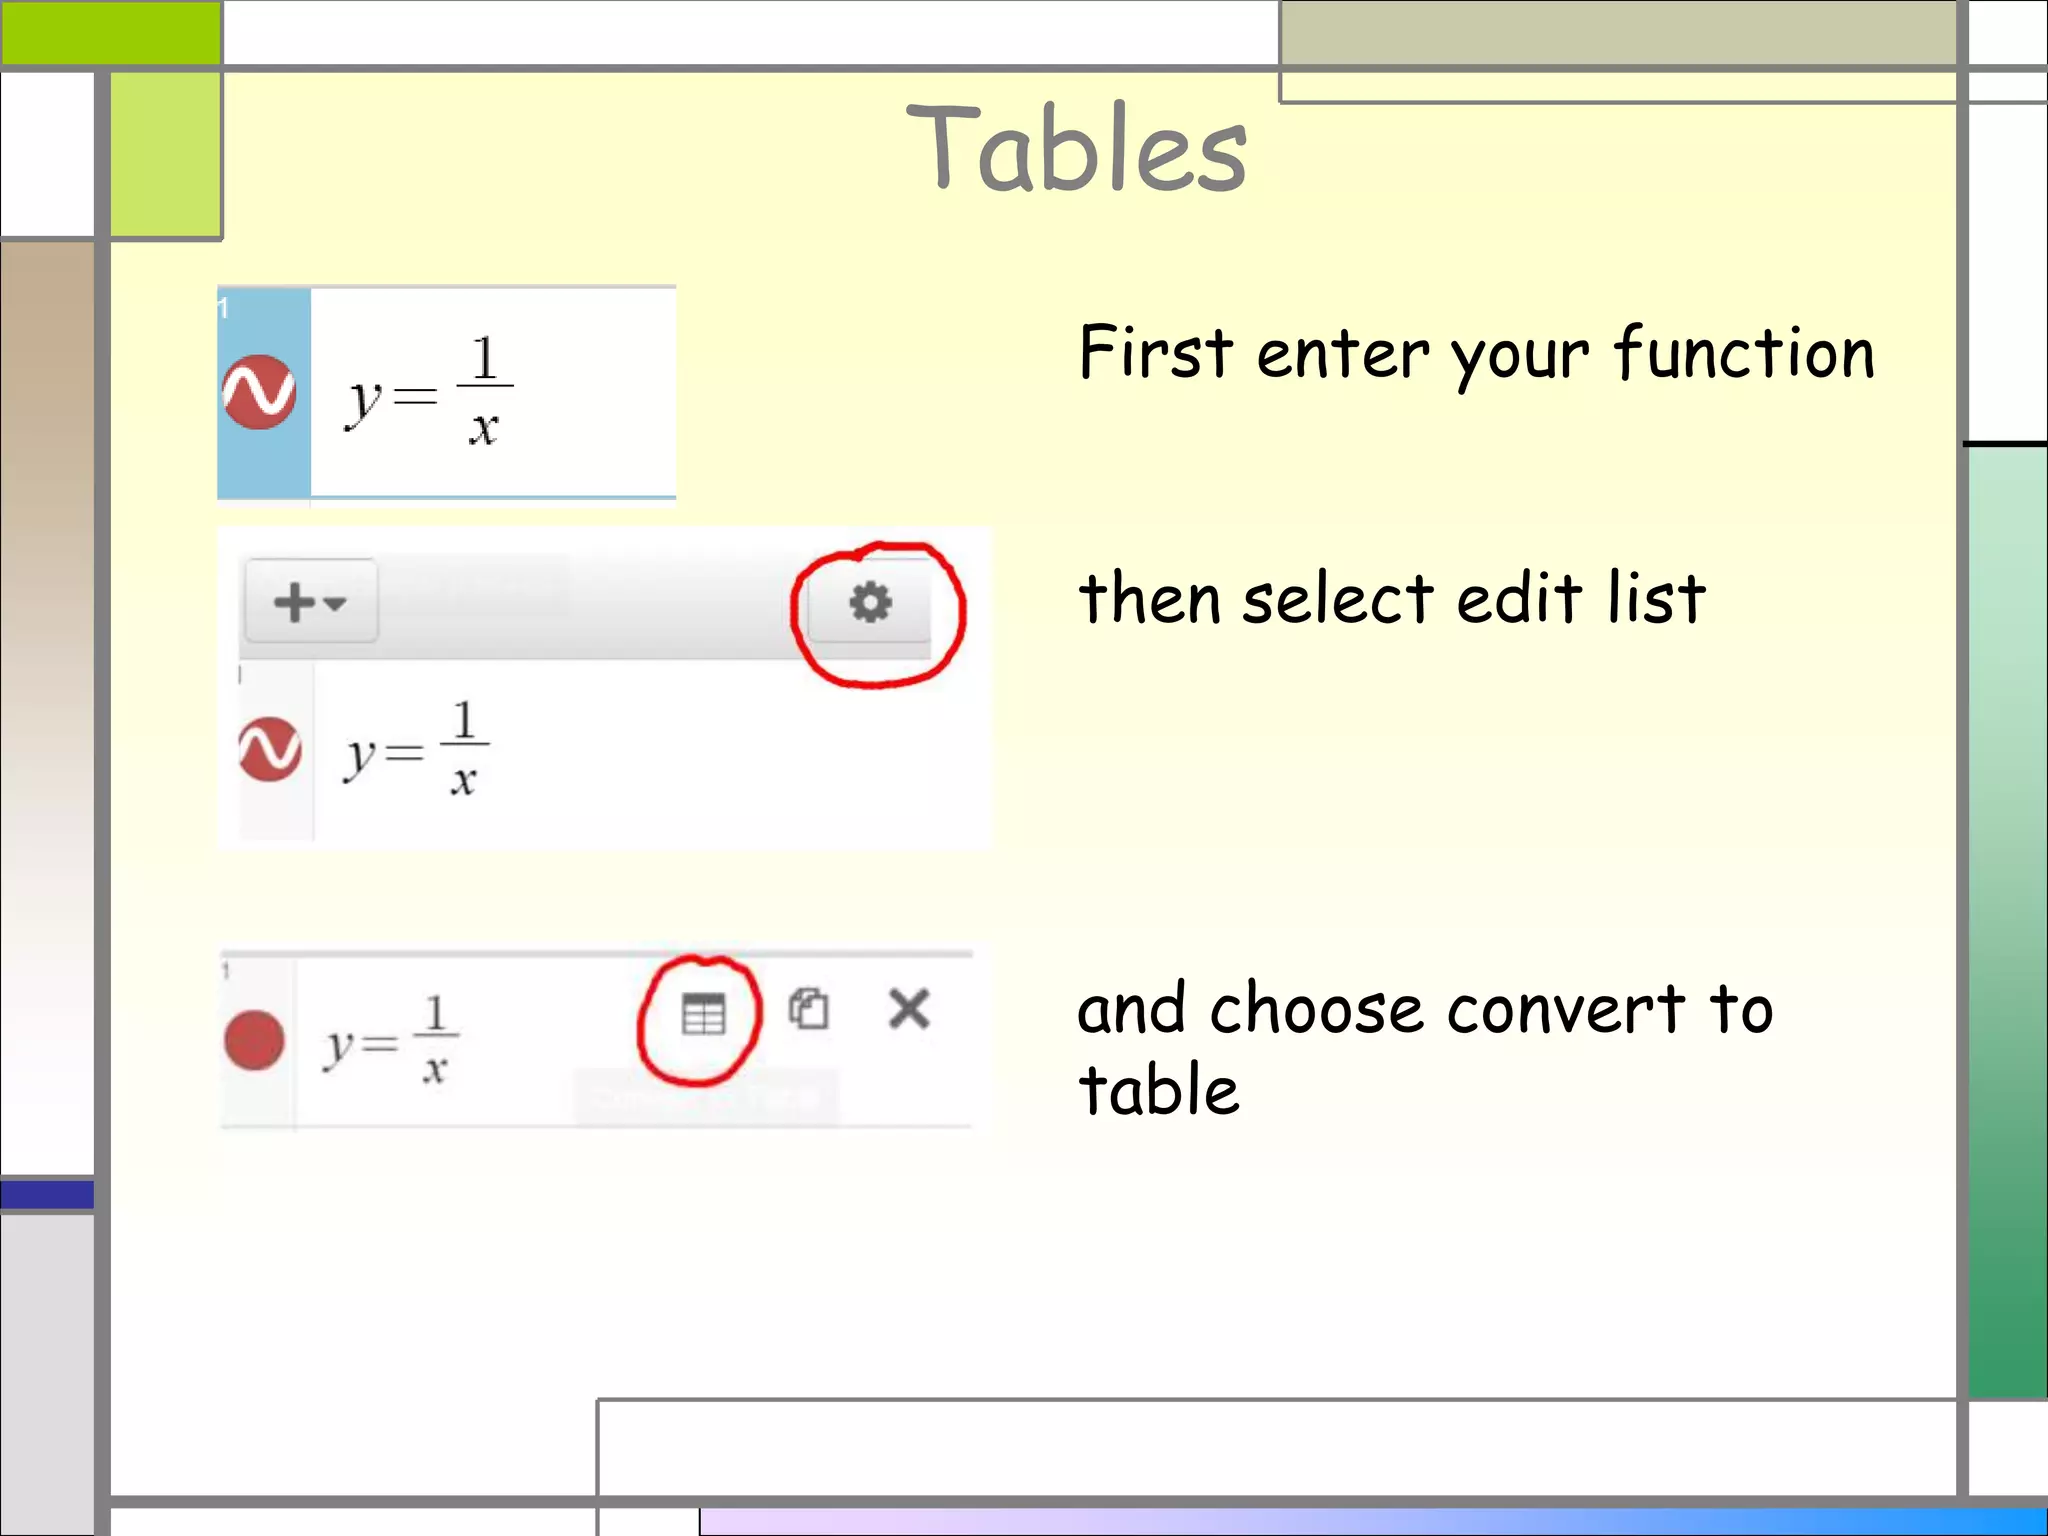
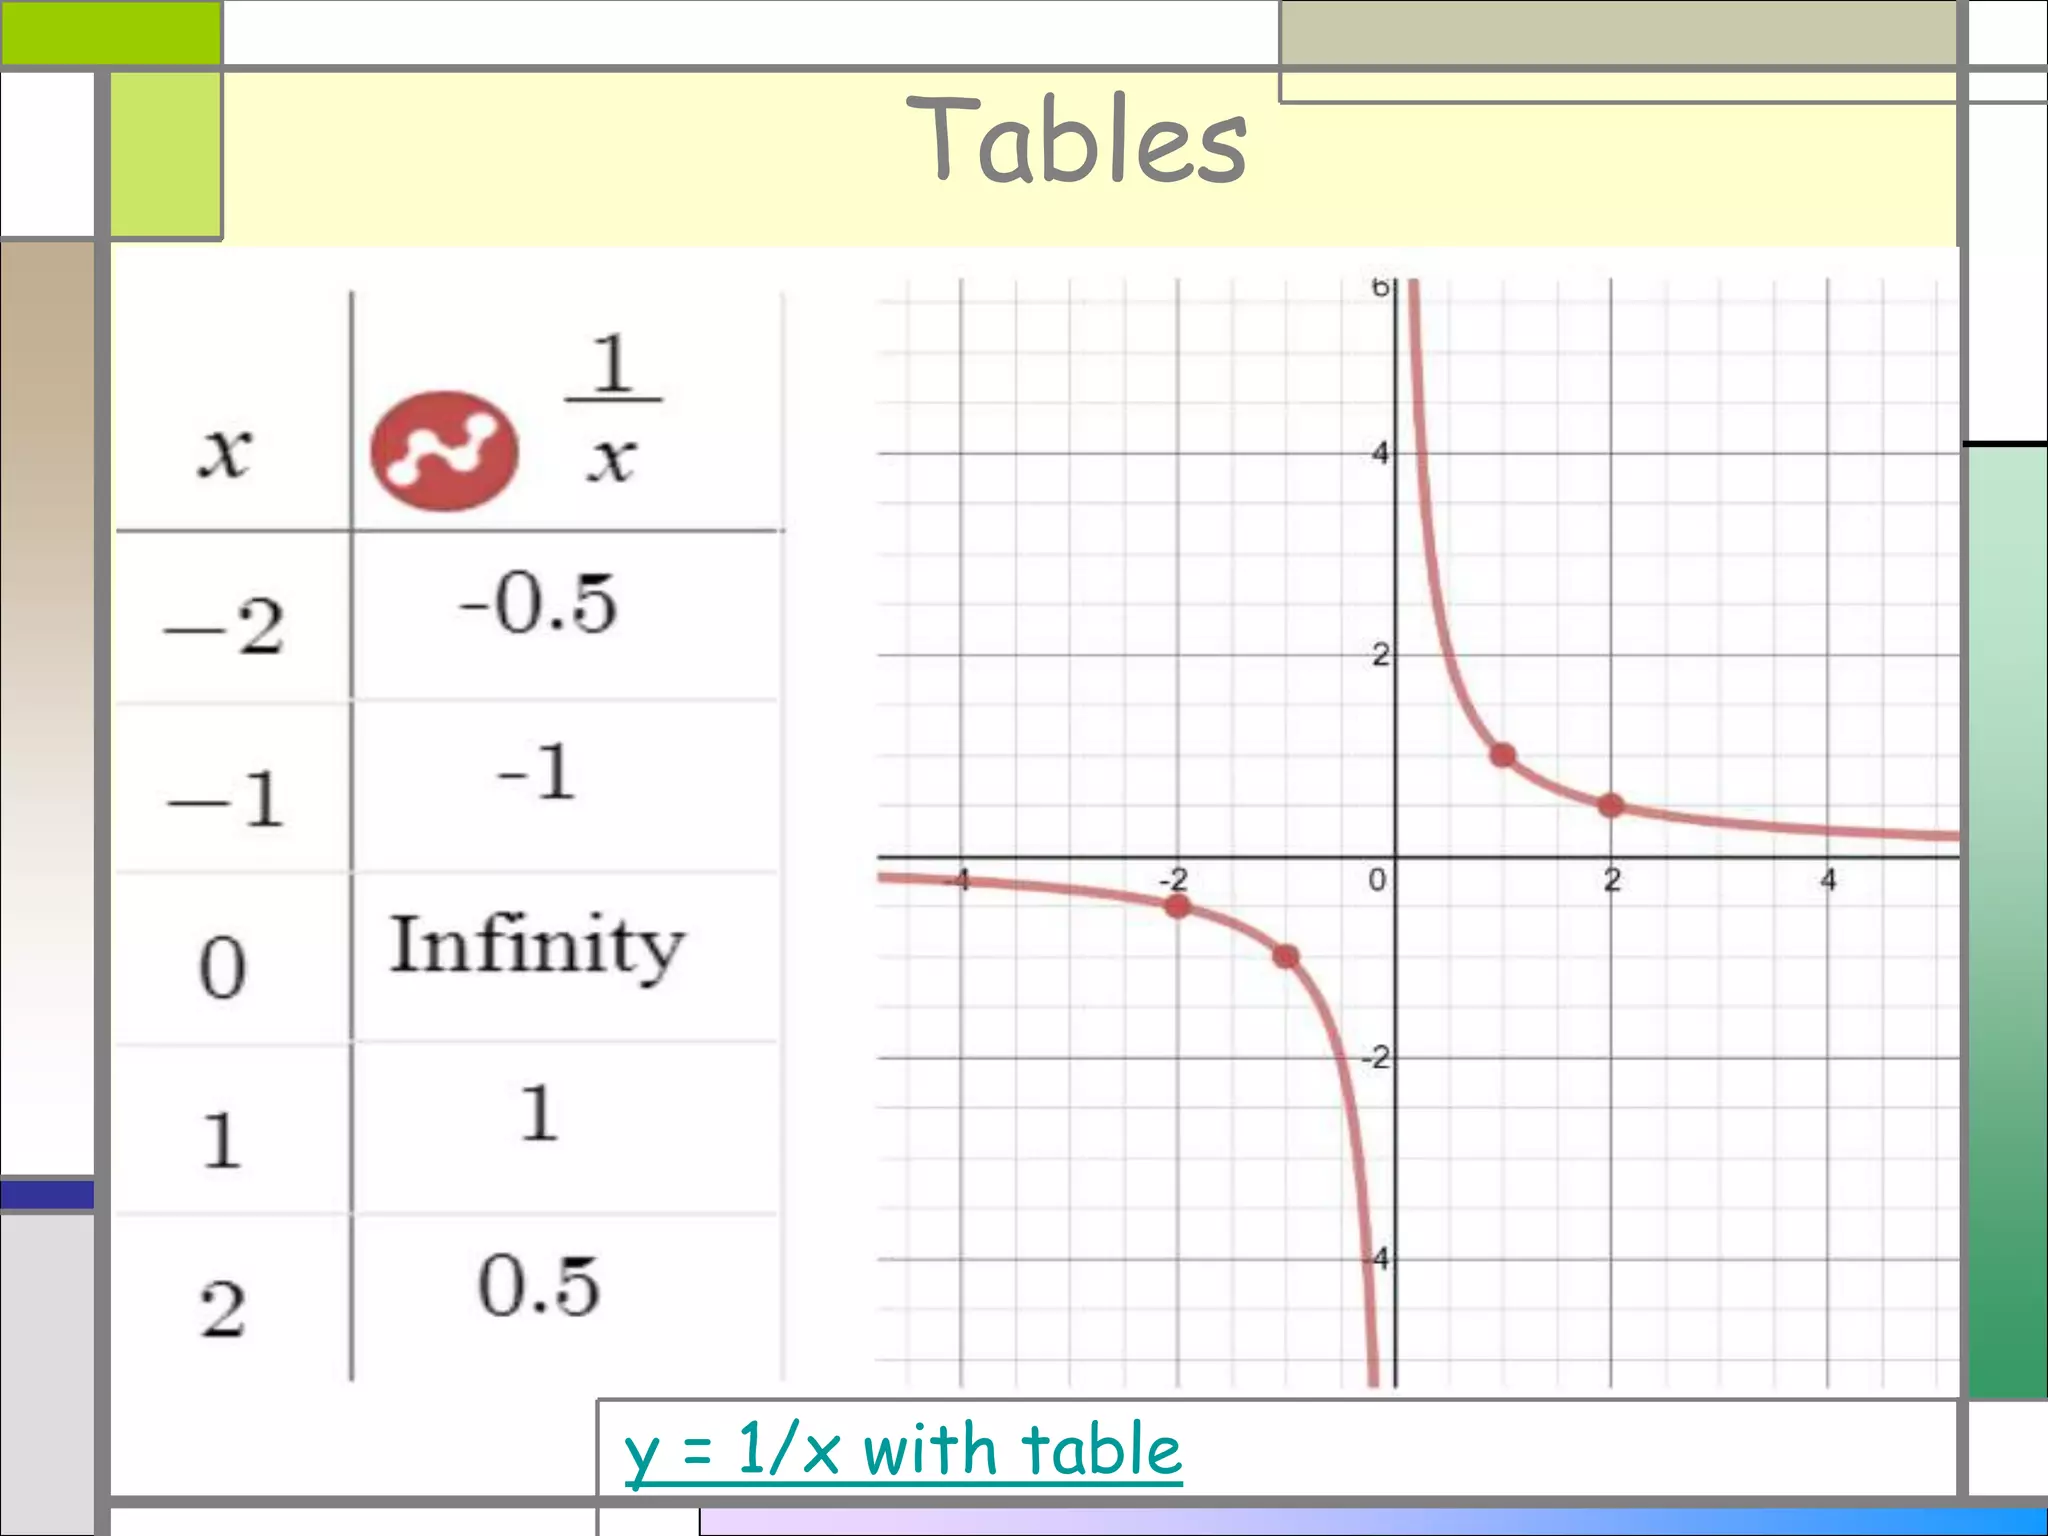
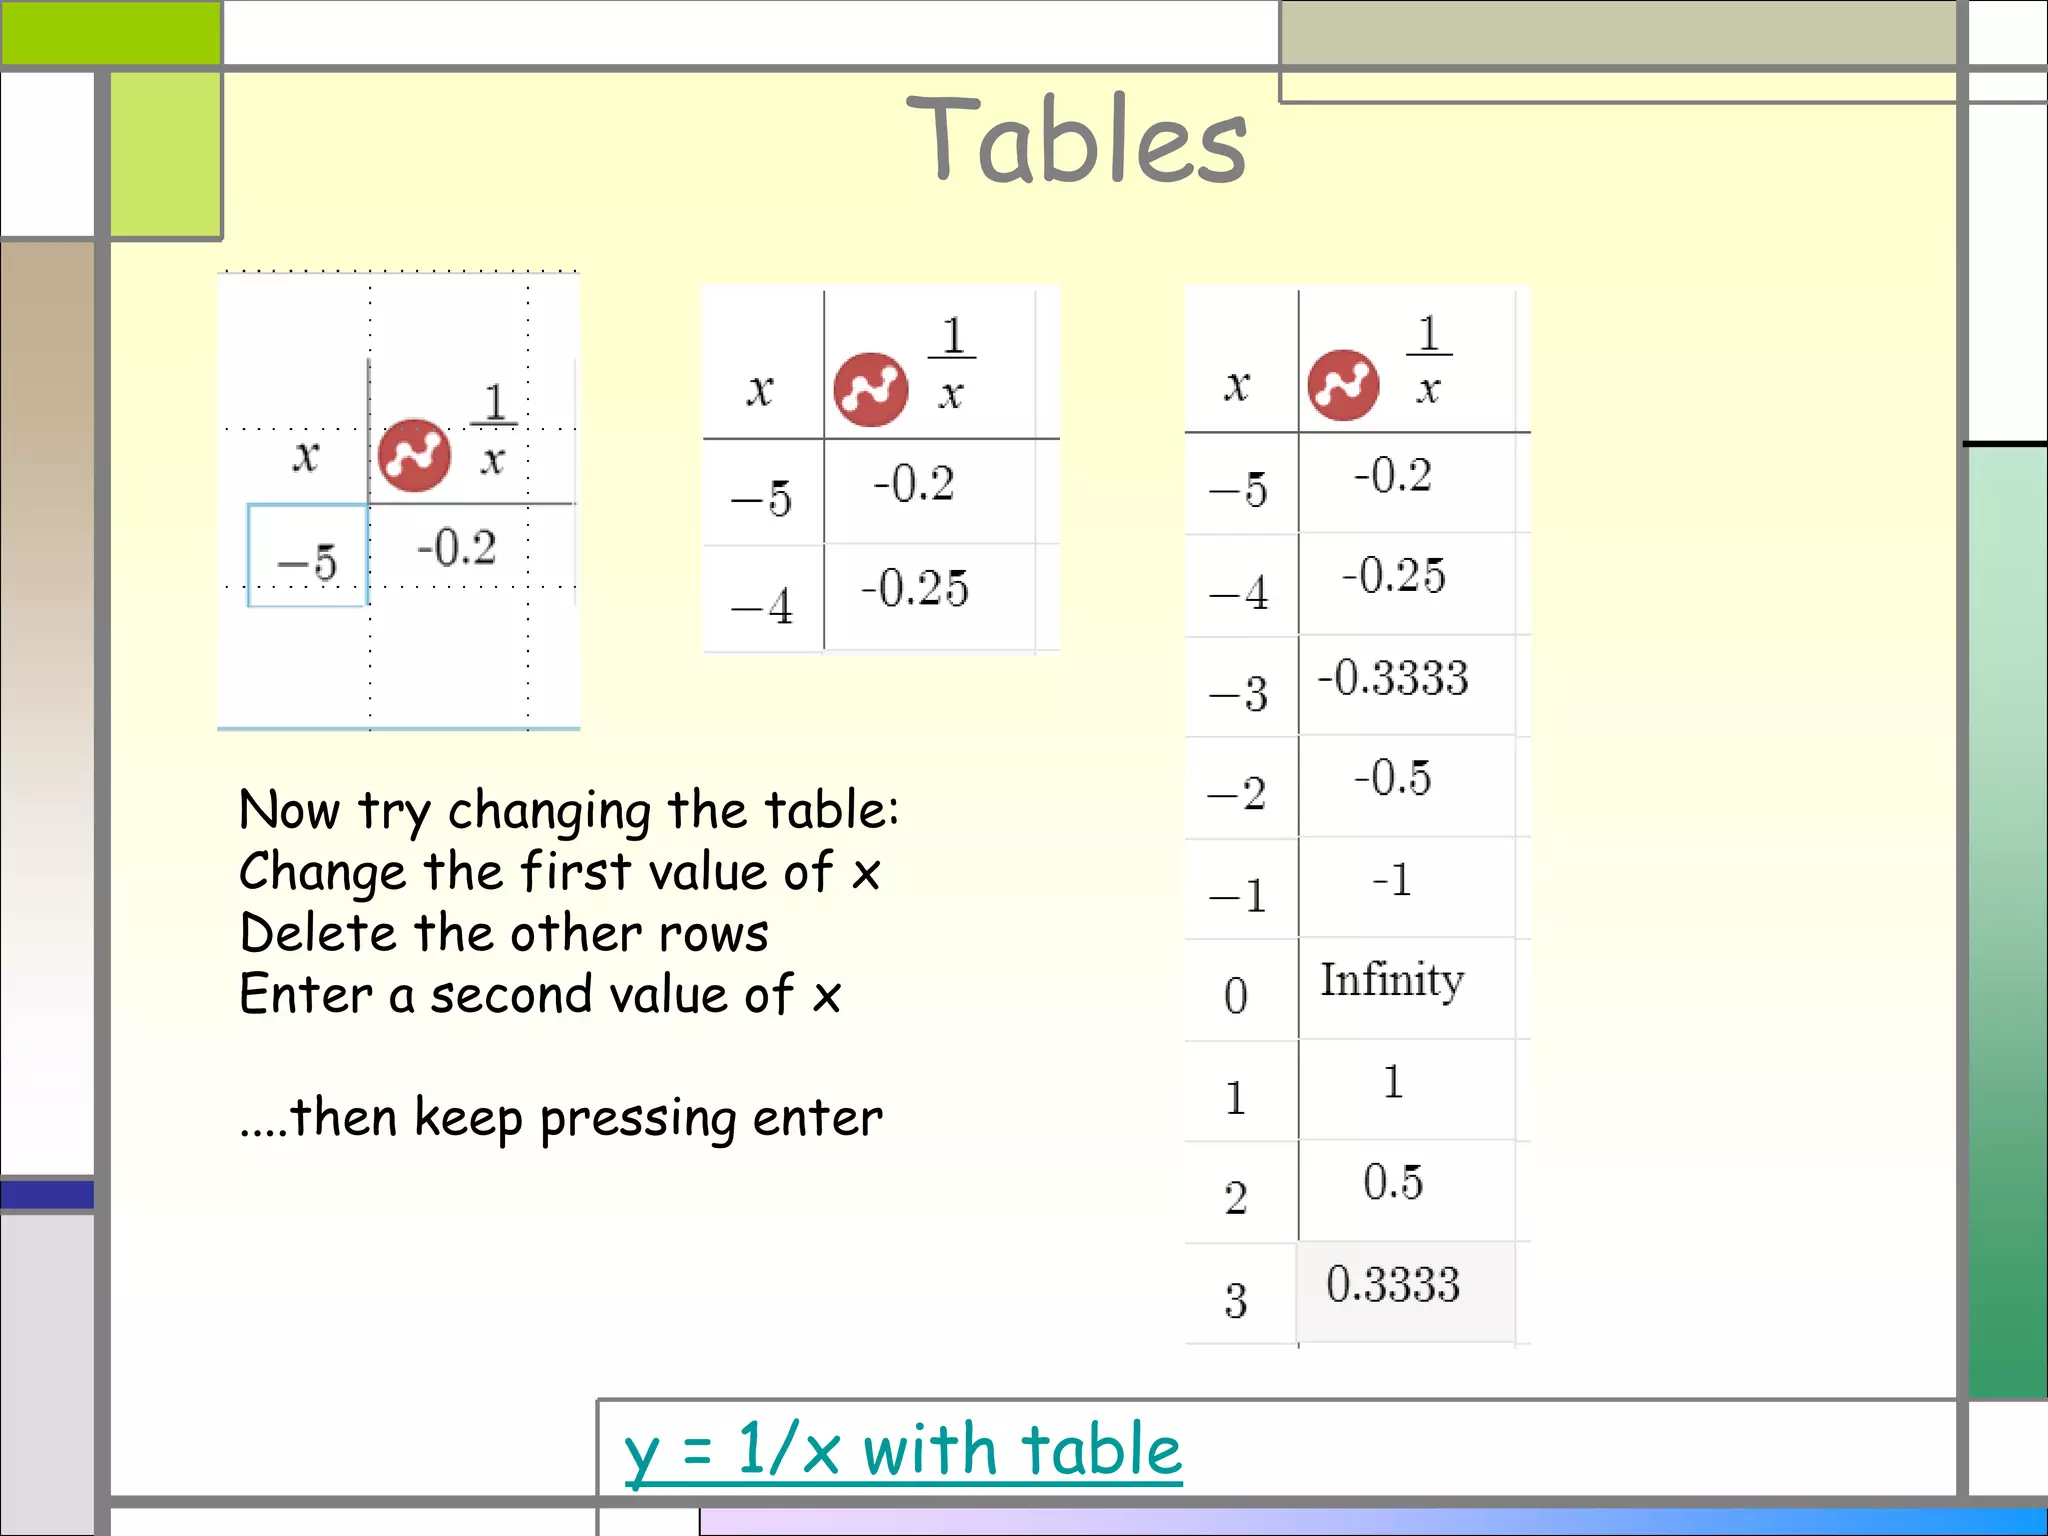
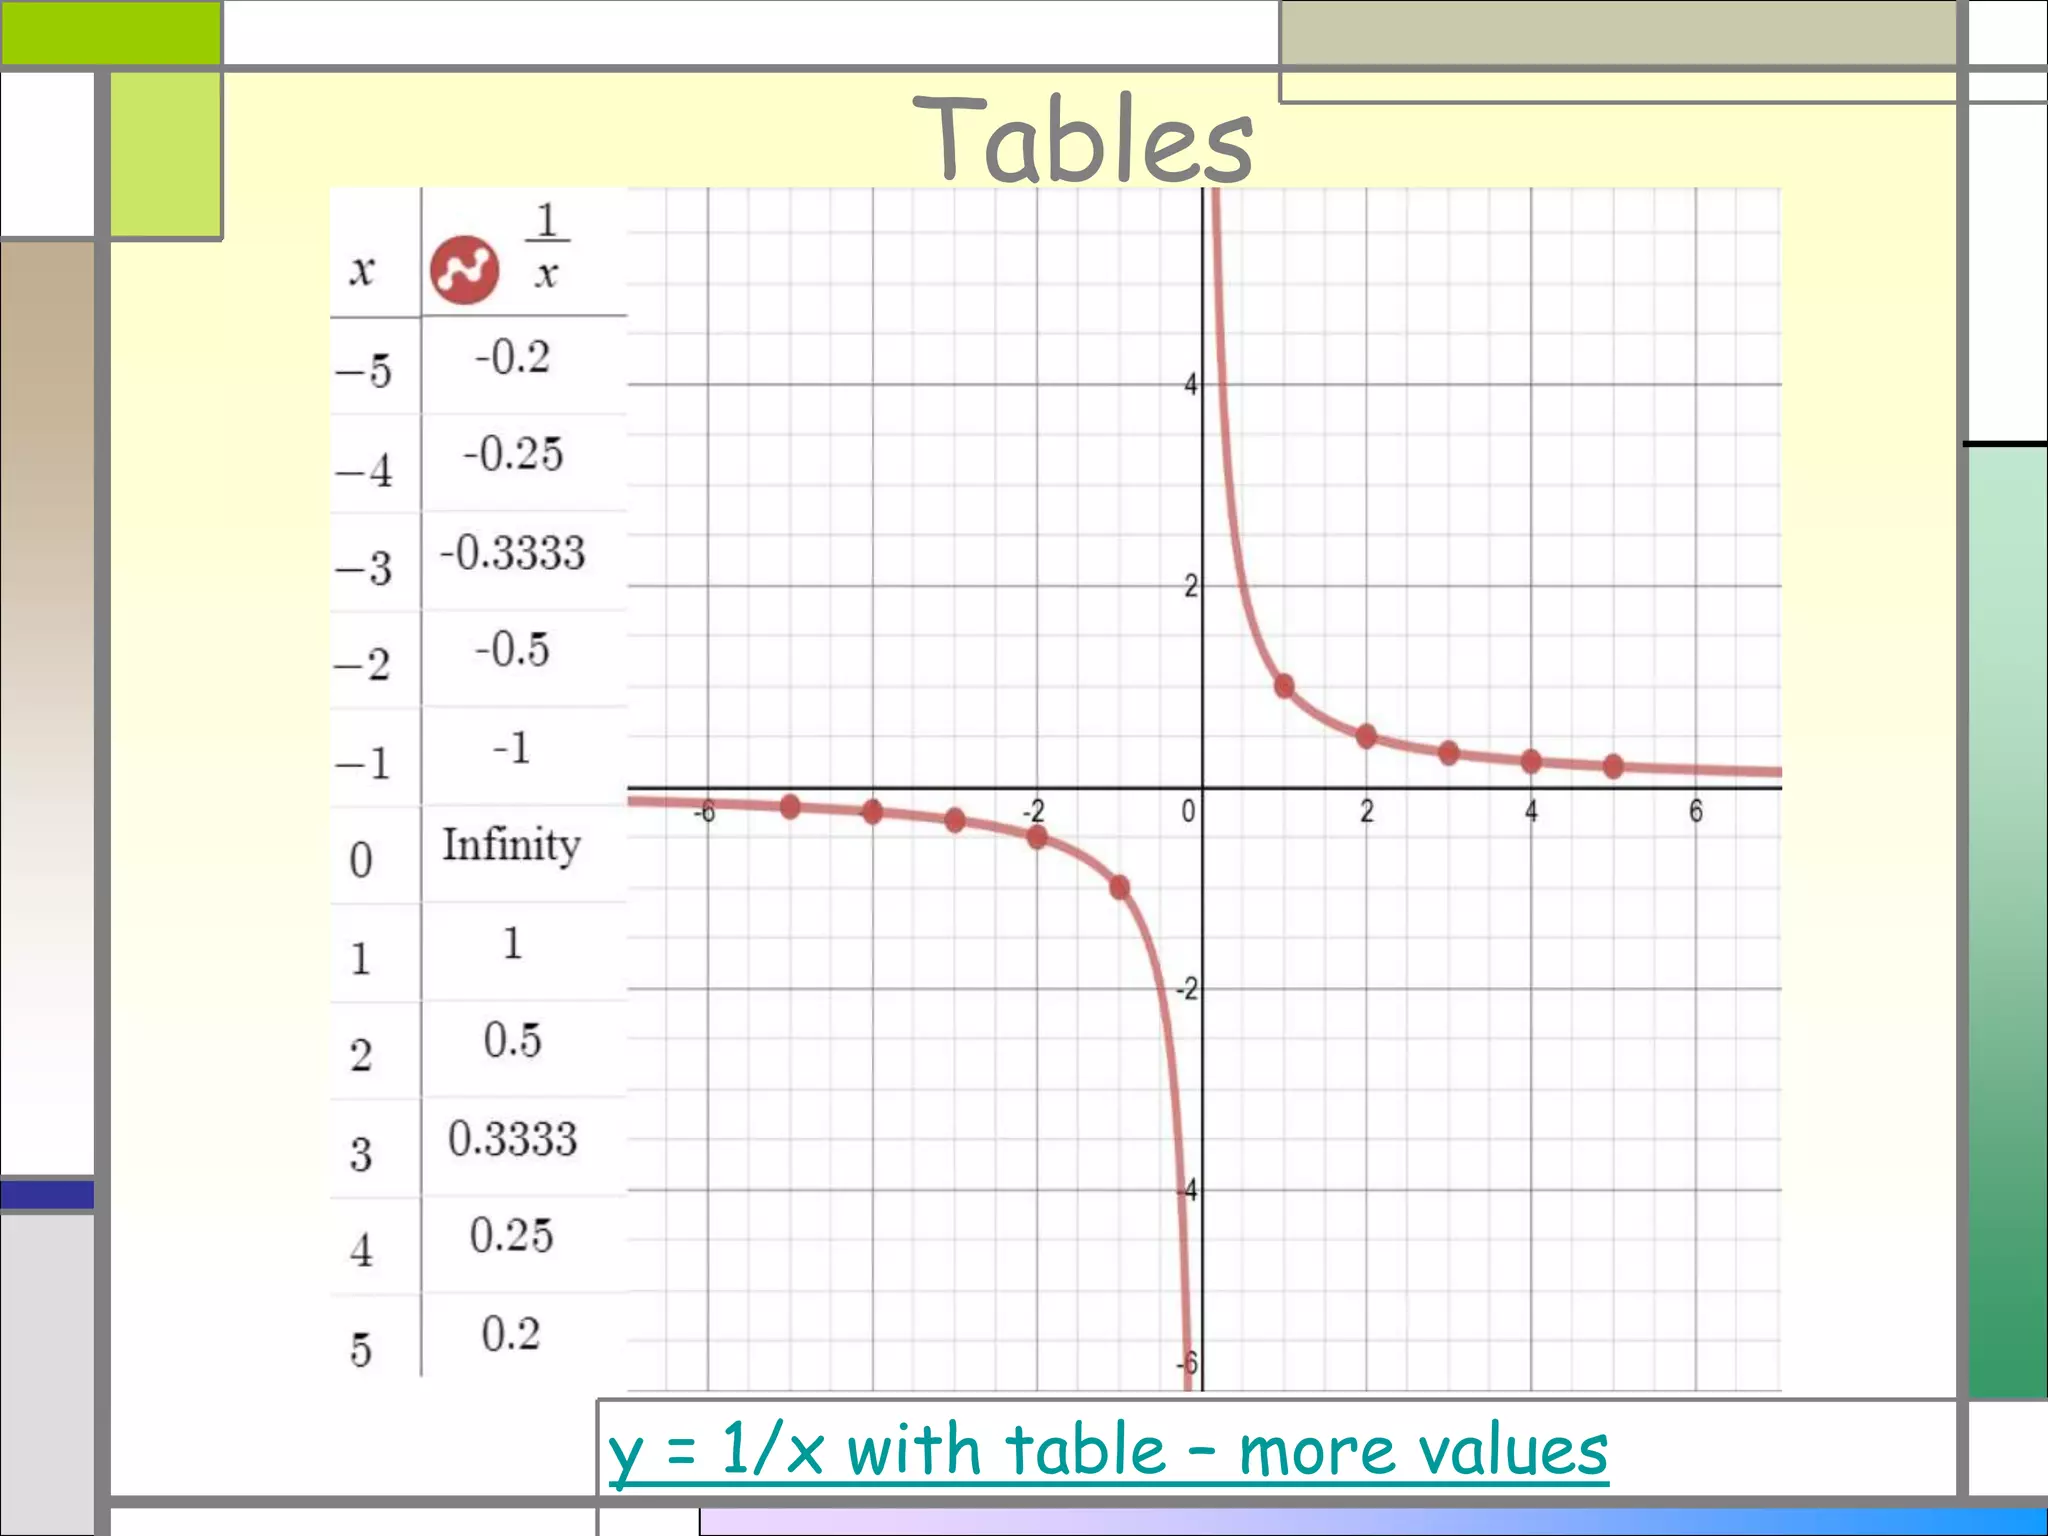
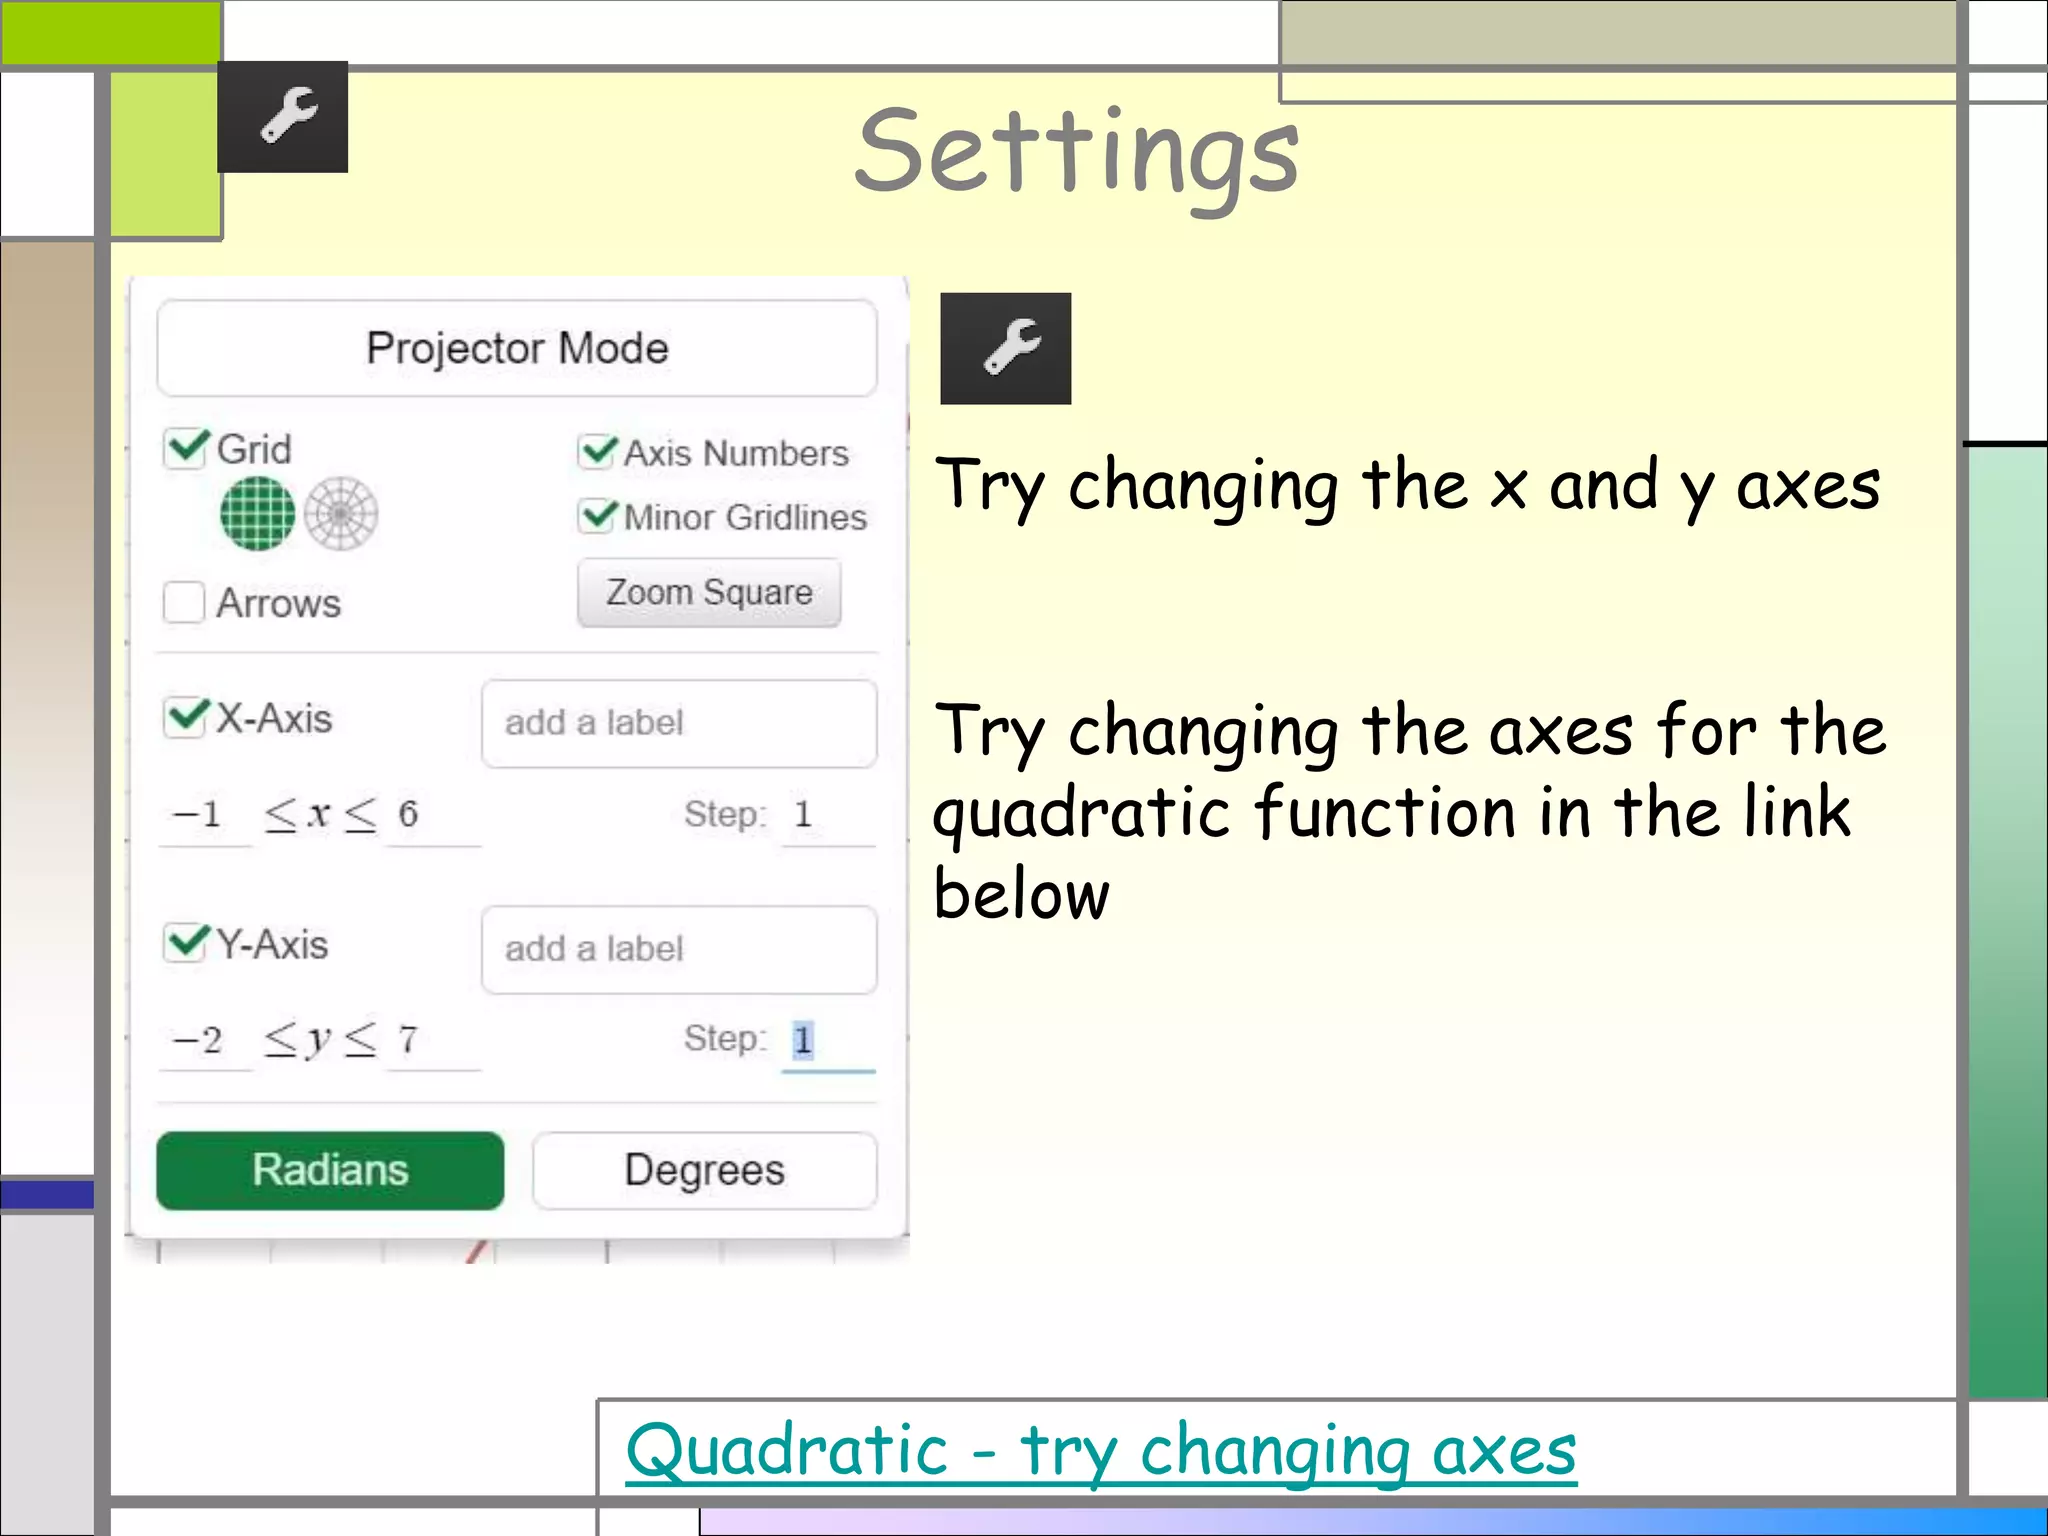
Desmos Graphing Calculator
Examples
Colleen Young
Desmos Graphing Calculator
Follow the instructions here to create
Desmos graphs. Learn about:
1. Drawing a quick graph
2. Plotting Points
3. Sliders
4. Points of interest
5. Tables
6. Settings
Desmos Graphing Calculator
Note that many slides have hyperlinks
which will take you direct to a Desmos
page you can experiment with.
Sometimes hyperlinks will be in the main
body of the slide.
Hyperlinks to graphs will be in this position
Draw a quick graph
Suppose you want a graph of y = 3x+2
Simply go to Desmos and type in your
function
That’s it – one graph!
y = 3x+2
Learn about sliders
Now suppose you want to explore
straight line graphs.
Simply go to Desmos and type in your
function but this time use variables:
You will be offered the chance to add
sliders – select all
Learn about sliders
y = mx+c
Now you have sliders
Try changing them and
watch that graph!
Learn about sliders
If you want a slider to have integer
values only, select one of the end points:
then you could make the step size 1 for
integer values and also change the lowest
and highest values if you want
y = mx+c try changing the sliders
Learn about sliders
If you want a slider to have integer
values only, select one of the end points:
then you could make the step size 1 for
integer values and also change the lowest
and highest values if you want
y=mx+c, m and c integers
Plot some points
Plot some points
Graph a function
x
f(x) = x + 3
Points of Interest
Points of interest
Tables
First enter your function
then select edit list
and choose convert to
table
Tables
y = 1/x with table
Tables
y = 1/x with table
Now try changing the table:
Change the first value of x
Delete the other rows
Enter a second value of x
....then keep pressing enter
Tables
y = 1/x with table – more values
Settings
Try changing the x and y axes
Try changing the axes for the
quadratic function in the link
below
Quadratic - try changing axes

Learning to use the Desmos Graphing Calculator

  • 1.
  • 2.
    Desmos Graphing Calculator Followthe instructions here to create Desmos graphs. Learn about: 1. Drawing a quick graph 2. Plotting Points 3. Sliders 4. Points of interest 5. Tables 6. Settings
  • 3.
    Desmos Graphing Calculator Notethat many slides have hyperlinks which will take you direct to a Desmos page you can experiment with. Sometimes hyperlinks will be in the main body of the slide. Hyperlinks to graphs will be in this position
  • 4.
    Draw a quickgraph Suppose you want a graph of y = 3x+2 Simply go to Desmos and type in your function That’s it – one graph! y = 3x+2
  • 5.
    Learn about sliders Nowsuppose you want to explore straight line graphs. Simply go to Desmos and type in your function but this time use variables: You will be offered the chance to add sliders – select all
  • 6.
    Learn about sliders y= mx+c Now you have sliders Try changing them and watch that graph!
  • 7.
    Learn about sliders Ifyou want a slider to have integer values only, select one of the end points: then you could make the step size 1 for integer values and also change the lowest and highest values if you want y = mx+c try changing the sliders
  • 8.
    Learn about sliders Ifyou want a slider to have integer values only, select one of the end points: then you could make the step size 1 for integer values and also change the lowest and highest values if you want y=mx+c, m and c integers
  • 9.
  • 10.
  • 11.
  • 12.
    Tables First enter yourfunction then select edit list and choose convert to table
  • 13.
    Tables y = 1/xwith table
  • 14.
    Tables y = 1/xwith table Now try changing the table: Change the first value of x Delete the other rows Enter a second value of x ....then keep pressing enter
  • 15.
    Tables y = 1/xwith table – more values
  • 16.
    Settings Try changing thex and y axes Try changing the axes for the quadratic function in the link below Quadratic - try changing axes