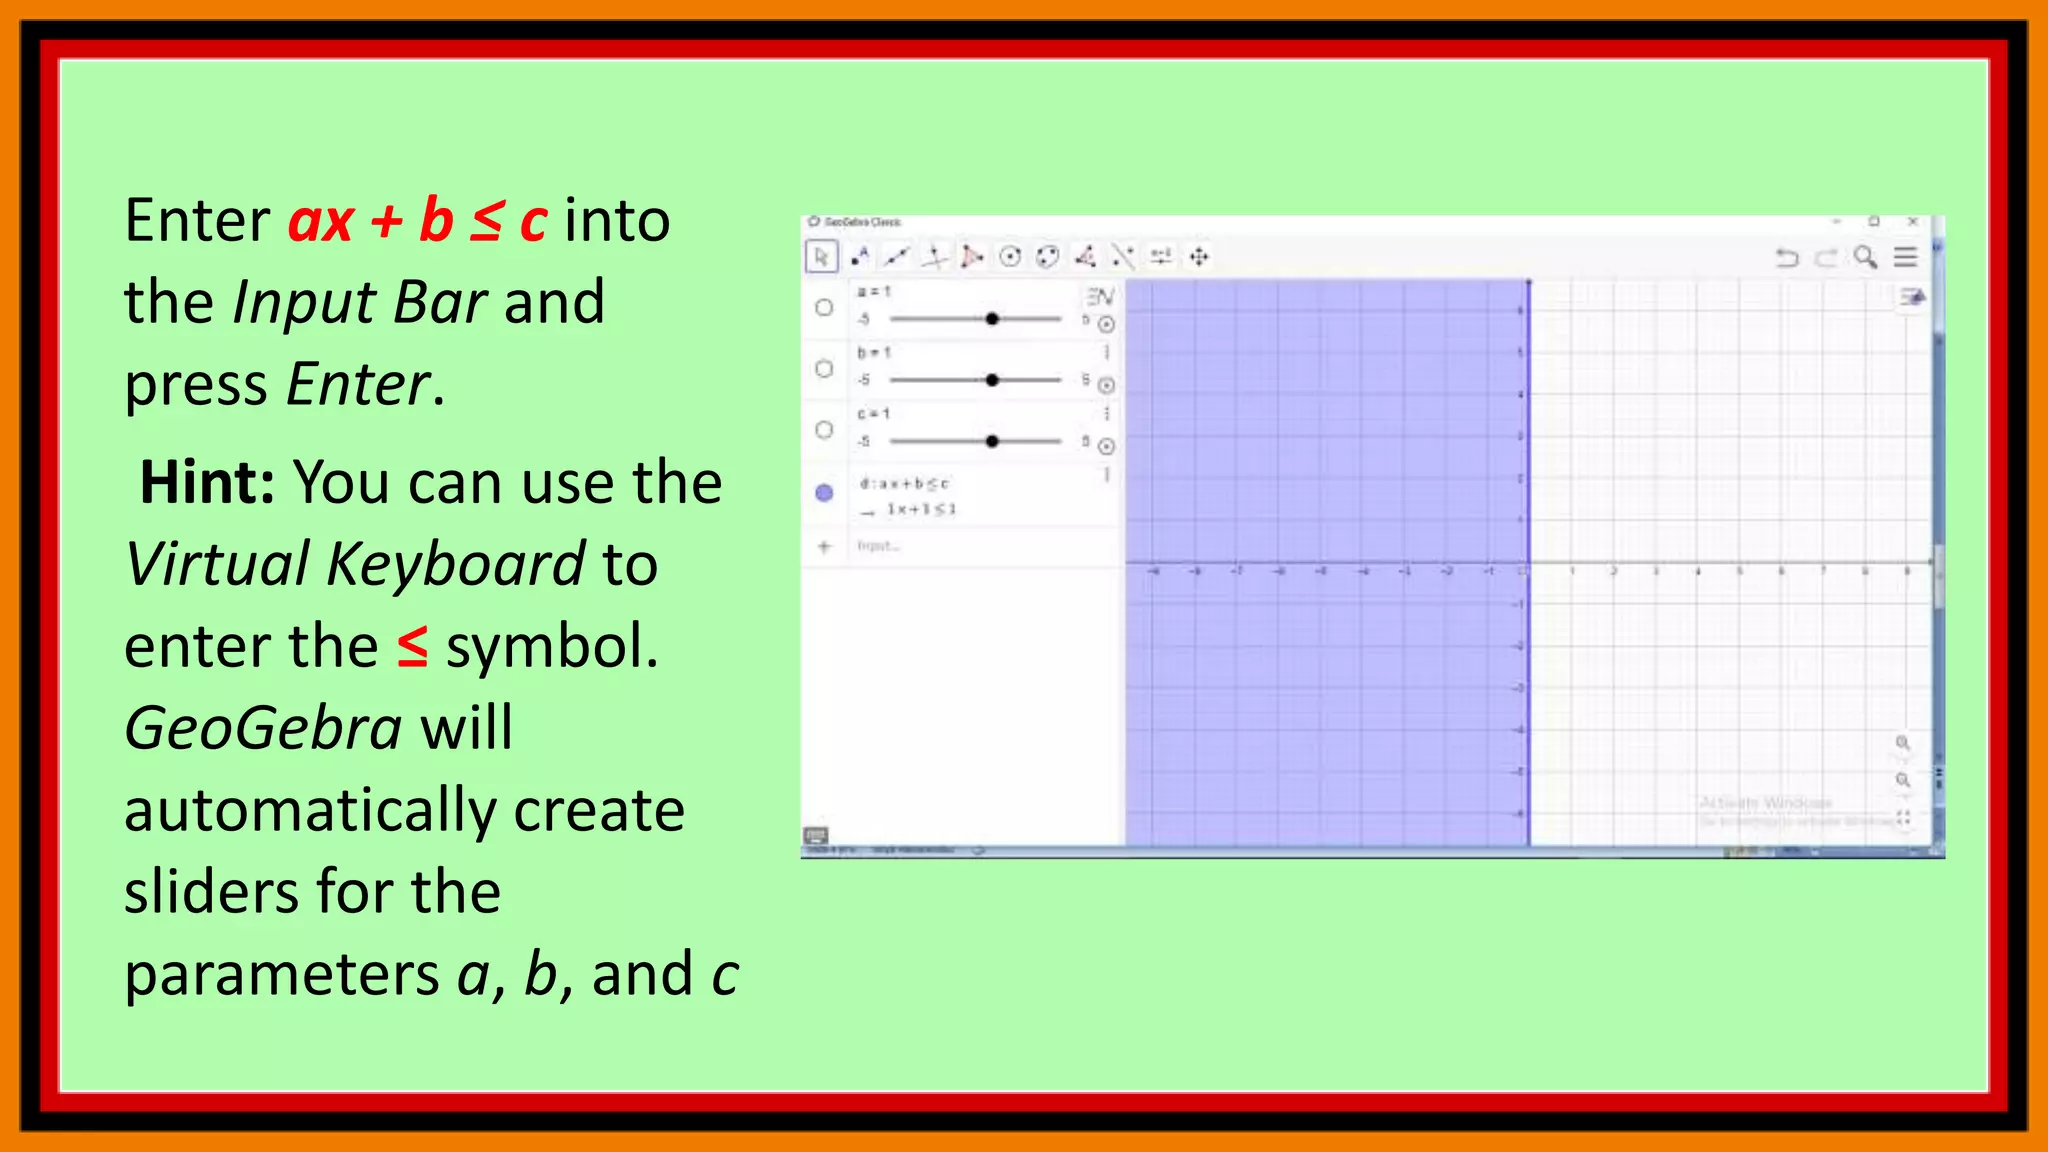
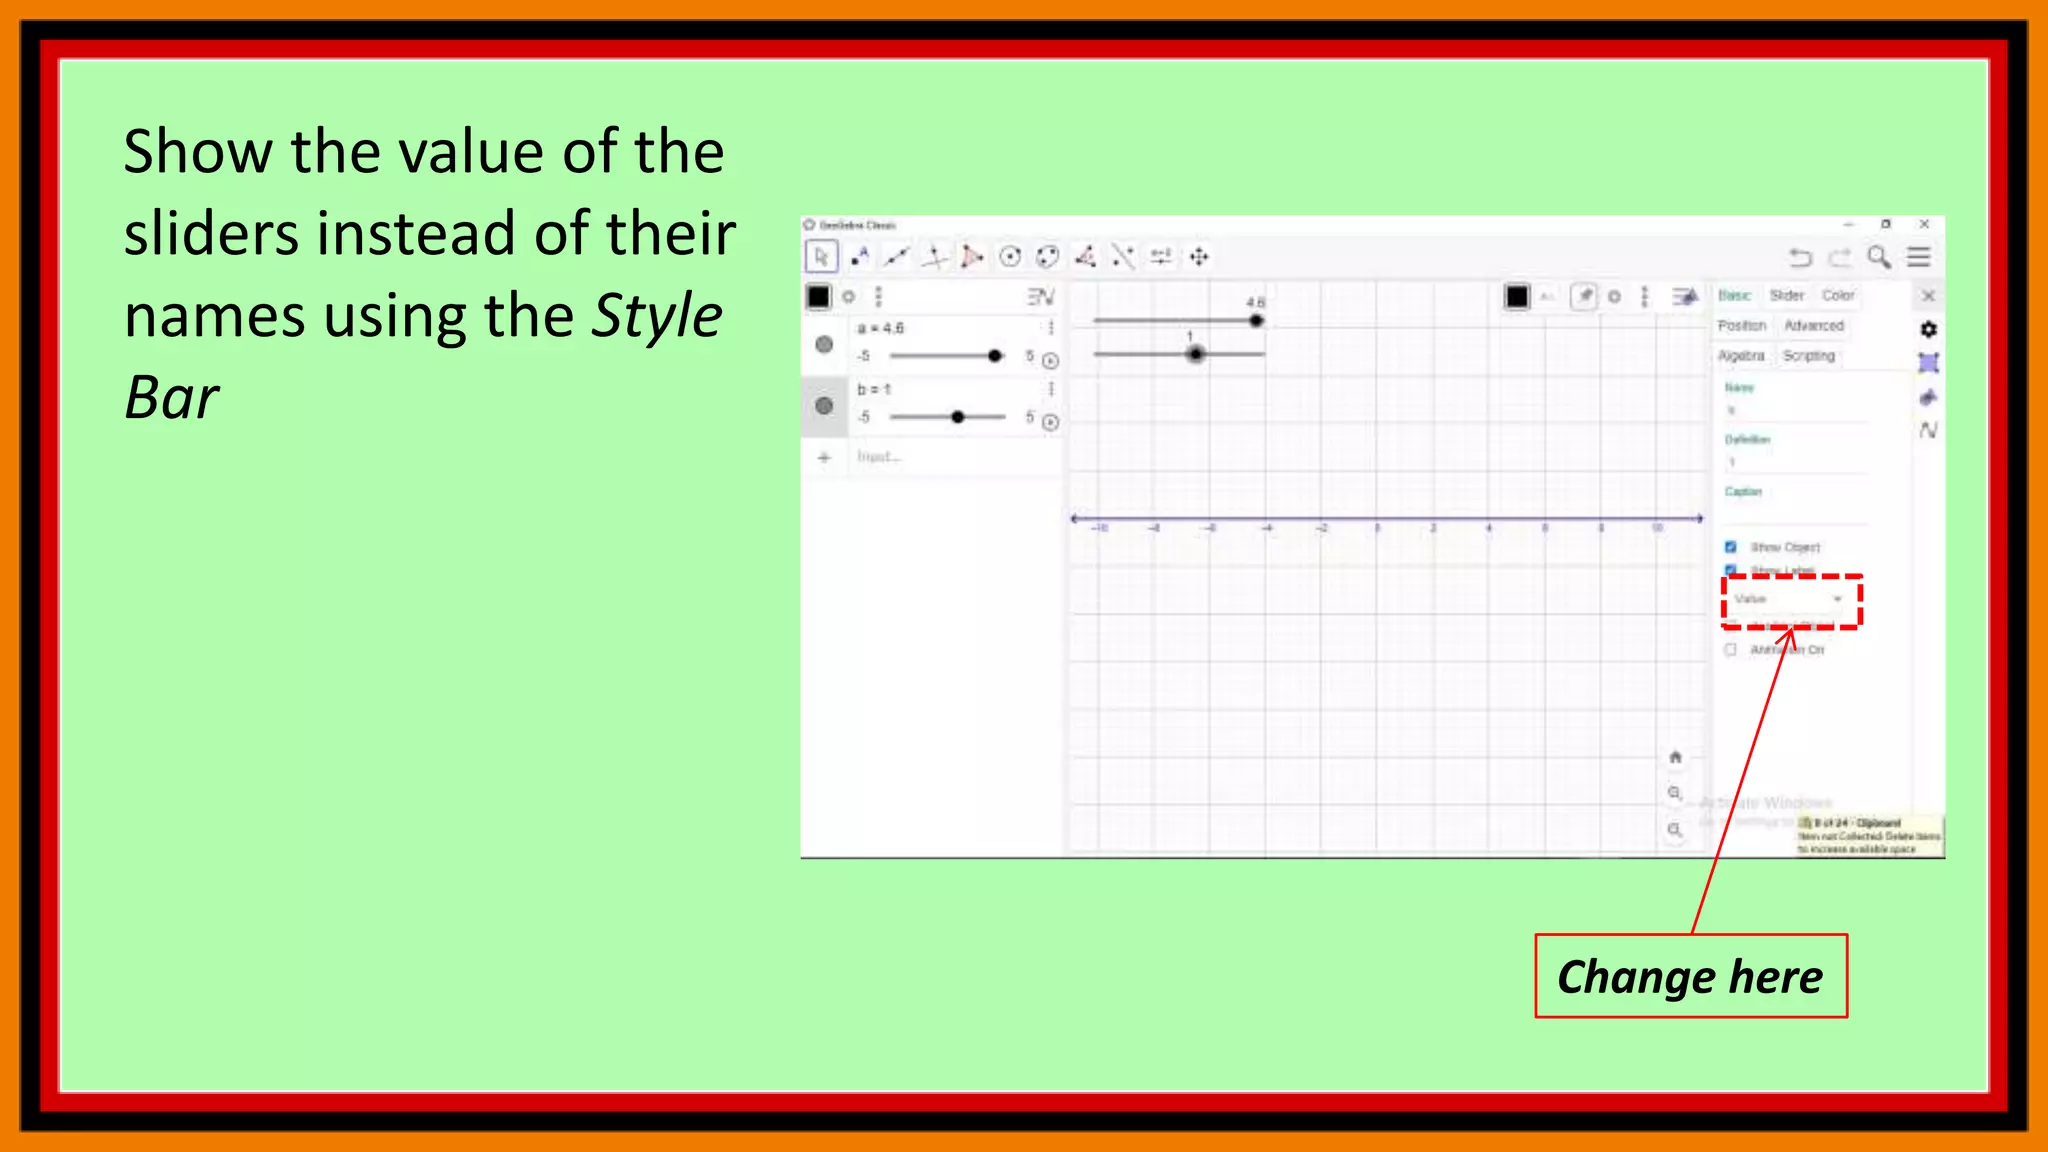
Graphing Calculator
Contents
Linear Inequalities
Visualizing Integer Addition
Linear Inequalities
Task
Graph a linear inequality ax + b ≤ c that can be explored using
sliders.
Enter ax + b ≤ c into
the Input Bar and
press Enter.
Hint: You can use the
Virtual Keyboard to
enter the ≤ symbol.
GeoGebra will
automatically create
sliders for the
parameters a, b, and c
Use the Move tool to
adjust the slider
values so that a = 1, b
= 1, and c = 3.
Change the increment
of the sliders to 1.
Hints: Select number
a and open the Style
Bar of the Graphics
View.
Style Bar
Select number a
.
Slider tab
Increment
Open the Settings of
number a and select
tab Slider.
Set the Increment to 1
and repeat for
numbers b and c
Settings
Drag the background
of the Graphics View
to move the origin to
the center
Zoom Out to make a
bigger part of the
coordinate system
visible on screen
Zoom out
Set the distance
between the marks on
the axes to 1.
Hints: Make sure that no
object is selected before
you open the Style Bar
of the Graphics View.
Open the Settings of the
axes.
Select tab xAxis and set
the Distance to 1.
Repeat on tab yAxis.
Make sure no object is selected
Change Distance
Finally, you can select
all objects and
animate. What do you
observe?
Visualizing Integer Addition
Task
Create a dynamic figure that visualizes the
addition of integers on the number line.
Open the Settings of
the Graphics
View using the Style
Bar
On tab xAxis set the
distance of tick marks
to 1 by checking the
box Distance and
entering 1 into the
text field.
Change Distance
On tab Basic set the
minimum of the xAxis
to -11 and the
maximum to 11
Set here
On tab yAxis uncheck
Show yAxis and close
the Settings.
Uncheck Show yAxis
Create two sliders a
and b, both
with Interval -5 to 5
and Increment 1
Sliders a and b
Show the value of the
sliders instead of their
names using the Style
Bar
Change here
Create points A = (0 ,
1) and B = A + (a , 0).
Hint: The distance of
point B to point A is
determined by slider a
Points A and B
Create a vector
u = Vector(A, B) which
has the length a
Vector u
Create points
C = B + (0, 1) and
D = C + (b, 0)
Points C and D
Create vector
v = Vector(C, D) which
has the length b
Vector v
Create point
R = (x(D), 0).
Hint: The
input x(D) gives you
the x-coordinate of
point D. Thus,
point R shows the
result of the addition
on the number line
Point R
Create point
Z = (0, 0)
Point Z
Create three
segments
c = Segment(Z, A),
d= Segment(B, C),
and
e = Segment(D, R)
Segments
Use the Style Bar to
enhance your
construction (e.g.
match the color of
sliders and vectors,
change line style, fix
sliders, hide labels and
points).
END
NEXT TOPIC:
continue…

Geogebra 6

  • 1.
  • 2.
  • 3.
    Linear Inequalities Task Graph alinear inequality ax + b ≤ c that can be explored using sliders.
  • 4.
    Enter ax +b ≤ c into the Input Bar and press Enter. Hint: You can use the Virtual Keyboard to enter the ≤ symbol. GeoGebra will automatically create sliders for the parameters a, b, and c
  • 5.
    Use the Movetool to adjust the slider values so that a = 1, b = 1, and c = 3.
  • 6.
    Change the increment ofthe sliders to 1. Hints: Select number a and open the Style Bar of the Graphics View. Style Bar Select number a
  • 7.
    . Slider tab Increment Open theSettings of number a and select tab Slider. Set the Increment to 1 and repeat for numbers b and c Settings
  • 8.
    Drag the background ofthe Graphics View to move the origin to the center
  • 9.
    Zoom Out tomake a bigger part of the coordinate system visible on screen Zoom out
  • 10.
    Set the distance betweenthe marks on the axes to 1. Hints: Make sure that no object is selected before you open the Style Bar of the Graphics View. Open the Settings of the axes. Select tab xAxis and set the Distance to 1. Repeat on tab yAxis. Make sure no object is selected Change Distance
  • 11.
    Finally, you canselect all objects and animate. What do you observe?
  • 12.
    Visualizing Integer Addition Task Createa dynamic figure that visualizes the addition of integers on the number line.
  • 13.
    Open the Settingsof the Graphics View using the Style Bar
  • 14.
    On tab xAxisset the distance of tick marks to 1 by checking the box Distance and entering 1 into the text field. Change Distance
  • 15.
    On tab Basicset the minimum of the xAxis to -11 and the maximum to 11 Set here
  • 16.
    On tab yAxisuncheck Show yAxis and close the Settings. Uncheck Show yAxis
  • 17.
    Create two slidersa and b, both with Interval -5 to 5 and Increment 1 Sliders a and b
  • 18.
    Show the valueof the sliders instead of their names using the Style Bar Change here
  • 19.
    Create points A= (0 , 1) and B = A + (a , 0). Hint: The distance of point B to point A is determined by slider a Points A and B
  • 20.
    Create a vector u= Vector(A, B) which has the length a Vector u
  • 21.
    Create points C =B + (0, 1) and D = C + (b, 0) Points C and D
  • 22.
    Create vector v =Vector(C, D) which has the length b Vector v
  • 23.
    Create point R =(x(D), 0). Hint: The input x(D) gives you the x-coordinate of point D. Thus, point R shows the result of the addition on the number line Point R
  • 24.
    Create point Z =(0, 0) Point Z
  • 25.
    Create three segments c =Segment(Z, A), d= Segment(B, C), and e = Segment(D, R) Segments
  • 26.
    Use the StyleBar to enhance your construction (e.g. match the color of sliders and vectors, change line style, fix sliders, hide labels and points).
  • 27.