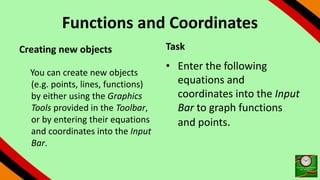
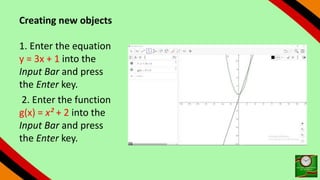
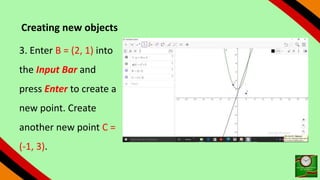
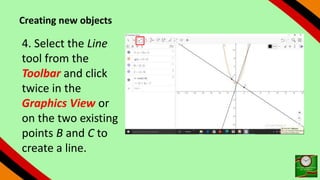
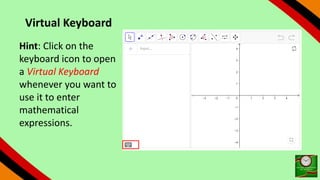
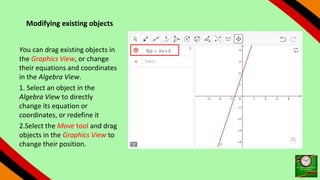
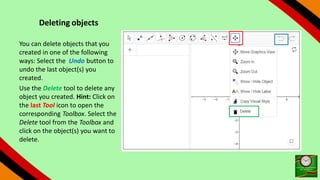
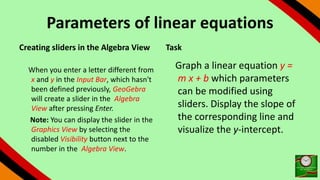
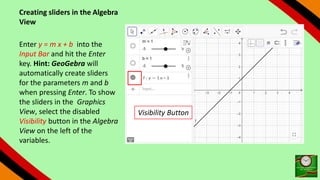
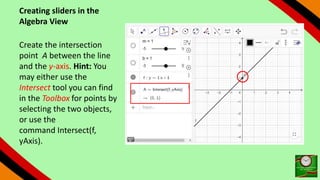
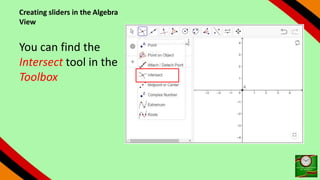
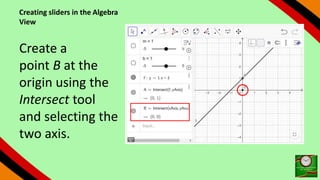
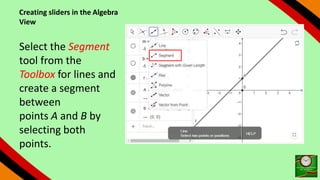
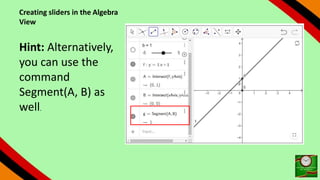
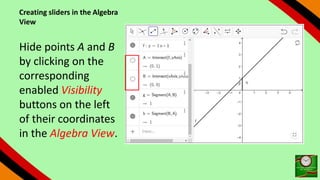
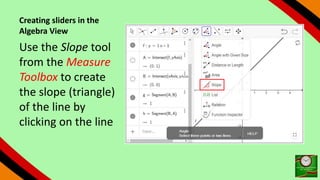
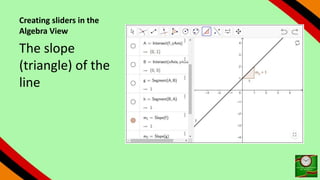
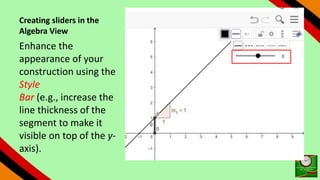
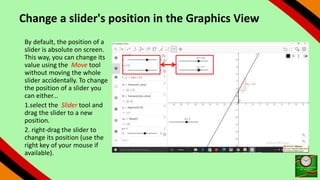
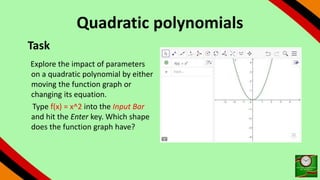
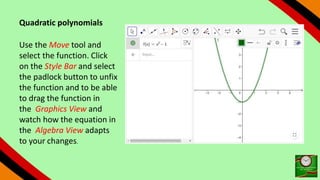
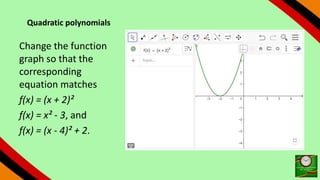
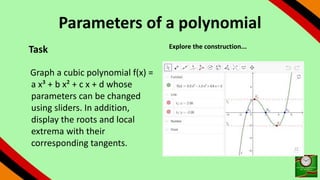
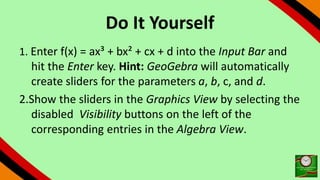
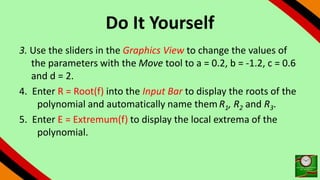
SlideShare a Scribd company logo
1 of 31
Contents
Functions and Coordinates
Parameters of linear equations
Quadratic polynomials
Functions and Coordinates
Creating new objects
You can create new objects
(e.g. points, lines, functions)
by either using the Graphics
Tools provided in the Toolbar,
or by entering their equations
and coordinates into the Input
Bar.
Task
• Enter the following
equations and
coordinates into the Input
Bar to graph functions
and points.
Creating new objects
1. Enter the equation
y = 3x + 1 into the
Input Bar and press
the Enter key.
2. Enter the function
g(x) = x² + 2 into the
Input Bar and press
the Enter key.
Creating new objects
3. Enter B = (2, 1) into
the Input Bar and
press Enter to create a
new point. Create
another new point C =
(-1, 3).
Creating new objects
4. Select the Line
tool from the
Toolbar and click
twice in the
Graphics View or
on the two existing
points B and C to
create a line.
Virtual Keyboard
Hint: Click on the
keyboard icon to open
a Virtual Keyboard
whenever you want to
use it to enter
mathematical
expressions.
Modifying existing objects
You can drag existing objects in
the Graphics View, or change
their equations and coordinates
in the Algebra View.
1. Select an object in the
Algebra View to directly
change its equation or
coordinates, or redefine it
2.Select the Move tool and drag
objects in the Graphics View to
change their position.
Deleting objects
You can delete objects that you
created in one of the following
ways: Select the Undo button to
undo the last object(s) you
created.
Use the Delete tool to delete any
object you created. Hint: Click on
the last Tool icon to open the
corresponding Toolbox. Select the
Delete tool from the Toolbox and
click on the object(s) you want to
delete.
Parameters of linear equations
Creating sliders in the Algebra View
When you enter a letter different from
x and y in the Input Bar, which hasn't
been defined previously, GeoGebra
will create a slider in the Algebra
View after pressing Enter.
Note: You can display the slider in the
Graphics View by selecting the
disabled Visibility button next to the
number in the Algebra View.
Task
Graph a linear equation y =
m x + b which parameters
can be modified using
sliders. Display the slope of
the corresponding line and
visualize the y-intercept.
Creating sliders in the Algebra
View
Enter y = m x + b into the
Input Bar and hit the Enter
key. Hint: GeoGebra will
automatically create sliders
for the parameters m and b
when pressing Enter. To show
the sliders in the Graphics
View, select the disabled
Visibility button in the Algebra
View on the left of the
variables.
Visibility Button
Creating sliders in the
Algebra View
Create the intersection
point A between the line
and the y-axis. Hint: You
may either use the
Intersect tool you can find
in the Toolbox for points by
selecting the two objects,
or use the
command Intersect(f,
yAxis).
Creating sliders in the Algebra
View
You can find the
Intersect tool in the
Toolbox
Creating sliders in the Algebra
View
Create a
point B at the
origin using the
Intersect tool
and selecting the
two axis.
Creating sliders in the Algebra
View
Select the Segment
tool from the
Toolbox for lines and
create a segment
between
points A and B by
selecting both
points.
Creating sliders in the Algebra
View
Hint: Alternatively,
you can use the
command
Segment(A, B) as
well.
Creating sliders in the Algebra
View
Hide points A and B
by clicking on the
corresponding
enabled Visibility
buttons on the left
of their coordinates
in the Algebra View.
Creating sliders in the
Algebra View
Use the Slope tool
from the Measure
Toolbox to create
the slope (triangle)
of the line by
clicking on the line
Creating sliders in the
Algebra View
The slope
(triangle) of the
line
Creating sliders in the
Algebra View
Enhance the
appearance of your
construction using the
Style
Bar (e.g., increase the
line thickness of the
segment to make it
visible on top of the y-
axis).
Change a slider's position in the Graphics View
By default, the position of a
slider is absolute on screen.
This way, you can change its
value using the Move tool
without moving the whole
slider accidentally. To change
the position of a slider you
can either...
1.select the Slider tool and
drag the slider to a new
position.
2. right-drag the slider to
change its position (use the
right key of your mouse if
available).
Quadratic polynomials
Task
Explore the impact of parameters
on a quadratic polynomial by either
moving the function graph or
changing its equation.
Type f(x) = x^2 into the Input Bar
and hit the Enter key. Which shape
does the function graph have?
Quadratic polynomials
Use the Move tool and
select the function. Click
on the Style Bar and select
the padlock button to unfix
the function and to be able
to drag the function in
the Graphics View and
watch how the equation in
the Algebra View adapts
to your changes.
Quadratic polynomials
Change the function
graph so that the
corresponding
equation matches
f(x) = (x + 2)²
f(x) = x² - 3, and
f(x) = (x - 4)² + 2.
Quadratic polynomials
Task
Select the equation of the polynomial. Use the
keyboard to change the equation to f(x) =
3x². How does the function graph change? Repeat
changing the equation by typing in different
values for the parameter (e.g. 0.5, -2, -0.8, 3).
Parameters of a polynomial
Task
Graph a cubic polynomial f(x) =
a x³ + b x² + c x + d whose
parameters can be changed
using sliders. In addition,
display the roots and local
extrema with their
corresponding tangents.
Explore the construction...
Do It Yourself
1. Enter f(x) = ax³ + bx² + cx + d into the Input Bar and
hit the Enter key. Hint: GeoGebra will automatically
create sliders for the parameters a, b, c, and d.
2.Show the sliders in the Graphics View by selecting the
disabled Visibility buttons on the left of the
corresponding entries in the Algebra View.
Do It Yourself
3. Use the sliders in the Graphics View to change the values of
the parameters with the Move tool to a = 0.2, b = -1.2, c = 0.6
and d = 2.
4. Enter R = Root(f) into the Input Bar to display the roots of the
polynomial and automatically name themR1, R2 and R3.
5. Enter E = Extremum(f) to display the local extrema of the
polynomial.
Do It Yourself
6.Use the Tangent tool
to create the tangents to
the polynomial through
the extrema E1 and E2.
Hint: Open the Toolbox
of Special Lines and
select the Tangent tool.
Successively select point
E1 and the polynomial to
create the tangent.
Repeat for point E2.
Do It Yourself
7.Systematically change the values of the sliders using
the Move tool to explore how the parameters affect
the polynomial.
END
NEXT TOPIC:
continue…

More Related Content

What's hot

Adobe illustrator 1
Adobe illustrator 1Adobe illustrator 1
Adobe illustrator 1ilaazmil2
 
Introducing Adobe Animate CC
Introducing Adobe Animate CCIntroducing Adobe Animate CC
Introducing Adobe Animate CCJoseph Labrecque
 
Introduction to Google Forms
Introduction to Google FormsIntroduction to Google Forms
Introduction to Google FormsClaire Amos
 
Project management with trello 101
Project management with trello 101Project management with trello 101
Project management with trello 101Phung Cuong
 
MS Publisher Tutorial
MS Publisher TutorialMS Publisher Tutorial
MS Publisher TutorialvirtualMaryam
 
Learn MS Powerpoint basics
Learn MS Powerpoint basicsLearn MS Powerpoint basics
Learn MS Powerpoint basicsvethics
 
Microsoft Power Point 2010
Microsoft Power Point 2010Microsoft Power Point 2010
Microsoft Power Point 2010home
 
MS Publisher.ppt
MS Publisher.pptMS Publisher.ppt
MS Publisher.pptDondonGoles
 
Quantum QIS (QGIS) Araç Çubukları
Quantum QIS (QGIS) Araç ÇubuklarıQuantum QIS (QGIS) Araç Çubukları
Quantum QIS (QGIS) Araç ÇubuklarıLevent Sabah
 
Ms publisher
Ms publisherMs publisher
Ms publisherVTC
 

What's hot (20)

Gimp
GimpGimp
Gimp
 
Adobe illustrator 1
Adobe illustrator 1Adobe illustrator 1
Adobe illustrator 1
 
Introducing Adobe Animate CC
Introducing Adobe Animate CCIntroducing Adobe Animate CC
Introducing Adobe Animate CC
 
Introduction to Google Forms
Introduction to Google FormsIntroduction to Google Forms
Introduction to Google Forms
 
Project management with trello 101
Project management with trello 101Project management with trello 101
Project management with trello 101
 
Canva Presentation.pptx
Canva Presentation.pptxCanva Presentation.pptx
Canva Presentation.pptx
 
Learning power point 2016
Learning power point 2016Learning power point 2016
Learning power point 2016
 
Basics of Photoshop Tutorial
Basics of Photoshop TutorialBasics of Photoshop Tutorial
Basics of Photoshop Tutorial
 
MS Publisher Tutorial
MS Publisher TutorialMS Publisher Tutorial
MS Publisher Tutorial
 
Canva Tutorial
Canva TutorialCanva Tutorial
Canva Tutorial
 
Learn MS Powerpoint basics
Learn MS Powerpoint basicsLearn MS Powerpoint basics
Learn MS Powerpoint basics
 
Microsoft Power Point 2010
Microsoft Power Point 2010Microsoft Power Point 2010
Microsoft Power Point 2010
 
ms paint Presentation.pdf
ms paint Presentation.pdfms paint Presentation.pdf
ms paint Presentation.pdf
 
Canva tutorial
Canva tutorialCanva tutorial
Canva tutorial
 
Gimp 2
Gimp 2Gimp 2
Gimp 2
 
MS Publisher.ppt
MS Publisher.pptMS Publisher.ppt
MS Publisher.ppt
 
Photoshop Tools
Photoshop ToolsPhotoshop Tools
Photoshop Tools
 
Quantum QIS (QGIS) Araç Çubukları
Quantum QIS (QGIS) Araç ÇubuklarıQuantum QIS (QGIS) Araç Çubukları
Quantum QIS (QGIS) Araç Çubukları
 
Presentation101 by Adrian Bulacan
Presentation101 by Adrian BulacanPresentation101 by Adrian Bulacan
Presentation101 by Adrian Bulacan
 
Ms publisher
Ms publisherMs publisher
Ms publisher
 

Similar to GeoGebra 3

Microsoft mathmatics step-by-step_guide
Microsoft mathmatics step-by-step_guideMicrosoft mathmatics step-by-step_guide
Microsoft mathmatics step-by-step_guideAnang Anang
 
On the tomcat drive in folder cosc210 you will find file named Paint.docx
On the tomcat drive in folder cosc210 you will find file named Paint.docxOn the tomcat drive in folder cosc210 you will find file named Paint.docx
On the tomcat drive in folder cosc210 you will find file named Paint.docxdunhamadell
 
Module 6 component of excel chart
Module 6 component of excel chartModule 6 component of excel chart
Module 6 component of excel chartDr. Shalini Pandey
 
Creating & Editing Charts In Microsoft Excel 2003
Creating & Editing Charts In Microsoft Excel 2003Creating & Editing Charts In Microsoft Excel 2003
Creating & Editing Charts In Microsoft Excel 2003bud_00
 
Cinema 4D R20 ESSENTIALS
Cinema 4D R20 ESSENTIALSCinema 4D R20 ESSENTIALS
Cinema 4D R20 ESSENTIALSJoe Nasr
 
Geometers Sketchpad Helpful Hints
Geometers Sketchpad Helpful HintsGeometers Sketchpad Helpful Hints
Geometers Sketchpad Helpful Hintsguest9afb8c7
 
Geometria analitica con geogebra secme 22589
Geometria analitica con geogebra secme 22589Geometria analitica con geogebra secme 22589
Geometria analitica con geogebra secme 22589EmilioEscalanteHerna
 
Making a Chart Using Excel
Making a Chart Using ExcelMaking a Chart Using Excel
Making a Chart Using Excelrebelbrindley
 
A GUIDE FOR USING A SOFTWARE TO PLOT THE GRAPHS IN ARTICLES ( GRAPHER OR TECH...
A GUIDE FOR USING A SOFTWARE TO PLOT THE GRAPHS IN ARTICLES ( GRAPHER OR TECH...A GUIDE FOR USING A SOFTWARE TO PLOT THE GRAPHS IN ARTICLES ( GRAPHER OR TECH...
A GUIDE FOR USING A SOFTWARE TO PLOT THE GRAPHS IN ARTICLES ( GRAPHER OR TECH...AirConditioningandRe
 
S7 investigating vectors student worksheet (colour)
S7 investigating vectors   student worksheet (colour)S7 investigating vectors   student worksheet (colour)
S7 investigating vectors student worksheet (colour)jenniech
 
Lecture 10: introduction to computer
Lecture 10: introduction to computerLecture 10: introduction to computer
Lecture 10: introduction to computerSultan Omar Shige
 
3Dimention_lessonA_introMayaModeling.pptx
3Dimention_lessonA_introMayaModeling.pptx3Dimention_lessonA_introMayaModeling.pptx
3Dimention_lessonA_introMayaModeling.pptxFaris Abuhashish
 
Nspire--iPadAppTutorial--Parallel and Perpendicular Lines
Nspire--iPadAppTutorial--Parallel and Perpendicular LinesNspire--iPadAppTutorial--Parallel and Perpendicular Lines
Nspire--iPadAppTutorial--Parallel and Perpendicular LinesMedia4math
 

Similar to GeoGebra 3 (20)

GeoGebra 10
GeoGebra 10GeoGebra 10
GeoGebra 10
 
Geo gebra 2
Geo gebra 2Geo gebra 2
Geo gebra 2
 
Geogebra 5
Geogebra 5Geogebra 5
Geogebra 5
 
Microsoft mathmatics step-by-step_guide
Microsoft mathmatics step-by-step_guideMicrosoft mathmatics step-by-step_guide
Microsoft mathmatics step-by-step_guide
 
Geogebra 8
Geogebra 8Geogebra 8
Geogebra 8
 
On the tomcat drive in folder cosc210 you will find file named Paint.docx
On the tomcat drive in folder cosc210 you will find file named Paint.docxOn the tomcat drive in folder cosc210 you will find file named Paint.docx
On the tomcat drive in folder cosc210 you will find file named Paint.docx
 
For ICT - PPT
For ICT - PPTFor ICT - PPT
For ICT - PPT
 
Geogebra 6
Geogebra 6Geogebra 6
Geogebra 6
 
Ai tool box 1
Ai tool box 1Ai tool box 1
Ai tool box 1
 
Module 6 component of excel chart
Module 6 component of excel chartModule 6 component of excel chart
Module 6 component of excel chart
 
Creating & Editing Charts In Microsoft Excel 2003
Creating & Editing Charts In Microsoft Excel 2003Creating & Editing Charts In Microsoft Excel 2003
Creating & Editing Charts In Microsoft Excel 2003
 
Cinema 4D R20 ESSENTIALS
Cinema 4D R20 ESSENTIALSCinema 4D R20 ESSENTIALS
Cinema 4D R20 ESSENTIALS
 
Geometers Sketchpad Helpful Hints
Geometers Sketchpad Helpful HintsGeometers Sketchpad Helpful Hints
Geometers Sketchpad Helpful Hints
 
Geometria analitica con geogebra secme 22589
Geometria analitica con geogebra secme 22589Geometria analitica con geogebra secme 22589
Geometria analitica con geogebra secme 22589
 
Making a Chart Using Excel
Making a Chart Using ExcelMaking a Chart Using Excel
Making a Chart Using Excel
 
A GUIDE FOR USING A SOFTWARE TO PLOT THE GRAPHS IN ARTICLES ( GRAPHER OR TECH...
A GUIDE FOR USING A SOFTWARE TO PLOT THE GRAPHS IN ARTICLES ( GRAPHER OR TECH...A GUIDE FOR USING A SOFTWARE TO PLOT THE GRAPHS IN ARTICLES ( GRAPHER OR TECH...
A GUIDE FOR USING A SOFTWARE TO PLOT THE GRAPHS IN ARTICLES ( GRAPHER OR TECH...
 
S7 investigating vectors student worksheet (colour)
S7 investigating vectors   student worksheet (colour)S7 investigating vectors   student worksheet (colour)
S7 investigating vectors student worksheet (colour)
 
Lecture 10: introduction to computer
Lecture 10: introduction to computerLecture 10: introduction to computer
Lecture 10: introduction to computer
 
3Dimention_lessonA_introMayaModeling.pptx
3Dimention_lessonA_introMayaModeling.pptx3Dimention_lessonA_introMayaModeling.pptx
3Dimention_lessonA_introMayaModeling.pptx
 
Nspire--iPadAppTutorial--Parallel and Perpendicular Lines
Nspire--iPadAppTutorial--Parallel and Perpendicular LinesNspire--iPadAppTutorial--Parallel and Perpendicular Lines
Nspire--iPadAppTutorial--Parallel and Perpendicular Lines
 

Recently uploaded

Implementing Zero Trust strategy with Azure
Implementing Zero Trust strategy with AzureImplementing Zero Trust strategy with Azure
Implementing Zero Trust strategy with AzureDinusha Kumarasiri
 
What is Fashion PLM and Why Do You Need It
What is Fashion PLM and Why Do You Need ItWhat is Fashion PLM and Why Do You Need It
What is Fashion PLM and Why Do You Need ItWave PLM
 
software engineering Chapter 5 System modeling.pptx
software engineering Chapter 5 System modeling.pptxsoftware engineering Chapter 5 System modeling.pptx
software engineering Chapter 5 System modeling.pptxnada99848
 
Adobe Marketo Engage Deep Dives: Using Webhooks to Transfer Data
Adobe Marketo Engage Deep Dives: Using Webhooks to Transfer DataAdobe Marketo Engage Deep Dives: Using Webhooks to Transfer Data
Adobe Marketo Engage Deep Dives: Using Webhooks to Transfer DataBradBedford3
 
Building Real-Time Data Pipelines: Stream & Batch Processing workshop Slide
Building Real-Time Data Pipelines: Stream & Batch Processing workshop SlideBuilding Real-Time Data Pipelines: Stream & Batch Processing workshop Slide
Building Real-Time Data Pipelines: Stream & Batch Processing workshop SlideChristina Lin
 
Folding Cheat Sheet #4 - fourth in a series
Folding Cheat Sheet #4 - fourth in a seriesFolding Cheat Sheet #4 - fourth in a series
Folding Cheat Sheet #4 - fourth in a seriesPhilip Schwarz
 
Alluxio Monthly Webinar | Cloud-Native Model Training on Distributed Data
Alluxio Monthly Webinar | Cloud-Native Model Training on Distributed DataAlluxio Monthly Webinar | Cloud-Native Model Training on Distributed Data
Alluxio Monthly Webinar | Cloud-Native Model Training on Distributed DataAlluxio, Inc.
 
Cloud Data Center Network Construction - IEEE
Cloud Data Center Network Construction - IEEECloud Data Center Network Construction - IEEE
Cloud Data Center Network Construction - IEEEVICTOR MAESTRE RAMIREZ
 
(Genuine) Escort Service Lucknow | Starting ₹,5K To @25k with A/C 🧑🏽‍❤️‍🧑🏻 89...
(Genuine) Escort Service Lucknow | Starting ₹,5K To @25k with A/C 🧑🏽‍❤️‍🧑🏻 89...(Genuine) Escort Service Lucknow | Starting ₹,5K To @25k with A/C 🧑🏽‍❤️‍🧑🏻 89...
(Genuine) Escort Service Lucknow | Starting ₹,5K To @25k with A/C 🧑🏽‍❤️‍🧑🏻 89...gurkirankumar98700
 
Dealing with Cultural Dispersion — Stefano Lambiase — ICSE-SEIS 2024
Dealing with Cultural Dispersion — Stefano Lambiase — ICSE-SEIS 2024Dealing with Cultural Dispersion — Stefano Lambiase — ICSE-SEIS 2024
Dealing with Cultural Dispersion — Stefano Lambiase — ICSE-SEIS 2024StefanoLambiase
 
BATTLEFIELD ORM: TIPS, TACTICS AND STRATEGIES FOR CONQUERING YOUR DATABASE
BATTLEFIELD ORM: TIPS, TACTICS AND STRATEGIES FOR CONQUERING YOUR DATABASEBATTLEFIELD ORM: TIPS, TACTICS AND STRATEGIES FOR CONQUERING YOUR DATABASE
BATTLEFIELD ORM: TIPS, TACTICS AND STRATEGIES FOR CONQUERING YOUR DATABASEOrtus Solutions, Corp
 
MYjobs Presentation Django-based project
MYjobs Presentation Django-based projectMYjobs Presentation Django-based project
MYjobs Presentation Django-based projectAnoyGreter
 
chapter--4-software-project-planning.ppt
chapter--4-software-project-planning.pptchapter--4-software-project-planning.ppt
chapter--4-software-project-planning.pptkotipi9215
 
Russian Call Girls in Karol Bagh Aasnvi ➡️ 8264348440 💋📞 Independent Escort S...
Russian Call Girls in Karol Bagh Aasnvi ➡️ 8264348440 💋📞 Independent Escort S...Russian Call Girls in Karol Bagh Aasnvi ➡️ 8264348440 💋📞 Independent Escort S...
Russian Call Girls in Karol Bagh Aasnvi ➡️ 8264348440 💋📞 Independent Escort S...soniya singh
 
GOING AOT WITH GRAALVM – DEVOXX GREECE.pdf
GOING AOT WITH GRAALVM – DEVOXX GREECE.pdfGOING AOT WITH GRAALVM – DEVOXX GREECE.pdf
GOING AOT WITH GRAALVM – DEVOXX GREECE.pdfAlina Yurenko
 
KnowAPIs-UnknownPerf-jaxMainz-2024 (1).pptx
KnowAPIs-UnknownPerf-jaxMainz-2024 (1).pptxKnowAPIs-UnknownPerf-jaxMainz-2024 (1).pptx
KnowAPIs-UnknownPerf-jaxMainz-2024 (1).pptxTier1 app
 
Building a General PDE Solving Framework with Symbolic-Numeric Scientific Mac...
Building a General PDE Solving Framework with Symbolic-Numeric Scientific Mac...Building a General PDE Solving Framework with Symbolic-Numeric Scientific Mac...
Building a General PDE Solving Framework with Symbolic-Numeric Scientific Mac...stazi3110
 
Automate your Kamailio Test Calls - Kamailio World 2024
Automate your Kamailio Test Calls - Kamailio World 2024Automate your Kamailio Test Calls - Kamailio World 2024
Automate your Kamailio Test Calls - Kamailio World 2024Andreas Granig
 
办理学位证(UQ文凭证书)昆士兰大学毕业证成绩单原版一模一样
办理学位证(UQ文凭证书)昆士兰大学毕业证成绩单原版一模一样办理学位证(UQ文凭证书)昆士兰大学毕业证成绩单原版一模一样
办理学位证(UQ文凭证书)昆士兰大学毕业证成绩单原版一模一样umasea
 

Recently uploaded (20)

Implementing Zero Trust strategy with Azure
Implementing Zero Trust strategy with AzureImplementing Zero Trust strategy with Azure
Implementing Zero Trust strategy with Azure
 
What is Fashion PLM and Why Do You Need It
What is Fashion PLM and Why Do You Need ItWhat is Fashion PLM and Why Do You Need It
What is Fashion PLM and Why Do You Need It
 
software engineering Chapter 5 System modeling.pptx
software engineering Chapter 5 System modeling.pptxsoftware engineering Chapter 5 System modeling.pptx
software engineering Chapter 5 System modeling.pptx
 
Adobe Marketo Engage Deep Dives: Using Webhooks to Transfer Data
Adobe Marketo Engage Deep Dives: Using Webhooks to Transfer DataAdobe Marketo Engage Deep Dives: Using Webhooks to Transfer Data
Adobe Marketo Engage Deep Dives: Using Webhooks to Transfer Data
 
Building Real-Time Data Pipelines: Stream & Batch Processing workshop Slide
Building Real-Time Data Pipelines: Stream & Batch Processing workshop SlideBuilding Real-Time Data Pipelines: Stream & Batch Processing workshop Slide
Building Real-Time Data Pipelines: Stream & Batch Processing workshop Slide
 
Folding Cheat Sheet #4 - fourth in a series
Folding Cheat Sheet #4 - fourth in a seriesFolding Cheat Sheet #4 - fourth in a series
Folding Cheat Sheet #4 - fourth in a series
 
Alluxio Monthly Webinar | Cloud-Native Model Training on Distributed Data
Alluxio Monthly Webinar | Cloud-Native Model Training on Distributed DataAlluxio Monthly Webinar | Cloud-Native Model Training on Distributed Data
Alluxio Monthly Webinar | Cloud-Native Model Training on Distributed Data
 
Cloud Data Center Network Construction - IEEE
Cloud Data Center Network Construction - IEEECloud Data Center Network Construction - IEEE
Cloud Data Center Network Construction - IEEE
 
(Genuine) Escort Service Lucknow | Starting ₹,5K To @25k with A/C 🧑🏽‍❤️‍🧑🏻 89...
(Genuine) Escort Service Lucknow | Starting ₹,5K To @25k with A/C 🧑🏽‍❤️‍🧑🏻 89...(Genuine) Escort Service Lucknow | Starting ₹,5K To @25k with A/C 🧑🏽‍❤️‍🧑🏻 89...
(Genuine) Escort Service Lucknow | Starting ₹,5K To @25k with A/C 🧑🏽‍❤️‍🧑🏻 89...
 
Dealing with Cultural Dispersion — Stefano Lambiase — ICSE-SEIS 2024
Dealing with Cultural Dispersion — Stefano Lambiase — ICSE-SEIS 2024Dealing with Cultural Dispersion — Stefano Lambiase — ICSE-SEIS 2024
Dealing with Cultural Dispersion — Stefano Lambiase — ICSE-SEIS 2024
 
BATTLEFIELD ORM: TIPS, TACTICS AND STRATEGIES FOR CONQUERING YOUR DATABASE
BATTLEFIELD ORM: TIPS, TACTICS AND STRATEGIES FOR CONQUERING YOUR DATABASEBATTLEFIELD ORM: TIPS, TACTICS AND STRATEGIES FOR CONQUERING YOUR DATABASE
BATTLEFIELD ORM: TIPS, TACTICS AND STRATEGIES FOR CONQUERING YOUR DATABASE
 
MYjobs Presentation Django-based project
MYjobs Presentation Django-based projectMYjobs Presentation Django-based project
MYjobs Presentation Django-based project
 
chapter--4-software-project-planning.ppt
chapter--4-software-project-planning.pptchapter--4-software-project-planning.ppt
chapter--4-software-project-planning.ppt
 
Russian Call Girls in Karol Bagh Aasnvi ➡️ 8264348440 💋📞 Independent Escort S...
Russian Call Girls in Karol Bagh Aasnvi ➡️ 8264348440 💋📞 Independent Escort S...Russian Call Girls in Karol Bagh Aasnvi ➡️ 8264348440 💋📞 Independent Escort S...
Russian Call Girls in Karol Bagh Aasnvi ➡️ 8264348440 💋📞 Independent Escort S...
 
GOING AOT WITH GRAALVM – DEVOXX GREECE.pdf
GOING AOT WITH GRAALVM – DEVOXX GREECE.pdfGOING AOT WITH GRAALVM – DEVOXX GREECE.pdf
GOING AOT WITH GRAALVM – DEVOXX GREECE.pdf
 
KnowAPIs-UnknownPerf-jaxMainz-2024 (1).pptx
KnowAPIs-UnknownPerf-jaxMainz-2024 (1).pptxKnowAPIs-UnknownPerf-jaxMainz-2024 (1).pptx
KnowAPIs-UnknownPerf-jaxMainz-2024 (1).pptx
 
Building a General PDE Solving Framework with Symbolic-Numeric Scientific Mac...
Building a General PDE Solving Framework with Symbolic-Numeric Scientific Mac...Building a General PDE Solving Framework with Symbolic-Numeric Scientific Mac...
Building a General PDE Solving Framework with Symbolic-Numeric Scientific Mac...
 
Hot Sexy call girls in Patel Nagar🔝 9953056974 🔝 escort Service
Hot Sexy call girls in Patel Nagar🔝 9953056974 🔝 escort ServiceHot Sexy call girls in Patel Nagar🔝 9953056974 🔝 escort Service
Hot Sexy call girls in Patel Nagar🔝 9953056974 🔝 escort Service
 
Automate your Kamailio Test Calls - Kamailio World 2024
Automate your Kamailio Test Calls - Kamailio World 2024Automate your Kamailio Test Calls - Kamailio World 2024
Automate your Kamailio Test Calls - Kamailio World 2024
 
办理学位证(UQ文凭证书)昆士兰大学毕业证成绩单原版一模一样
办理学位证(UQ文凭证书)昆士兰大学毕业证成绩单原版一模一样办理学位证(UQ文凭证书)昆士兰大学毕业证成绩单原版一模一样
办理学位证(UQ文凭证书)昆士兰大学毕业证成绩单原版一模一样
 

GeoGebra 3

  • 1.
  • 2. Contents Functions and Coordinates Parameters of linear equations Quadratic polynomials
  • 3. Functions and Coordinates Creating new objects You can create new objects (e.g. points, lines, functions) by either using the Graphics Tools provided in the Toolbar, or by entering their equations and coordinates into the Input Bar. Task • Enter the following equations and coordinates into the Input Bar to graph functions and points.
  • 4. Creating new objects 1. Enter the equation y = 3x + 1 into the Input Bar and press the Enter key. 2. Enter the function g(x) = x² + 2 into the Input Bar and press the Enter key.
  • 5. Creating new objects 3. Enter B = (2, 1) into the Input Bar and press Enter to create a new point. Create another new point C = (-1, 3).
  • 6. Creating new objects 4. Select the Line tool from the Toolbar and click twice in the Graphics View or on the two existing points B and C to create a line.
  • 7. Virtual Keyboard Hint: Click on the keyboard icon to open a Virtual Keyboard whenever you want to use it to enter mathematical expressions.
  • 8. Modifying existing objects You can drag existing objects in the Graphics View, or change their equations and coordinates in the Algebra View. 1. Select an object in the Algebra View to directly change its equation or coordinates, or redefine it 2.Select the Move tool and drag objects in the Graphics View to change their position.
  • 9. Deleting objects You can delete objects that you created in one of the following ways: Select the Undo button to undo the last object(s) you created. Use the Delete tool to delete any object you created. Hint: Click on the last Tool icon to open the corresponding Toolbox. Select the Delete tool from the Toolbox and click on the object(s) you want to delete.
  • 10. Parameters of linear equations Creating sliders in the Algebra View When you enter a letter different from x and y in the Input Bar, which hasn't been defined previously, GeoGebra will create a slider in the Algebra View after pressing Enter. Note: You can display the slider in the Graphics View by selecting the disabled Visibility button next to the number in the Algebra View. Task Graph a linear equation y = m x + b which parameters can be modified using sliders. Display the slope of the corresponding line and visualize the y-intercept.
  • 11. Creating sliders in the Algebra View Enter y = m x + b into the Input Bar and hit the Enter key. Hint: GeoGebra will automatically create sliders for the parameters m and b when pressing Enter. To show the sliders in the Graphics View, select the disabled Visibility button in the Algebra View on the left of the variables. Visibility Button
  • 12. Creating sliders in the Algebra View Create the intersection point A between the line and the y-axis. Hint: You may either use the Intersect tool you can find in the Toolbox for points by selecting the two objects, or use the command Intersect(f, yAxis).
  • 13. Creating sliders in the Algebra View You can find the Intersect tool in the Toolbox
  • 14. Creating sliders in the Algebra View Create a point B at the origin using the Intersect tool and selecting the two axis.
  • 15. Creating sliders in the Algebra View Select the Segment tool from the Toolbox for lines and create a segment between points A and B by selecting both points.
  • 16. Creating sliders in the Algebra View Hint: Alternatively, you can use the command Segment(A, B) as well.
  • 17. Creating sliders in the Algebra View Hide points A and B by clicking on the corresponding enabled Visibility buttons on the left of their coordinates in the Algebra View.
  • 18. Creating sliders in the Algebra View Use the Slope tool from the Measure Toolbox to create the slope (triangle) of the line by clicking on the line
  • 19. Creating sliders in the Algebra View The slope (triangle) of the line
  • 20. Creating sliders in the Algebra View Enhance the appearance of your construction using the Style Bar (e.g., increase the line thickness of the segment to make it visible on top of the y- axis).
  • 21. Change a slider's position in the Graphics View By default, the position of a slider is absolute on screen. This way, you can change its value using the Move tool without moving the whole slider accidentally. To change the position of a slider you can either... 1.select the Slider tool and drag the slider to a new position. 2. right-drag the slider to change its position (use the right key of your mouse if available).
  • 22. Quadratic polynomials Task Explore the impact of parameters on a quadratic polynomial by either moving the function graph or changing its equation. Type f(x) = x^2 into the Input Bar and hit the Enter key. Which shape does the function graph have?
  • 23. Quadratic polynomials Use the Move tool and select the function. Click on the Style Bar and select the padlock button to unfix the function and to be able to drag the function in the Graphics View and watch how the equation in the Algebra View adapts to your changes.
  • 24. Quadratic polynomials Change the function graph so that the corresponding equation matches f(x) = (x + 2)² f(x) = x² - 3, and f(x) = (x - 4)² + 2.
  • 25. Quadratic polynomials Task Select the equation of the polynomial. Use the keyboard to change the equation to f(x) = 3x². How does the function graph change? Repeat changing the equation by typing in different values for the parameter (e.g. 0.5, -2, -0.8, 3).
  • 26. Parameters of a polynomial Task Graph a cubic polynomial f(x) = a x³ + b x² + c x + d whose parameters can be changed using sliders. In addition, display the roots and local extrema with their corresponding tangents. Explore the construction...
  • 27. Do It Yourself 1. Enter f(x) = ax³ + bx² + cx + d into the Input Bar and hit the Enter key. Hint: GeoGebra will automatically create sliders for the parameters a, b, c, and d. 2.Show the sliders in the Graphics View by selecting the disabled Visibility buttons on the left of the corresponding entries in the Algebra View.
  • 28. Do It Yourself 3. Use the sliders in the Graphics View to change the values of the parameters with the Move tool to a = 0.2, b = -1.2, c = 0.6 and d = 2. 4. Enter R = Root(f) into the Input Bar to display the roots of the polynomial and automatically name themR1, R2 and R3. 5. Enter E = Extremum(f) to display the local extrema of the polynomial.
  • 29. Do It Yourself 6.Use the Tangent tool to create the tangents to the polynomial through the extrema E1 and E2. Hint: Open the Toolbox of Special Lines and select the Tangent tool. Successively select point E1 and the polynomial to create the tangent. Repeat for point E2.
  • 30. Do It Yourself 7.Systematically change the values of the sliders using the Move tool to explore how the parameters affect the polynomial.