Download as ODP, PPTX
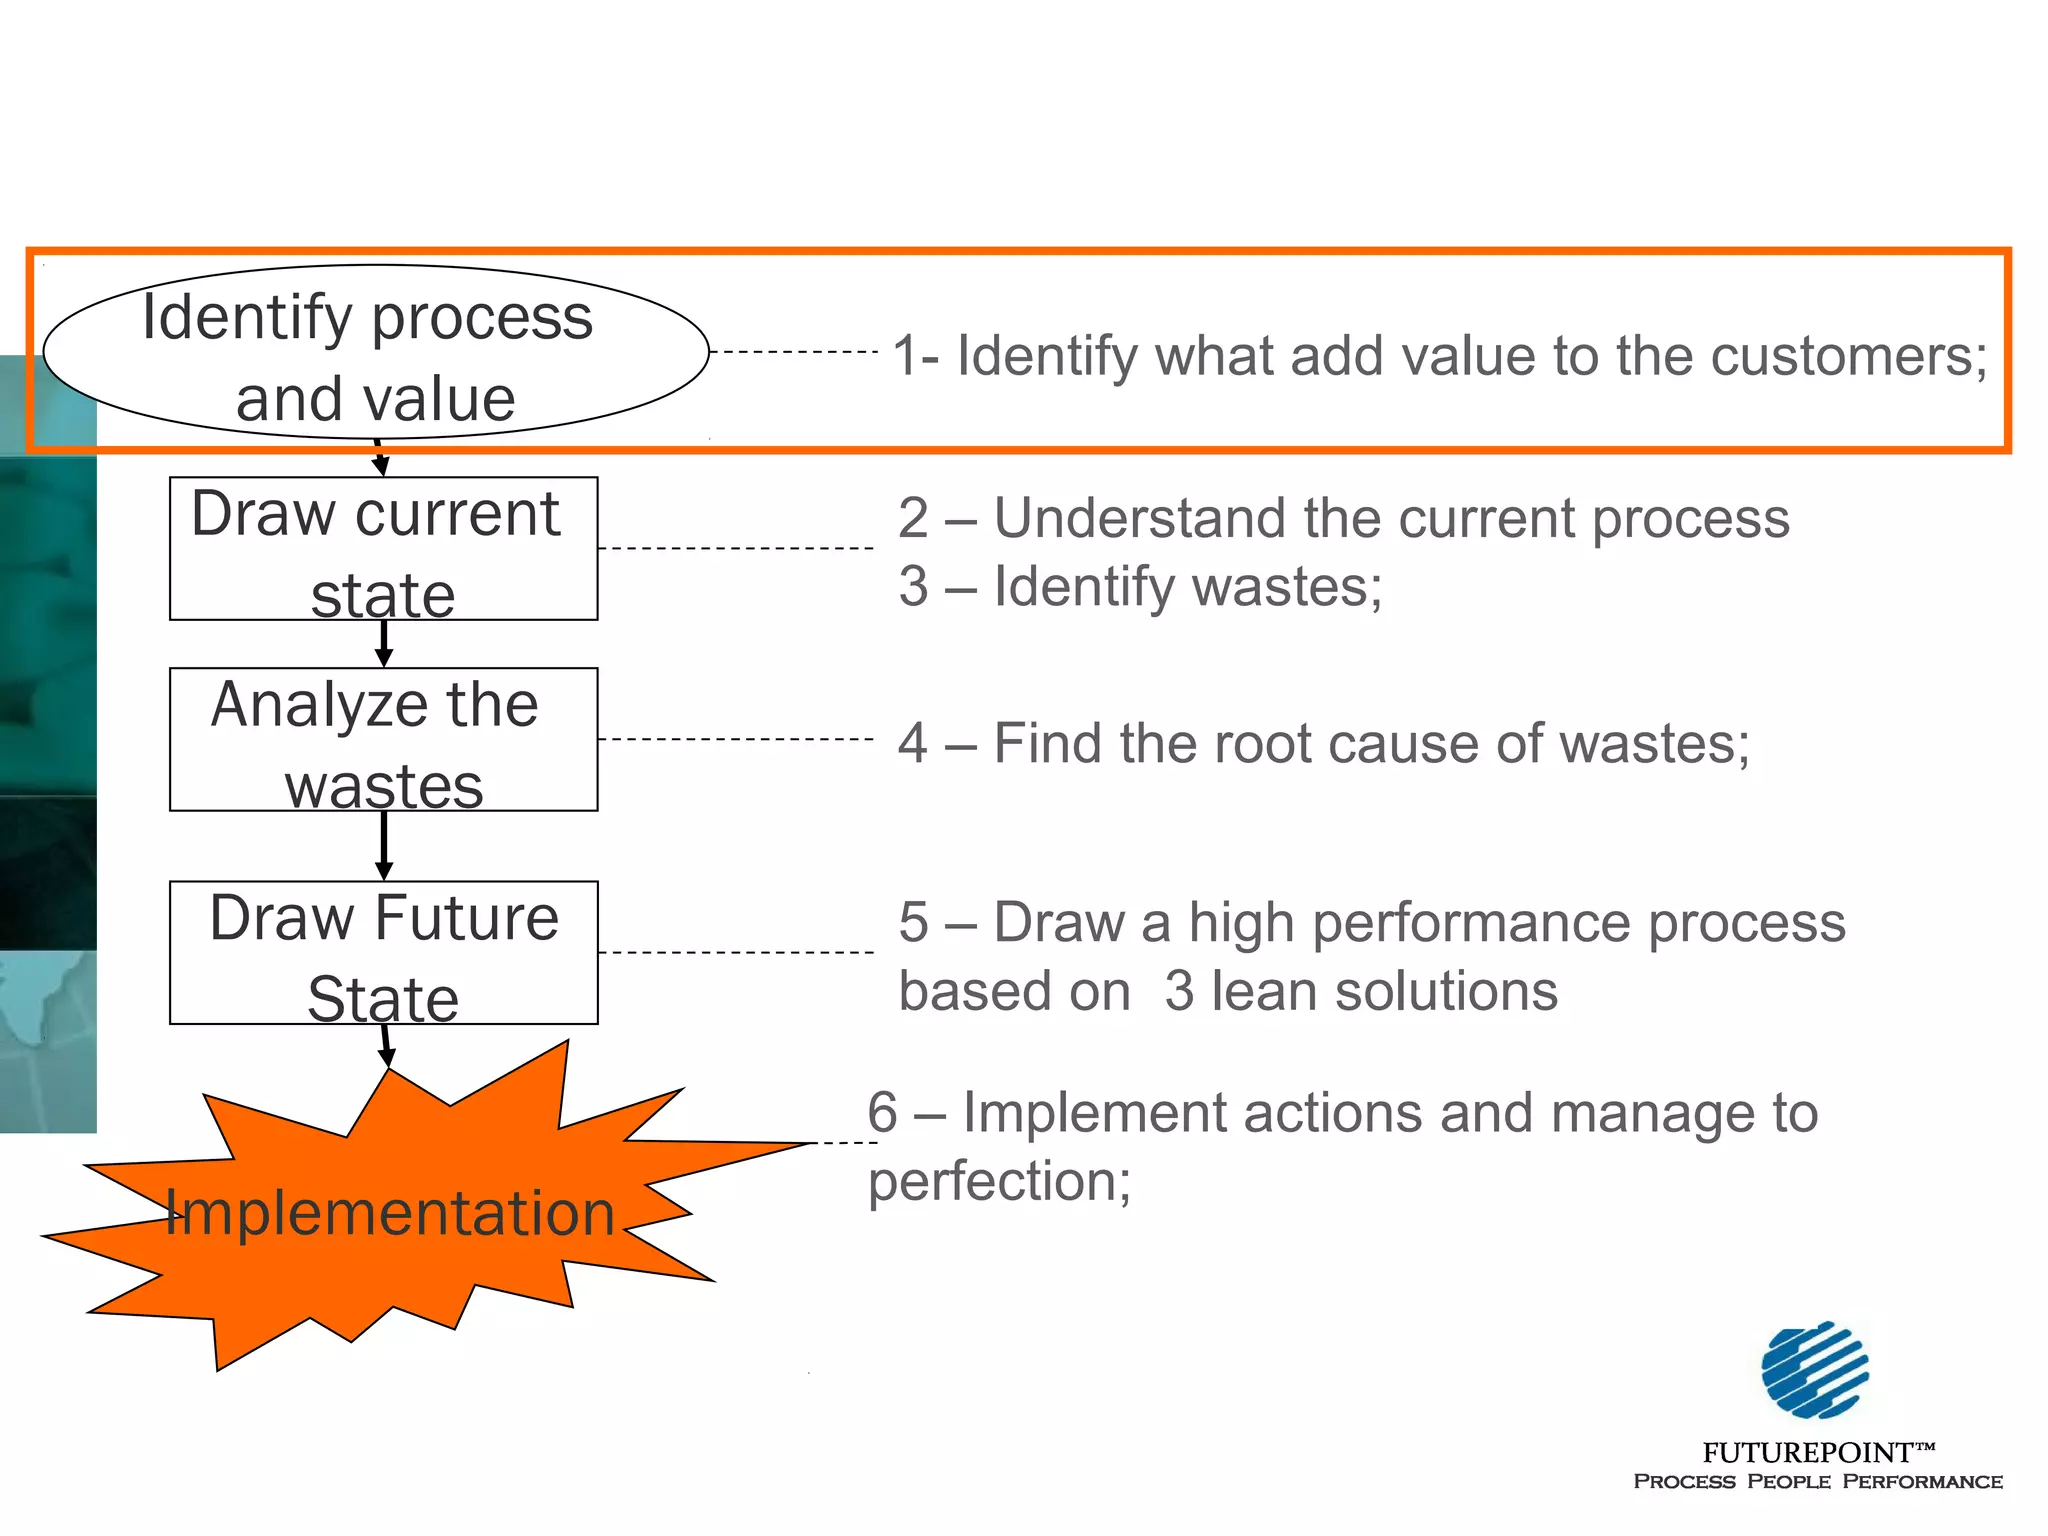
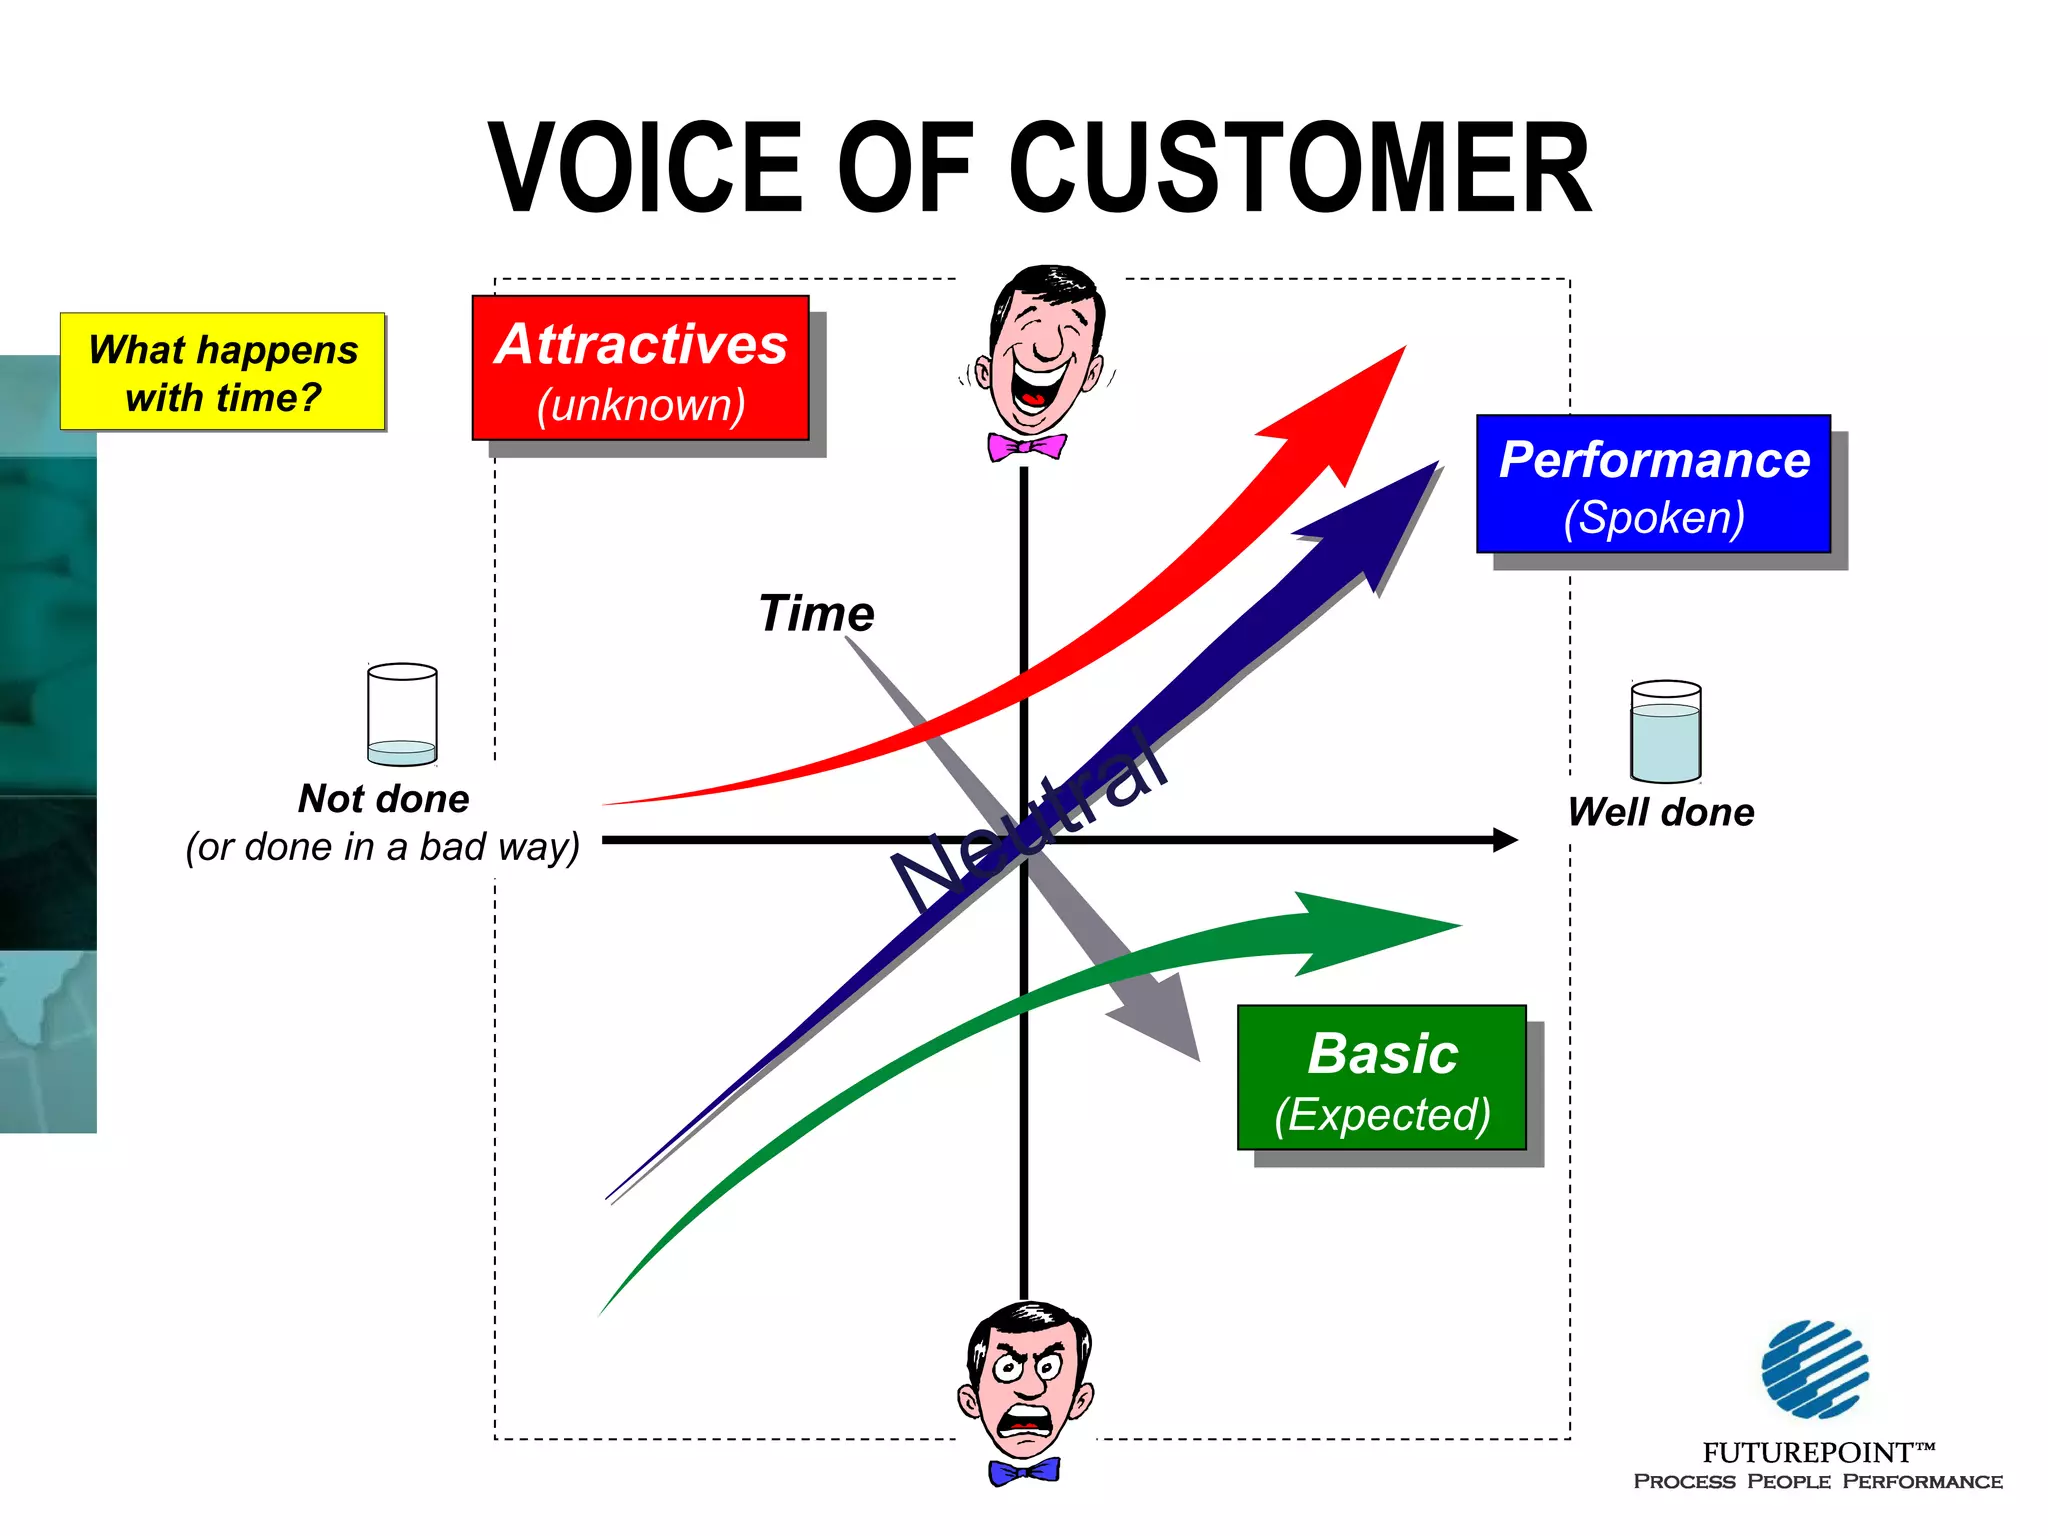
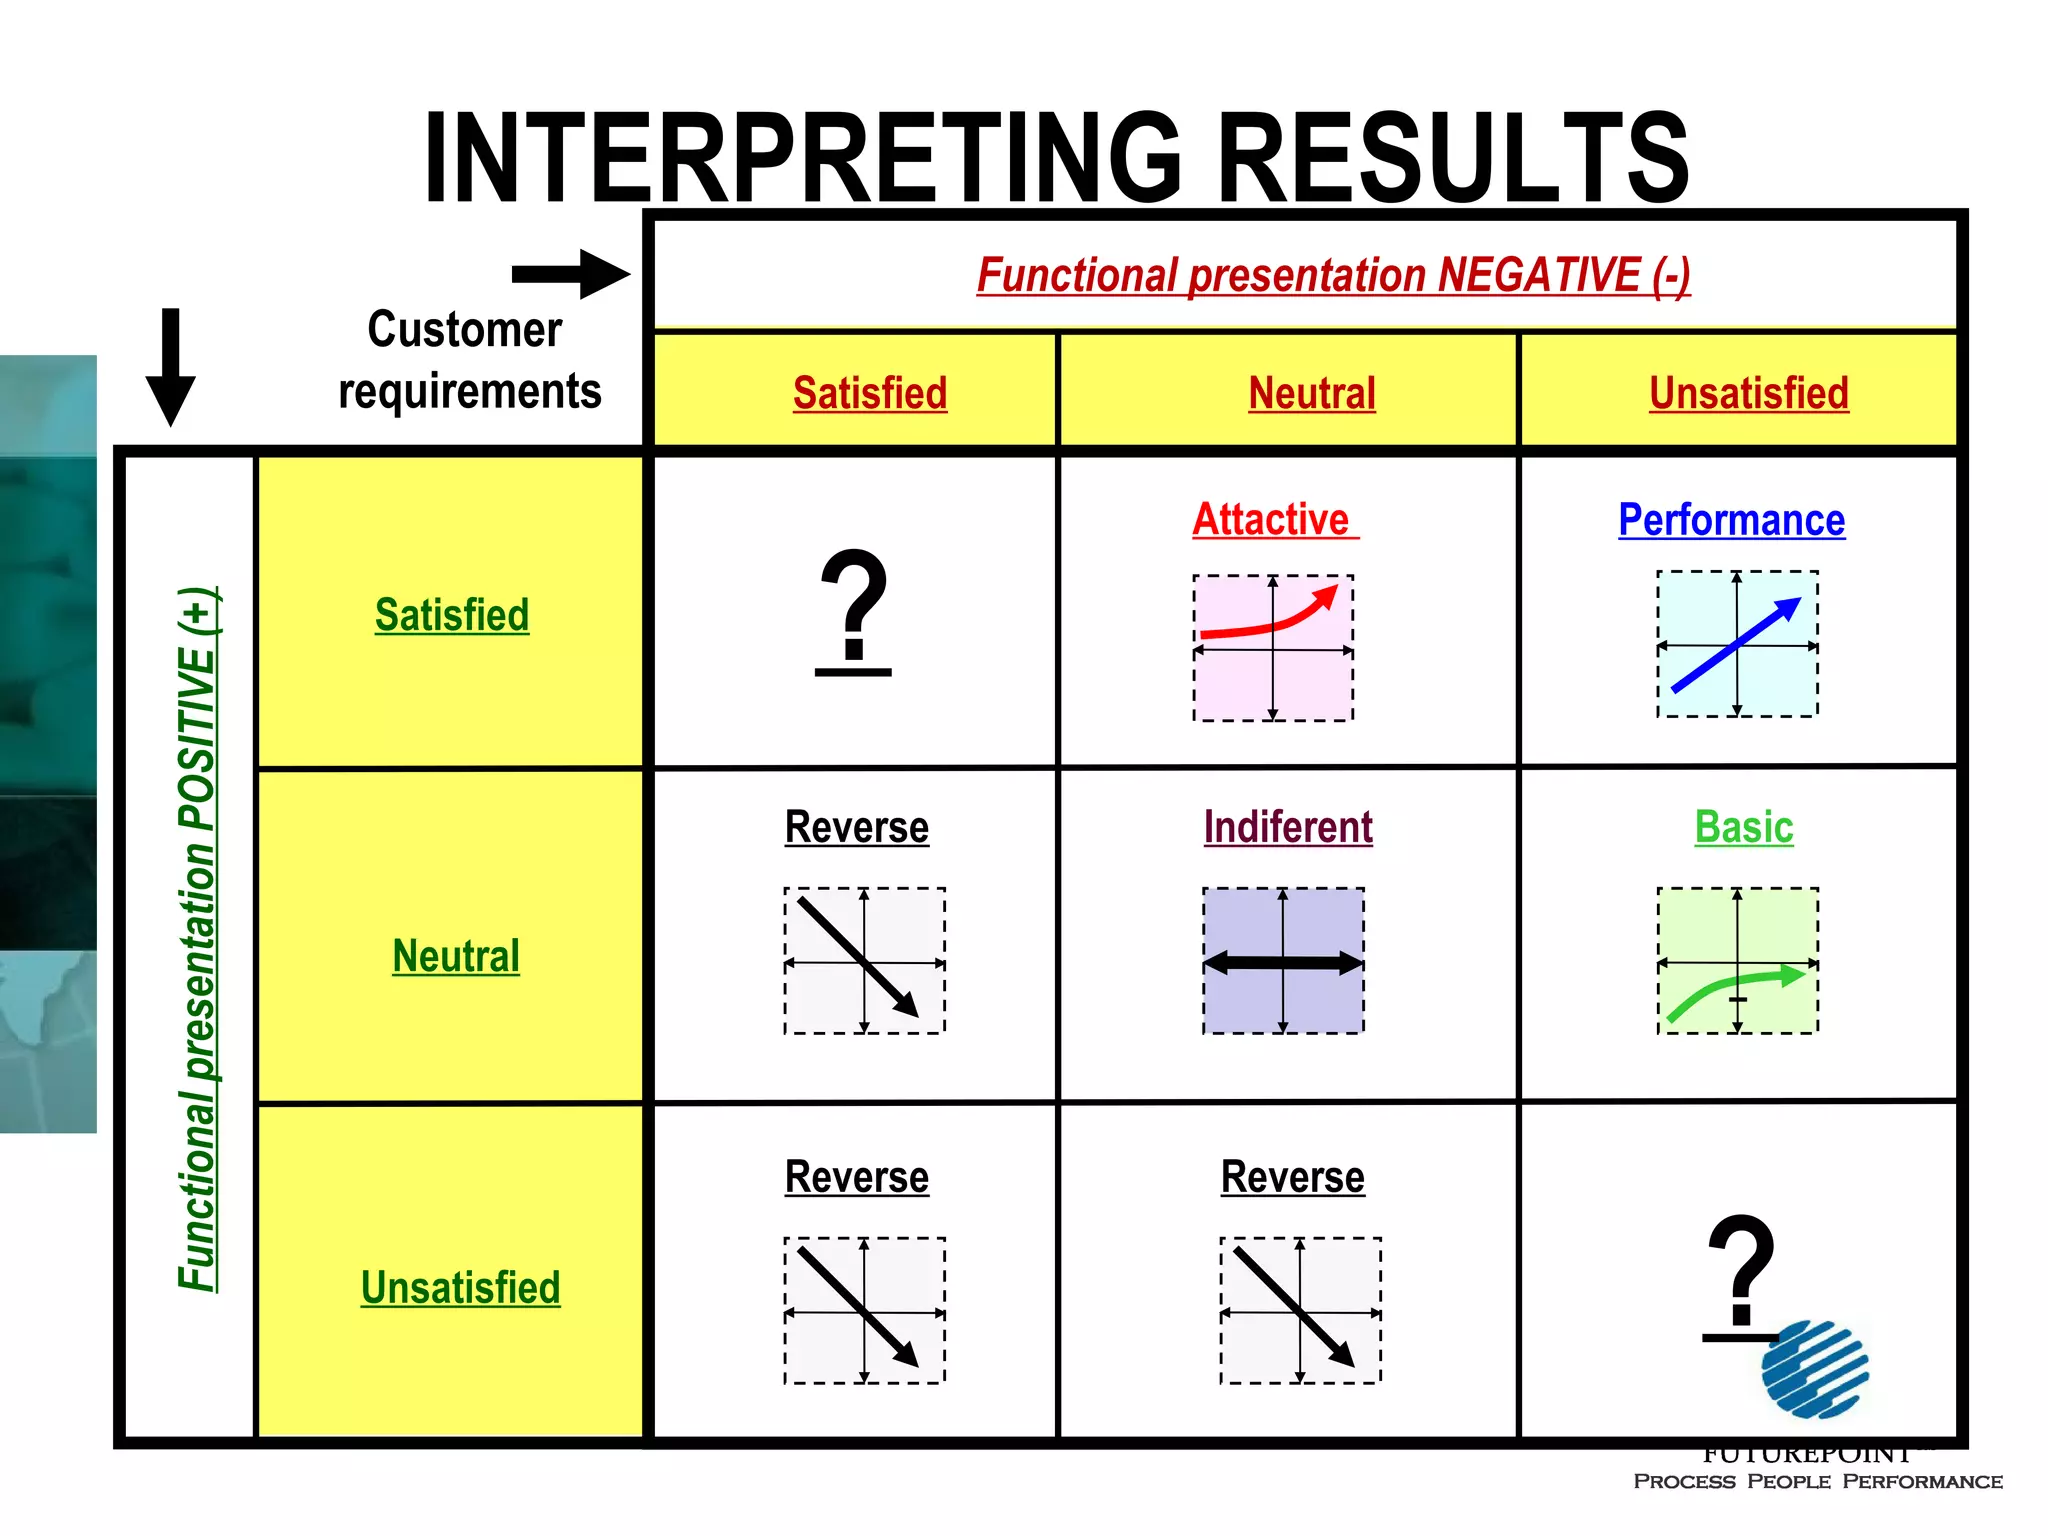
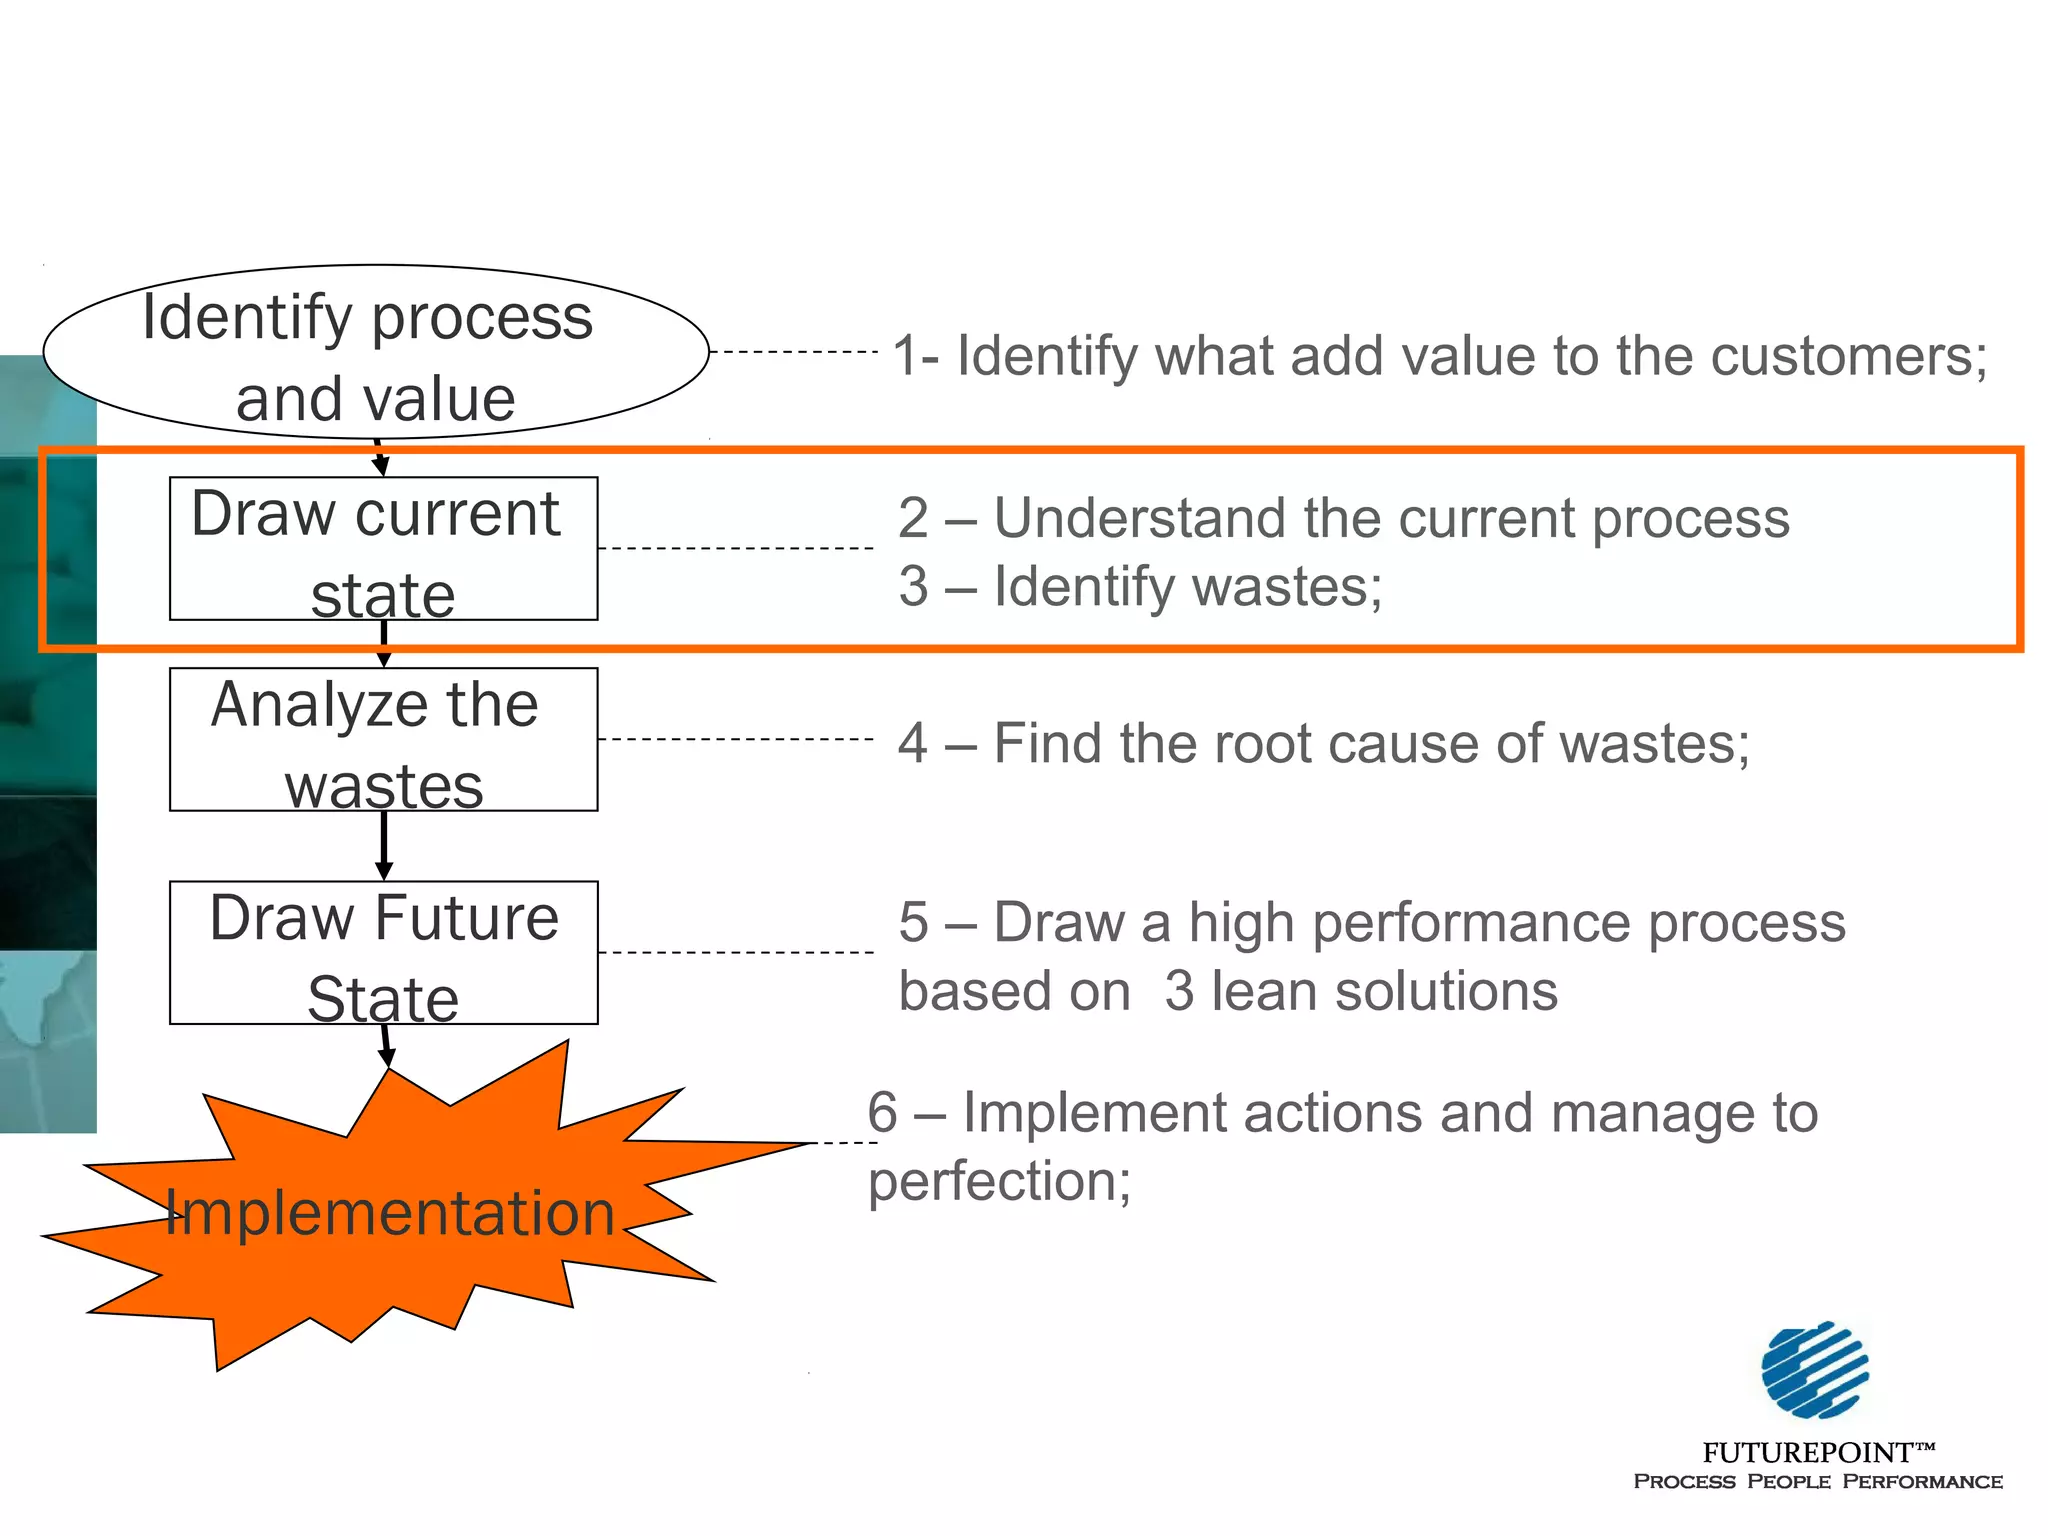
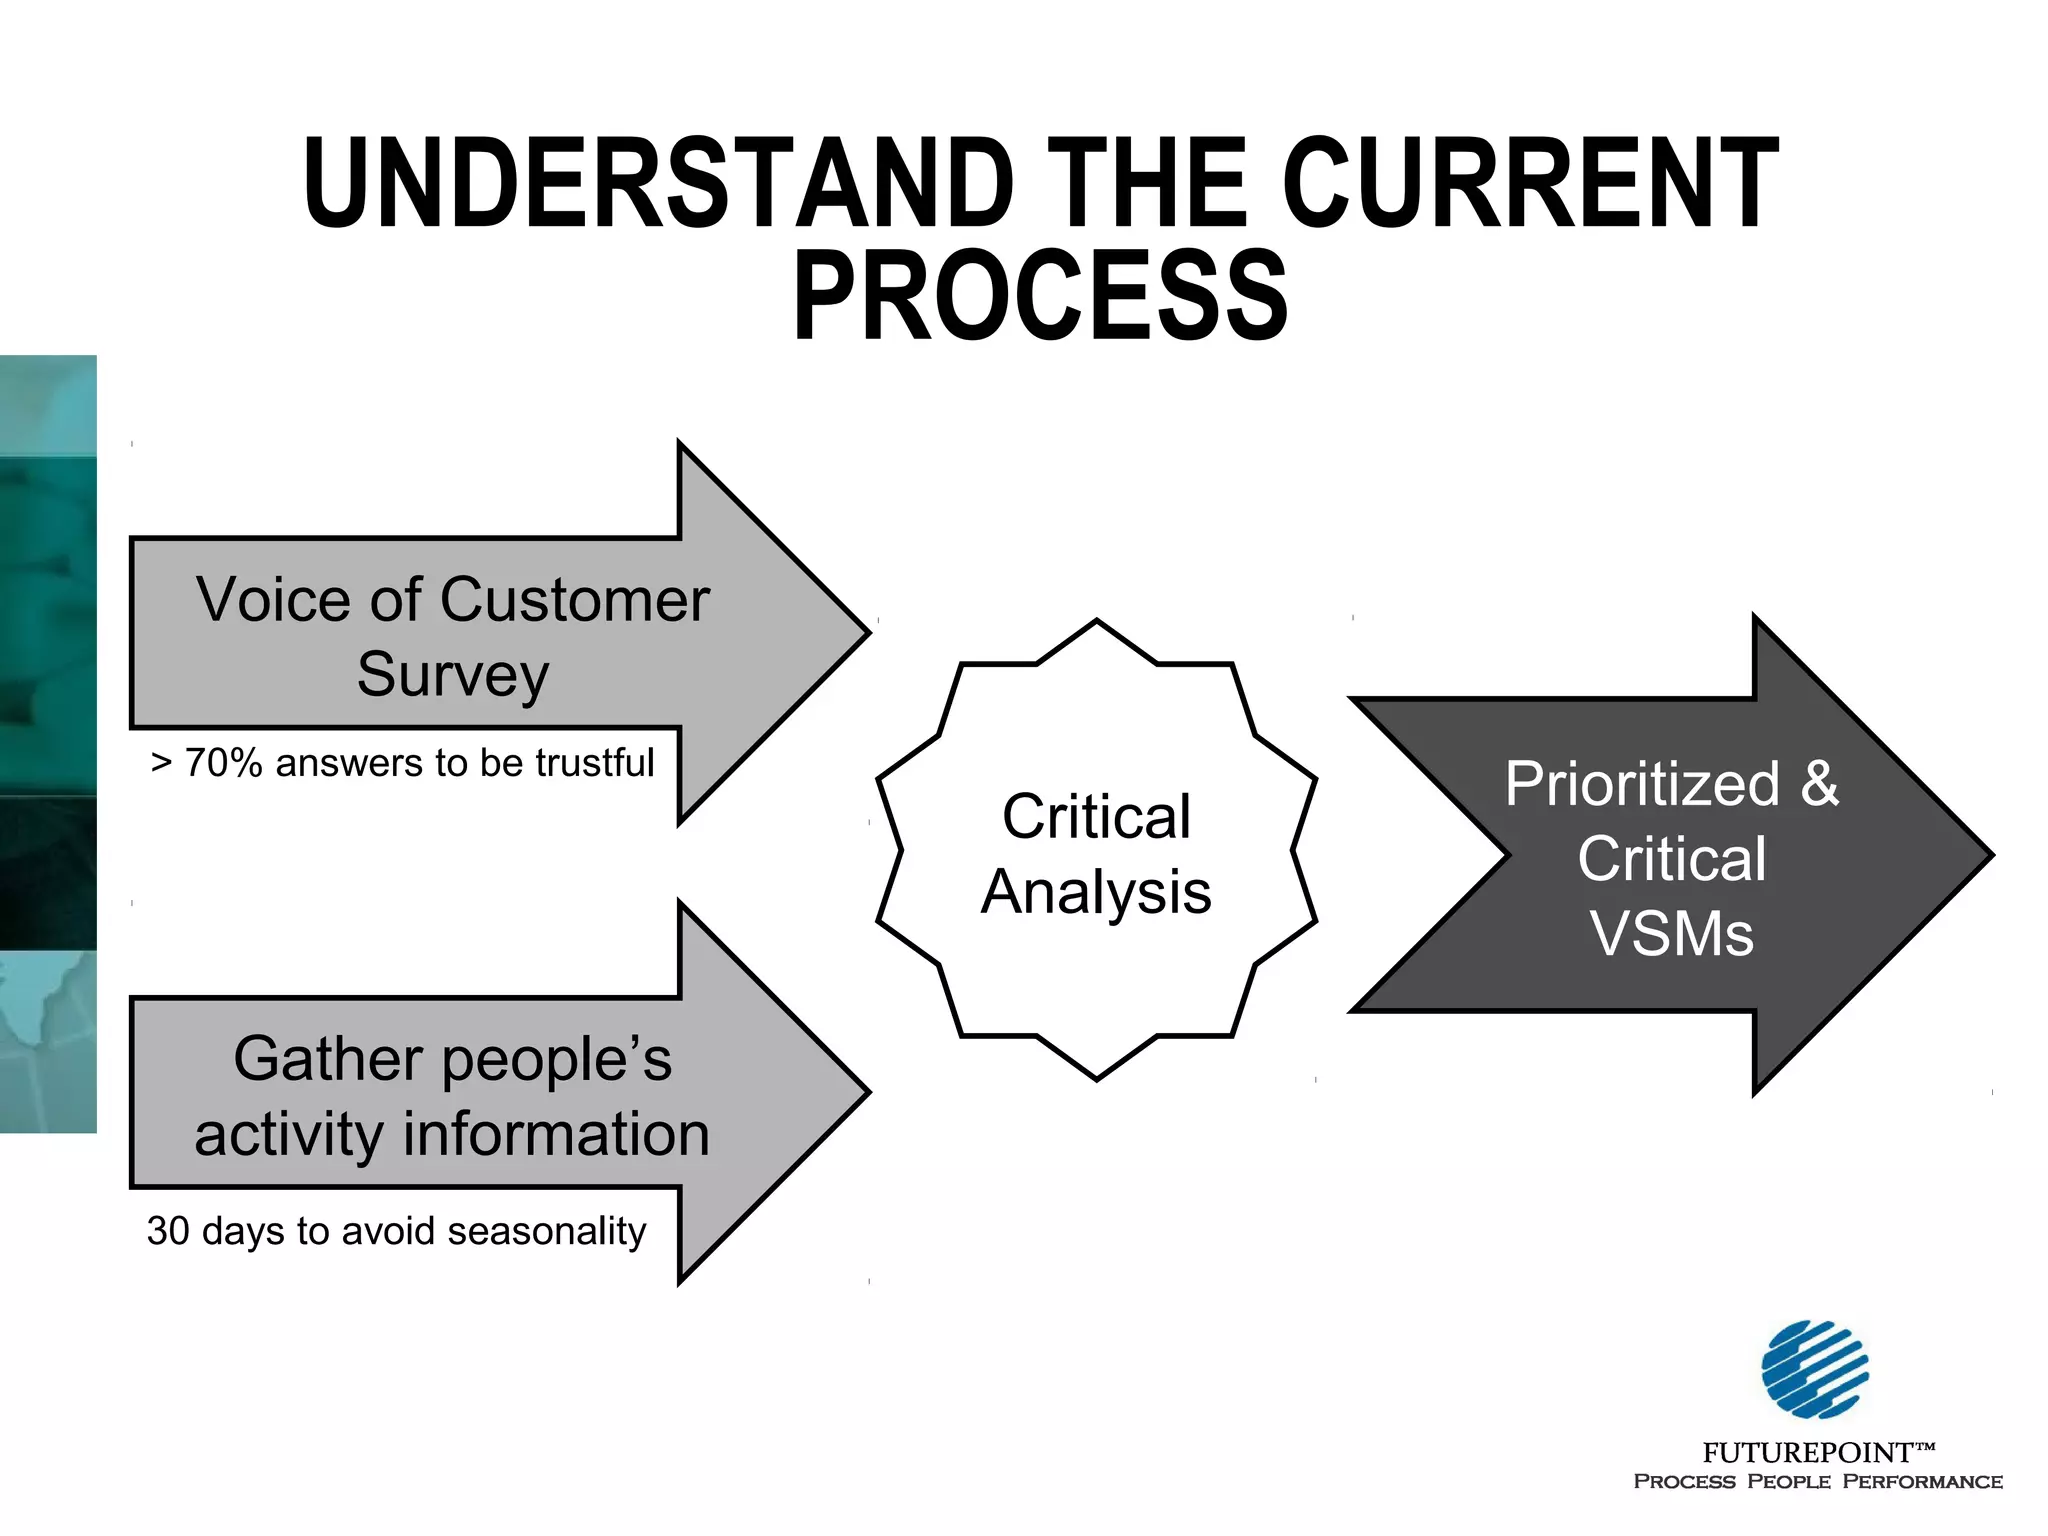
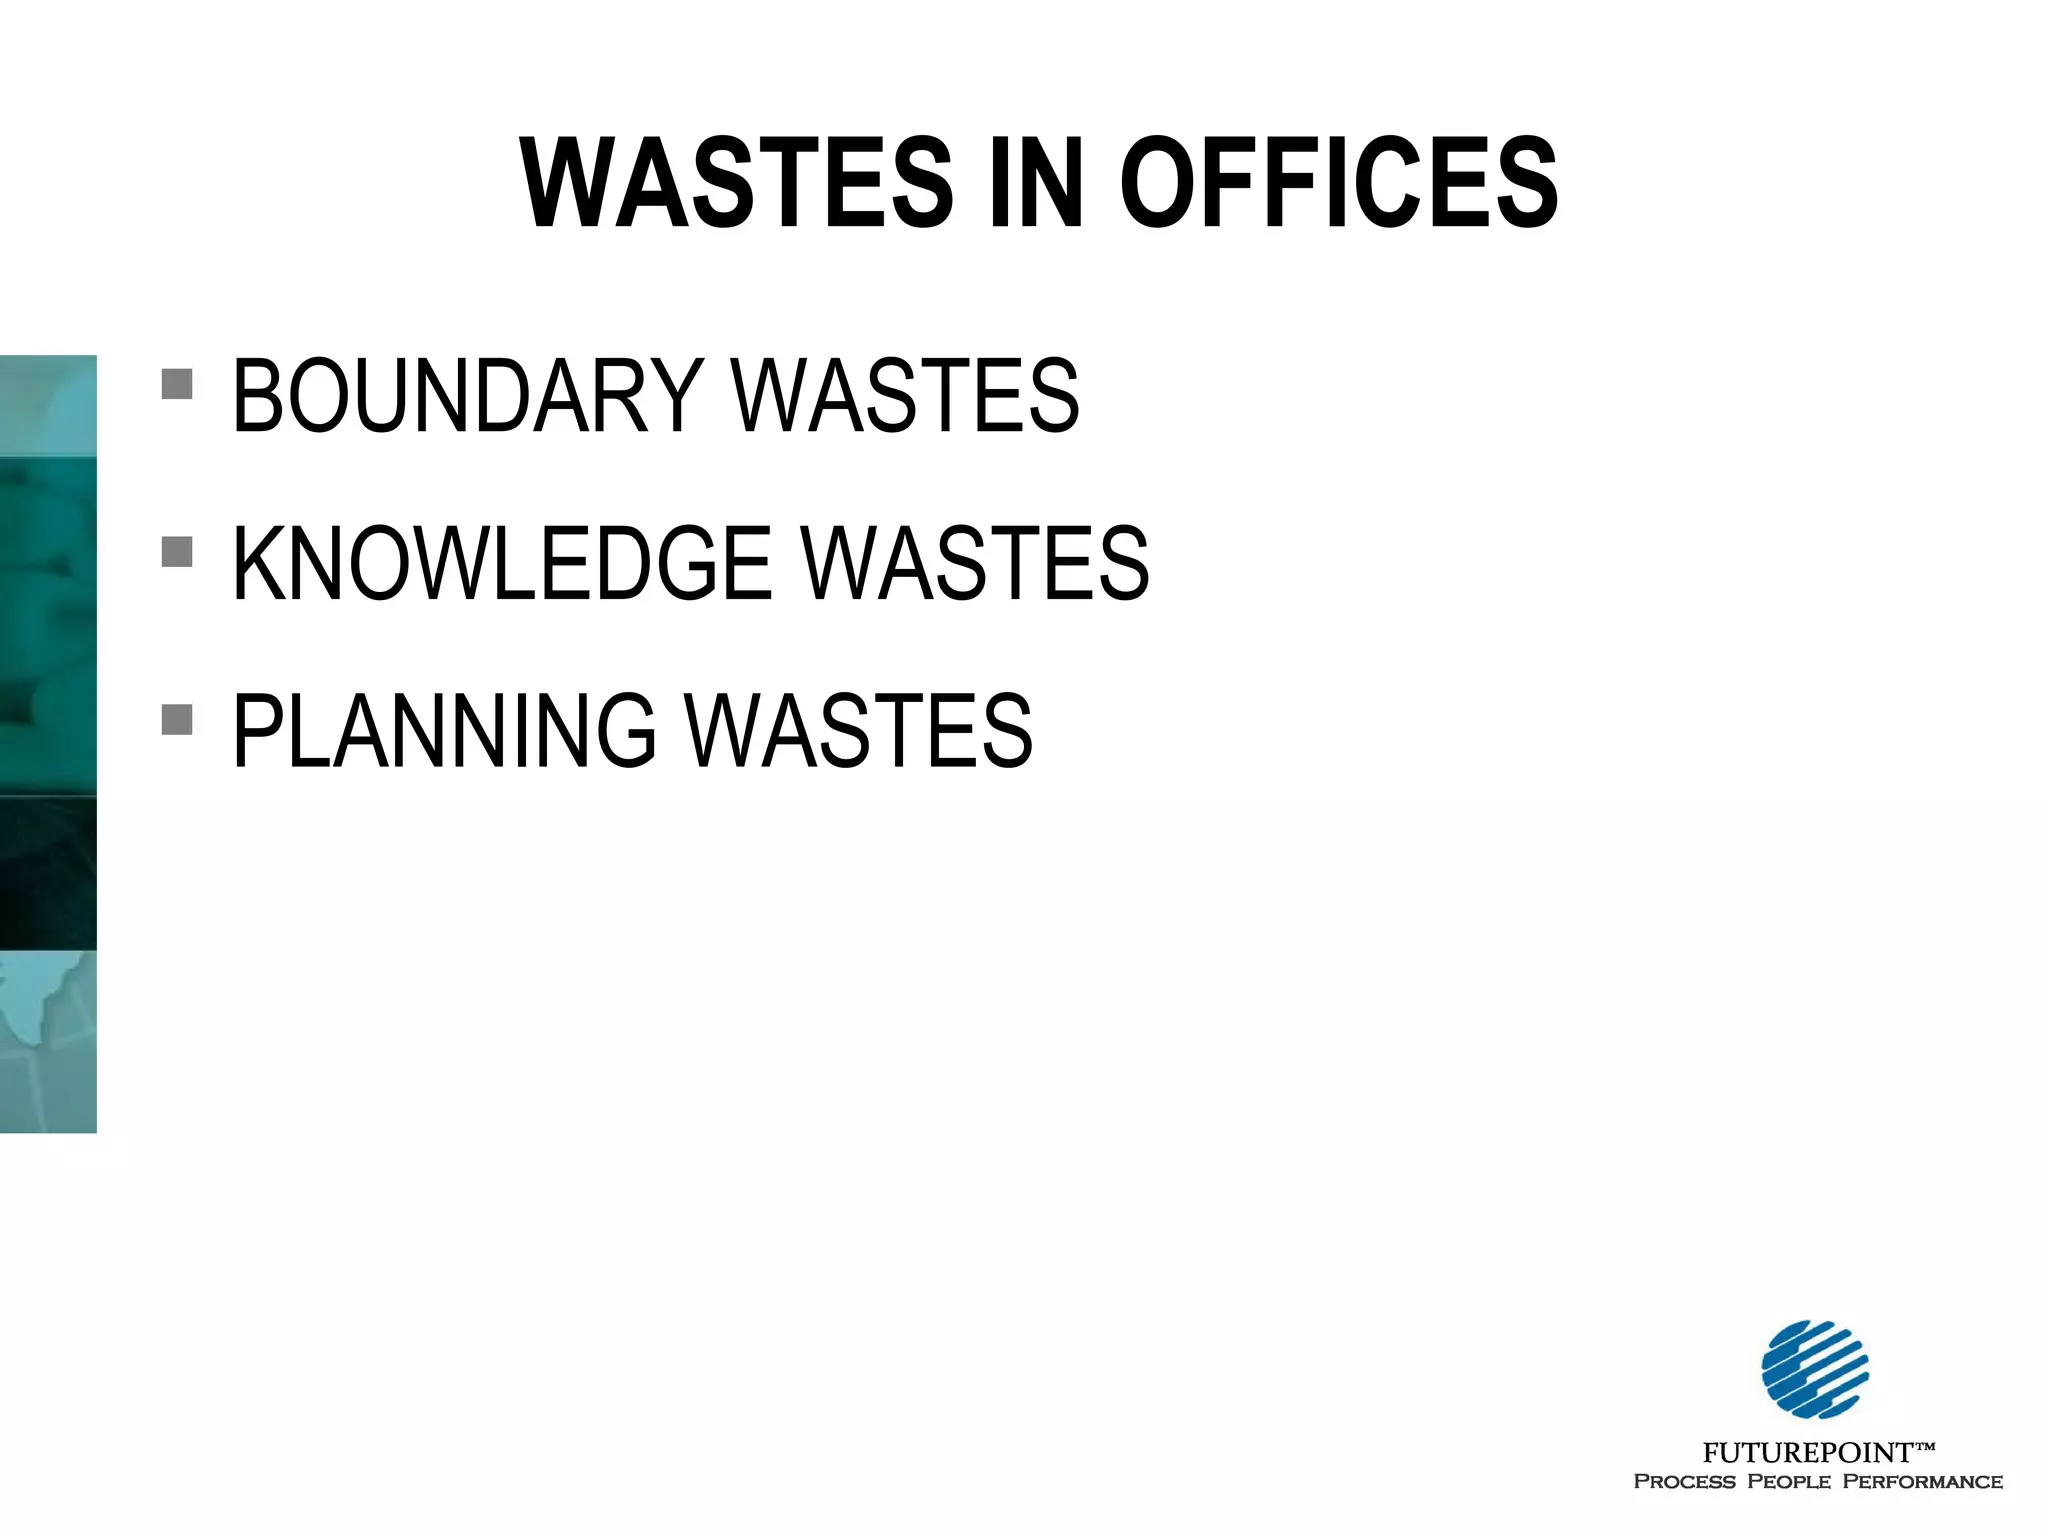
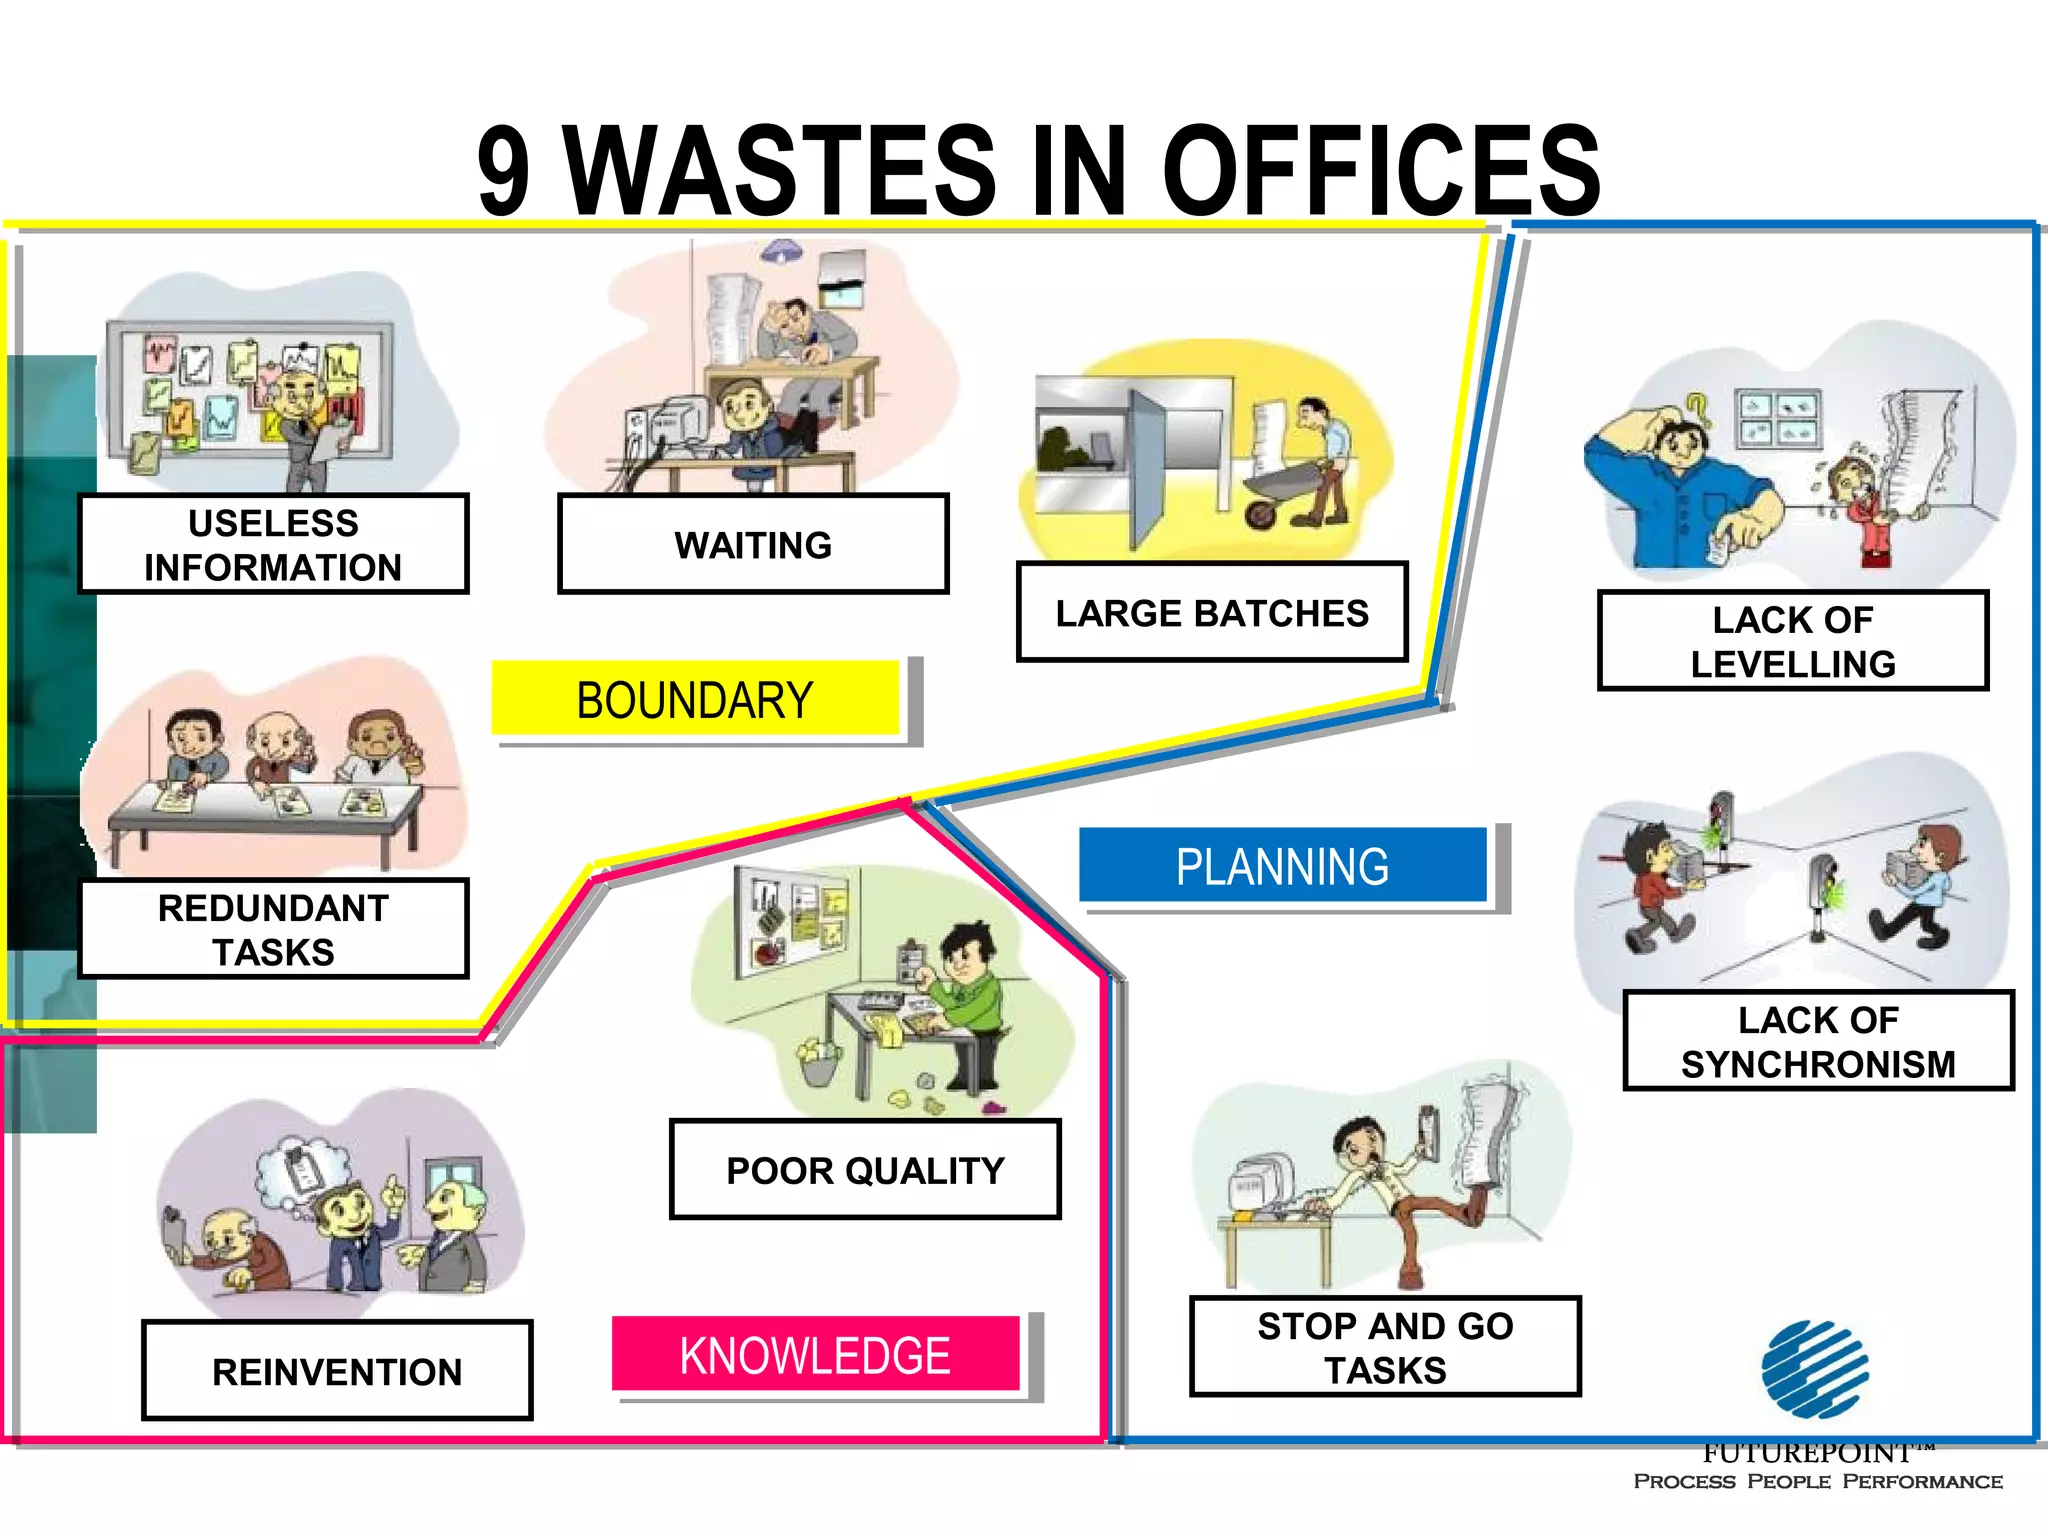
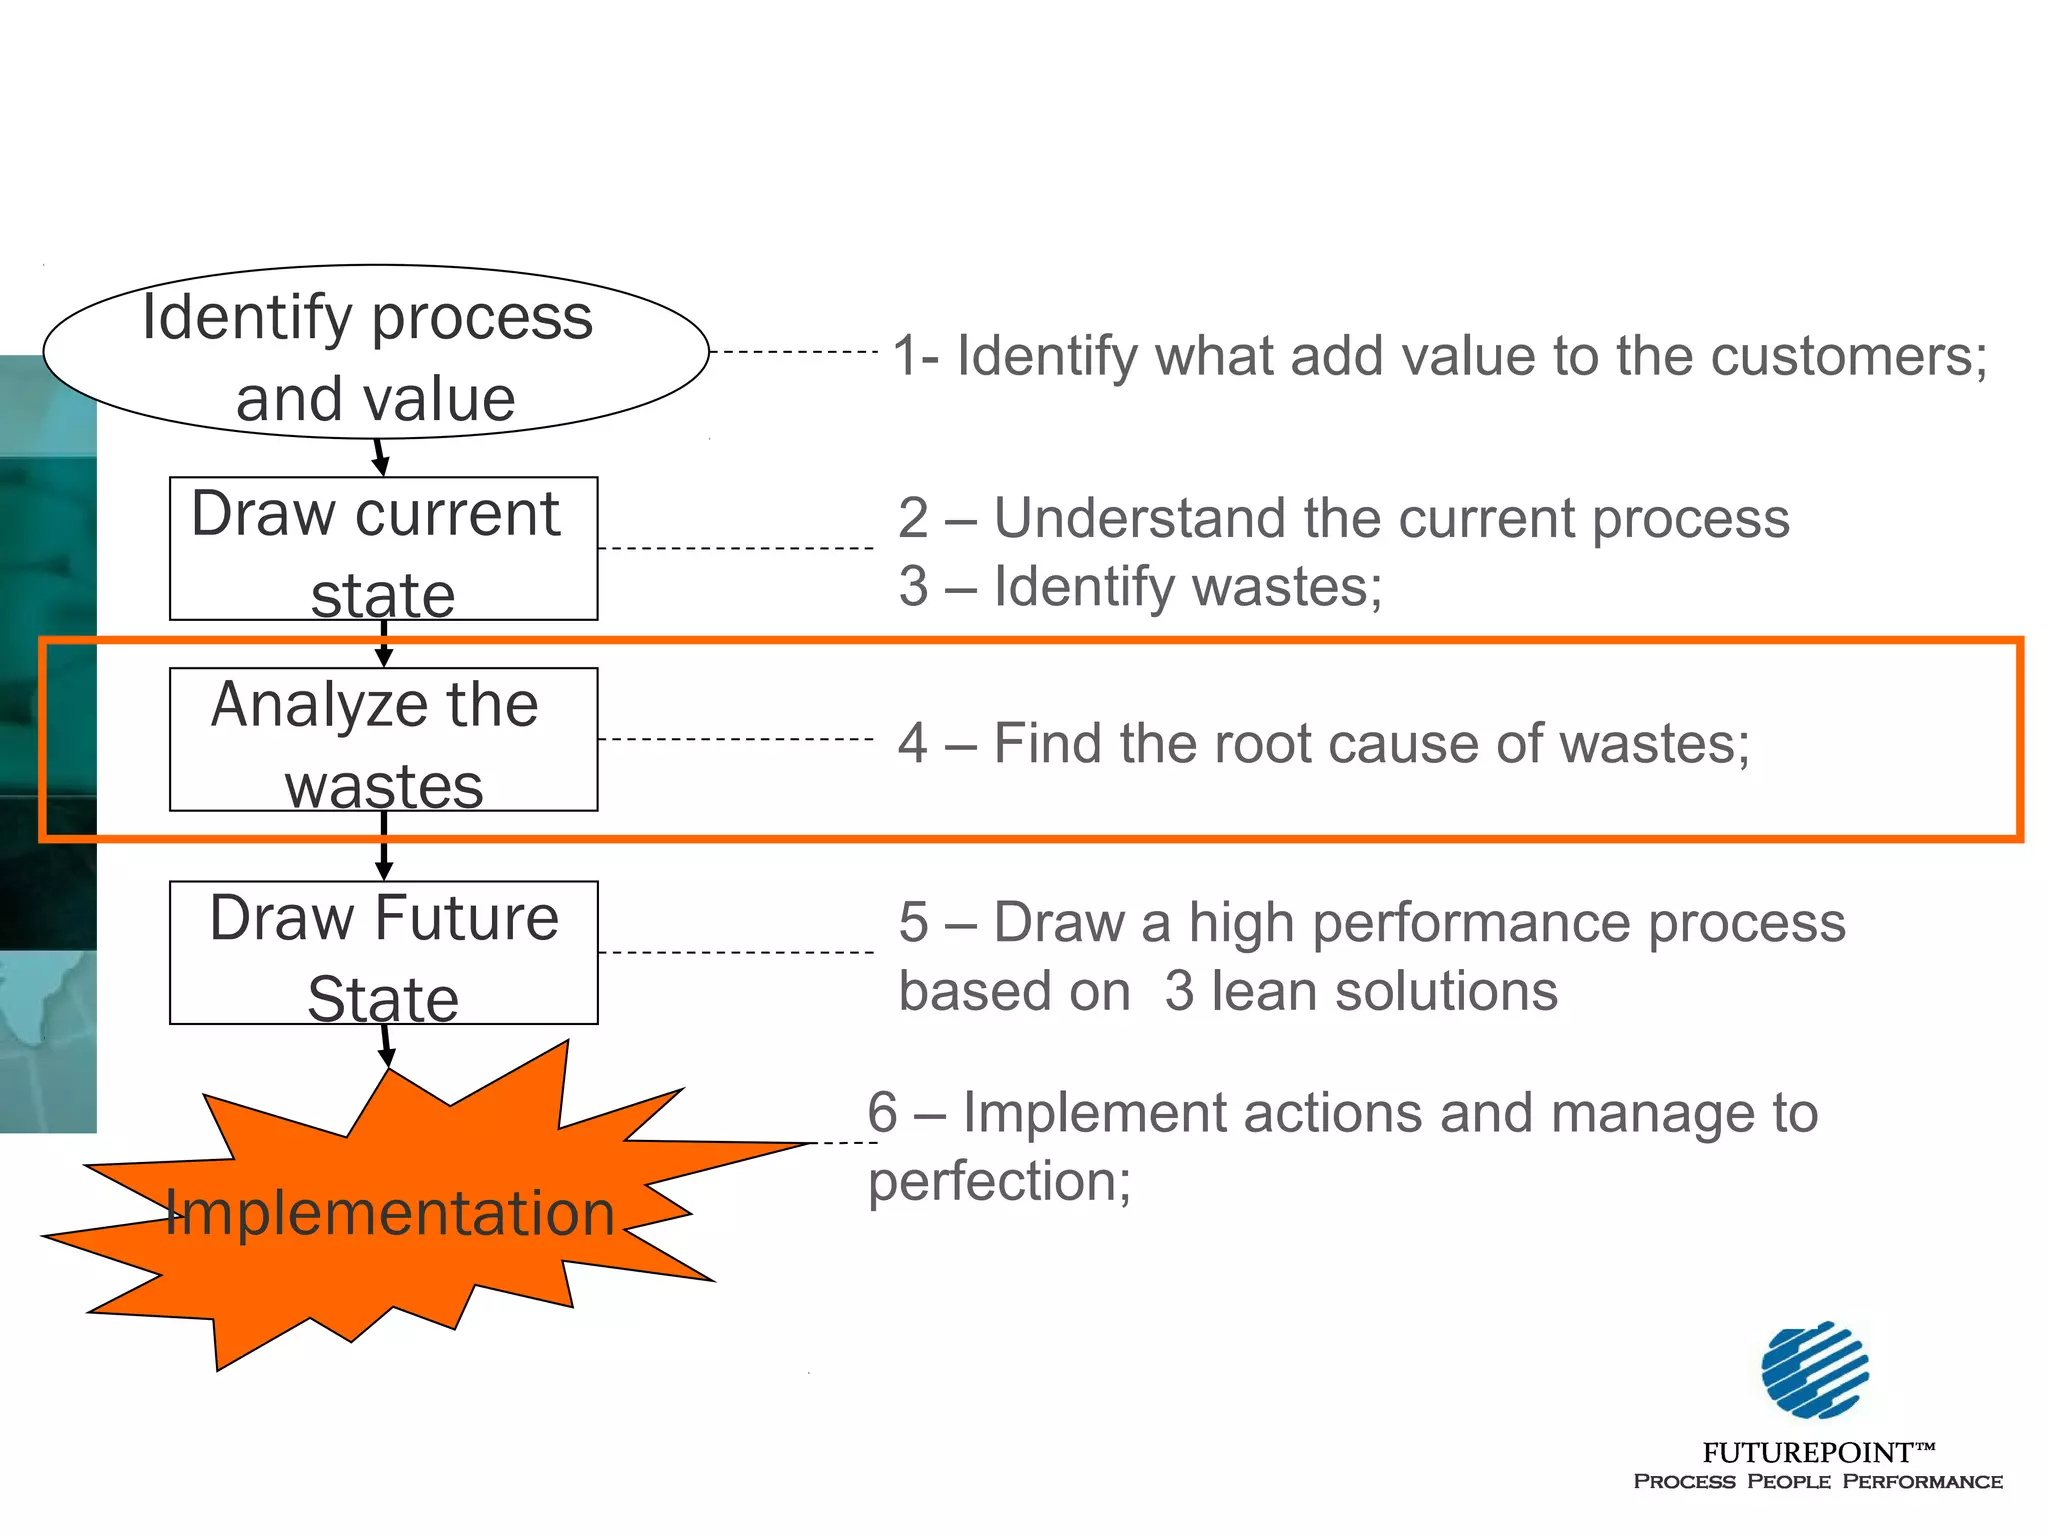
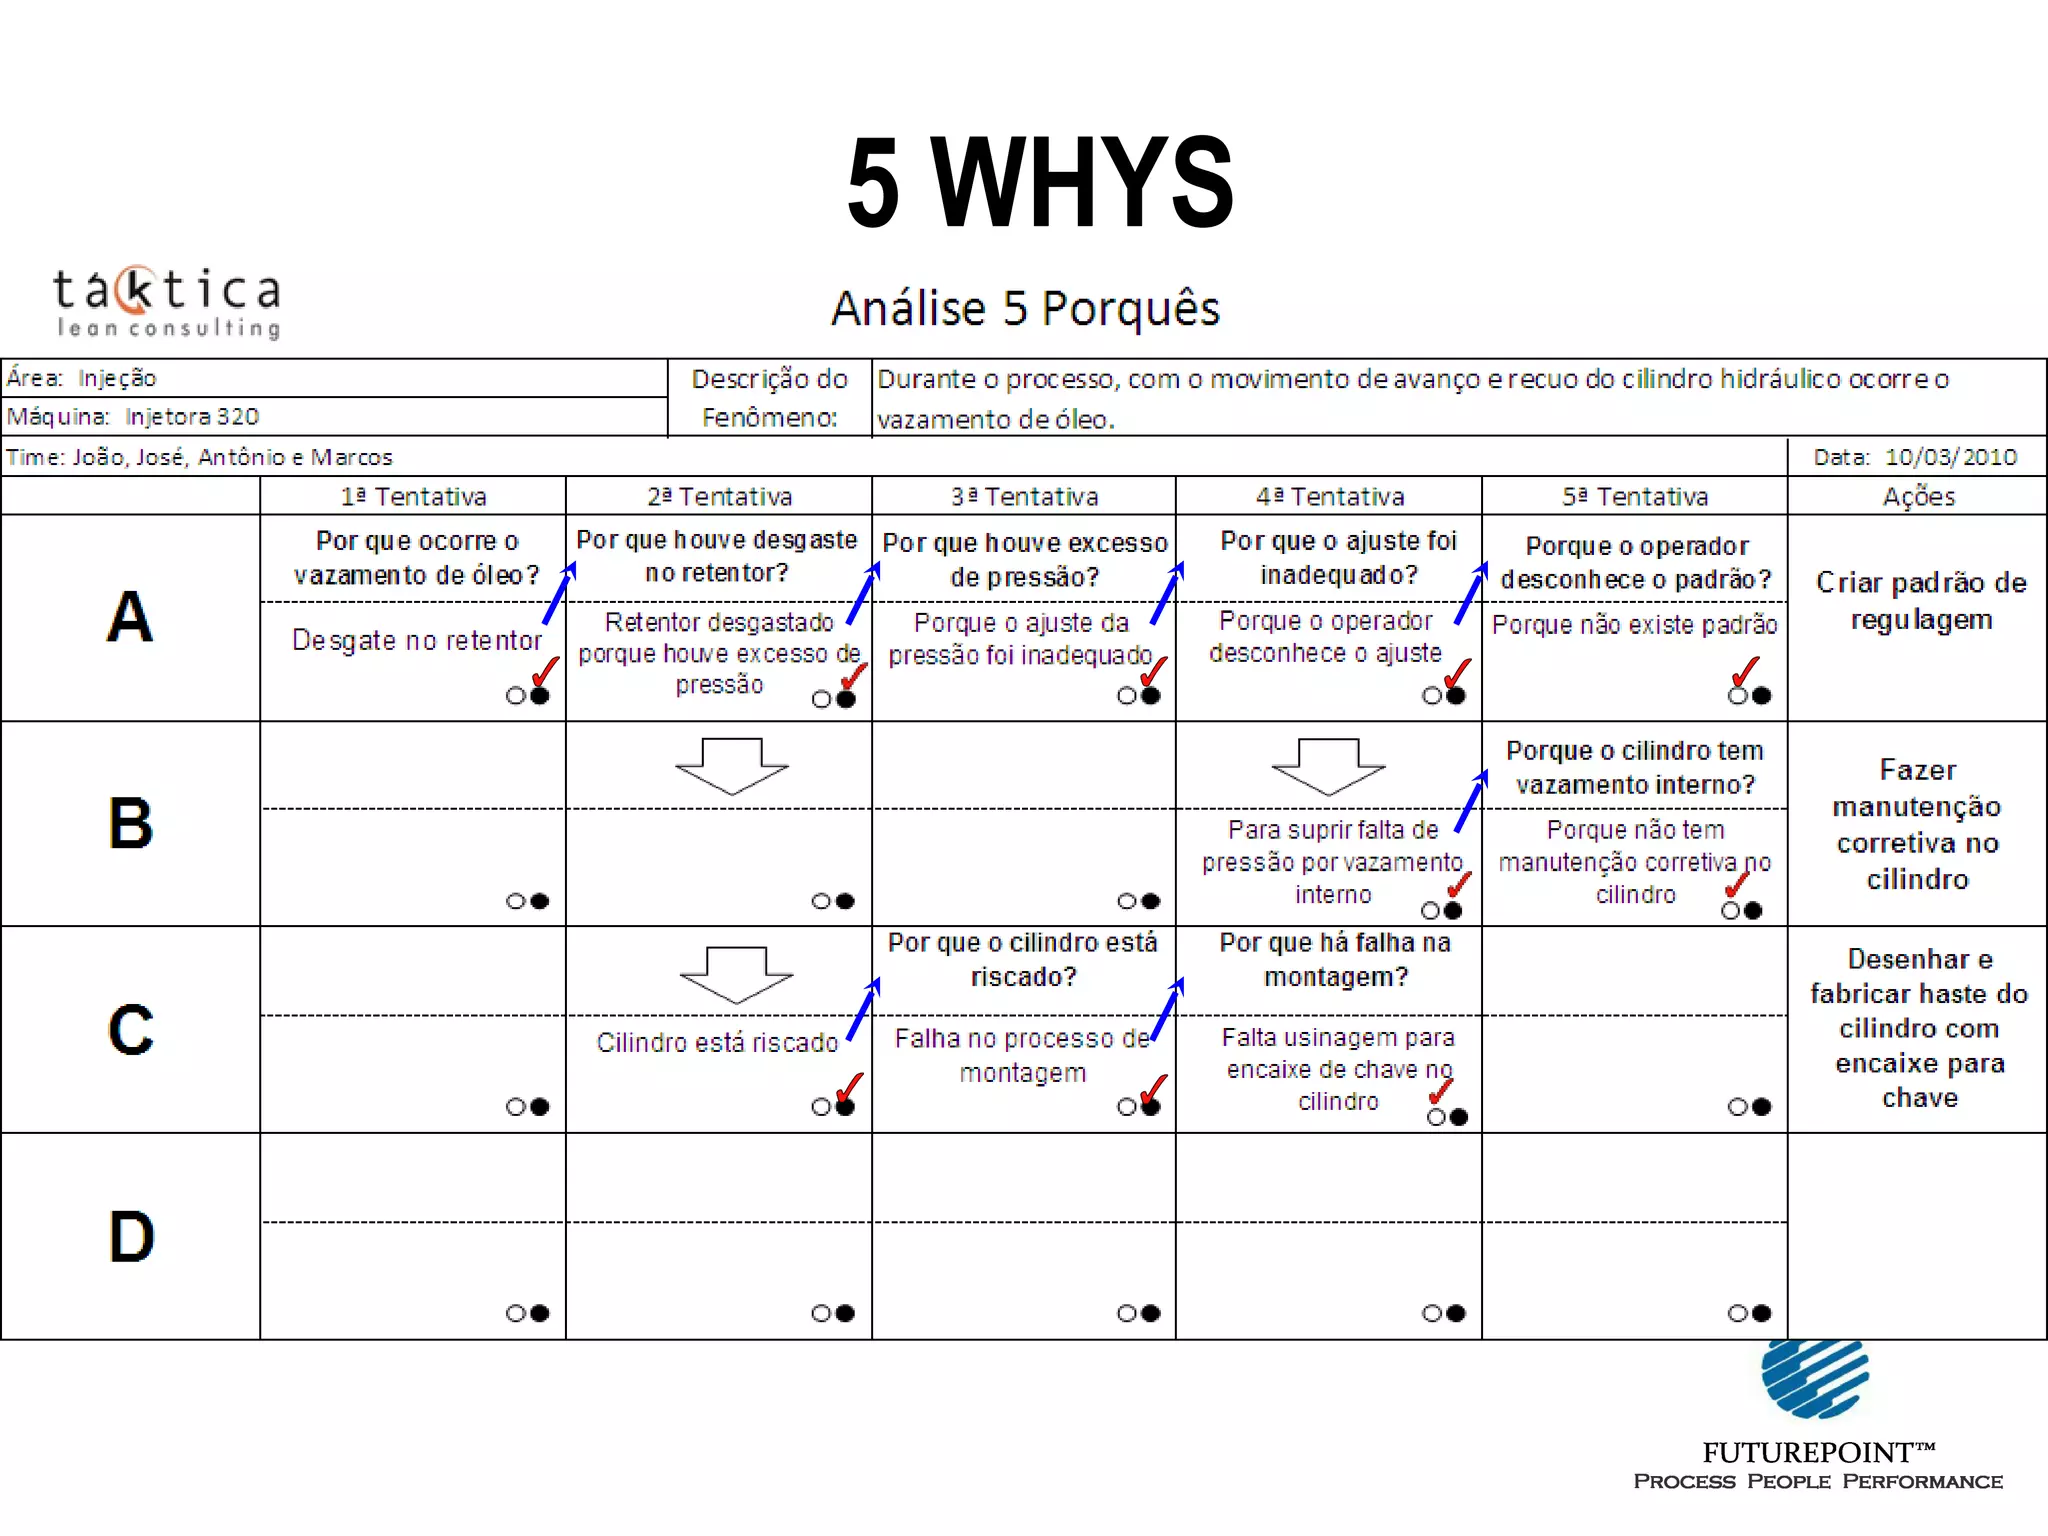
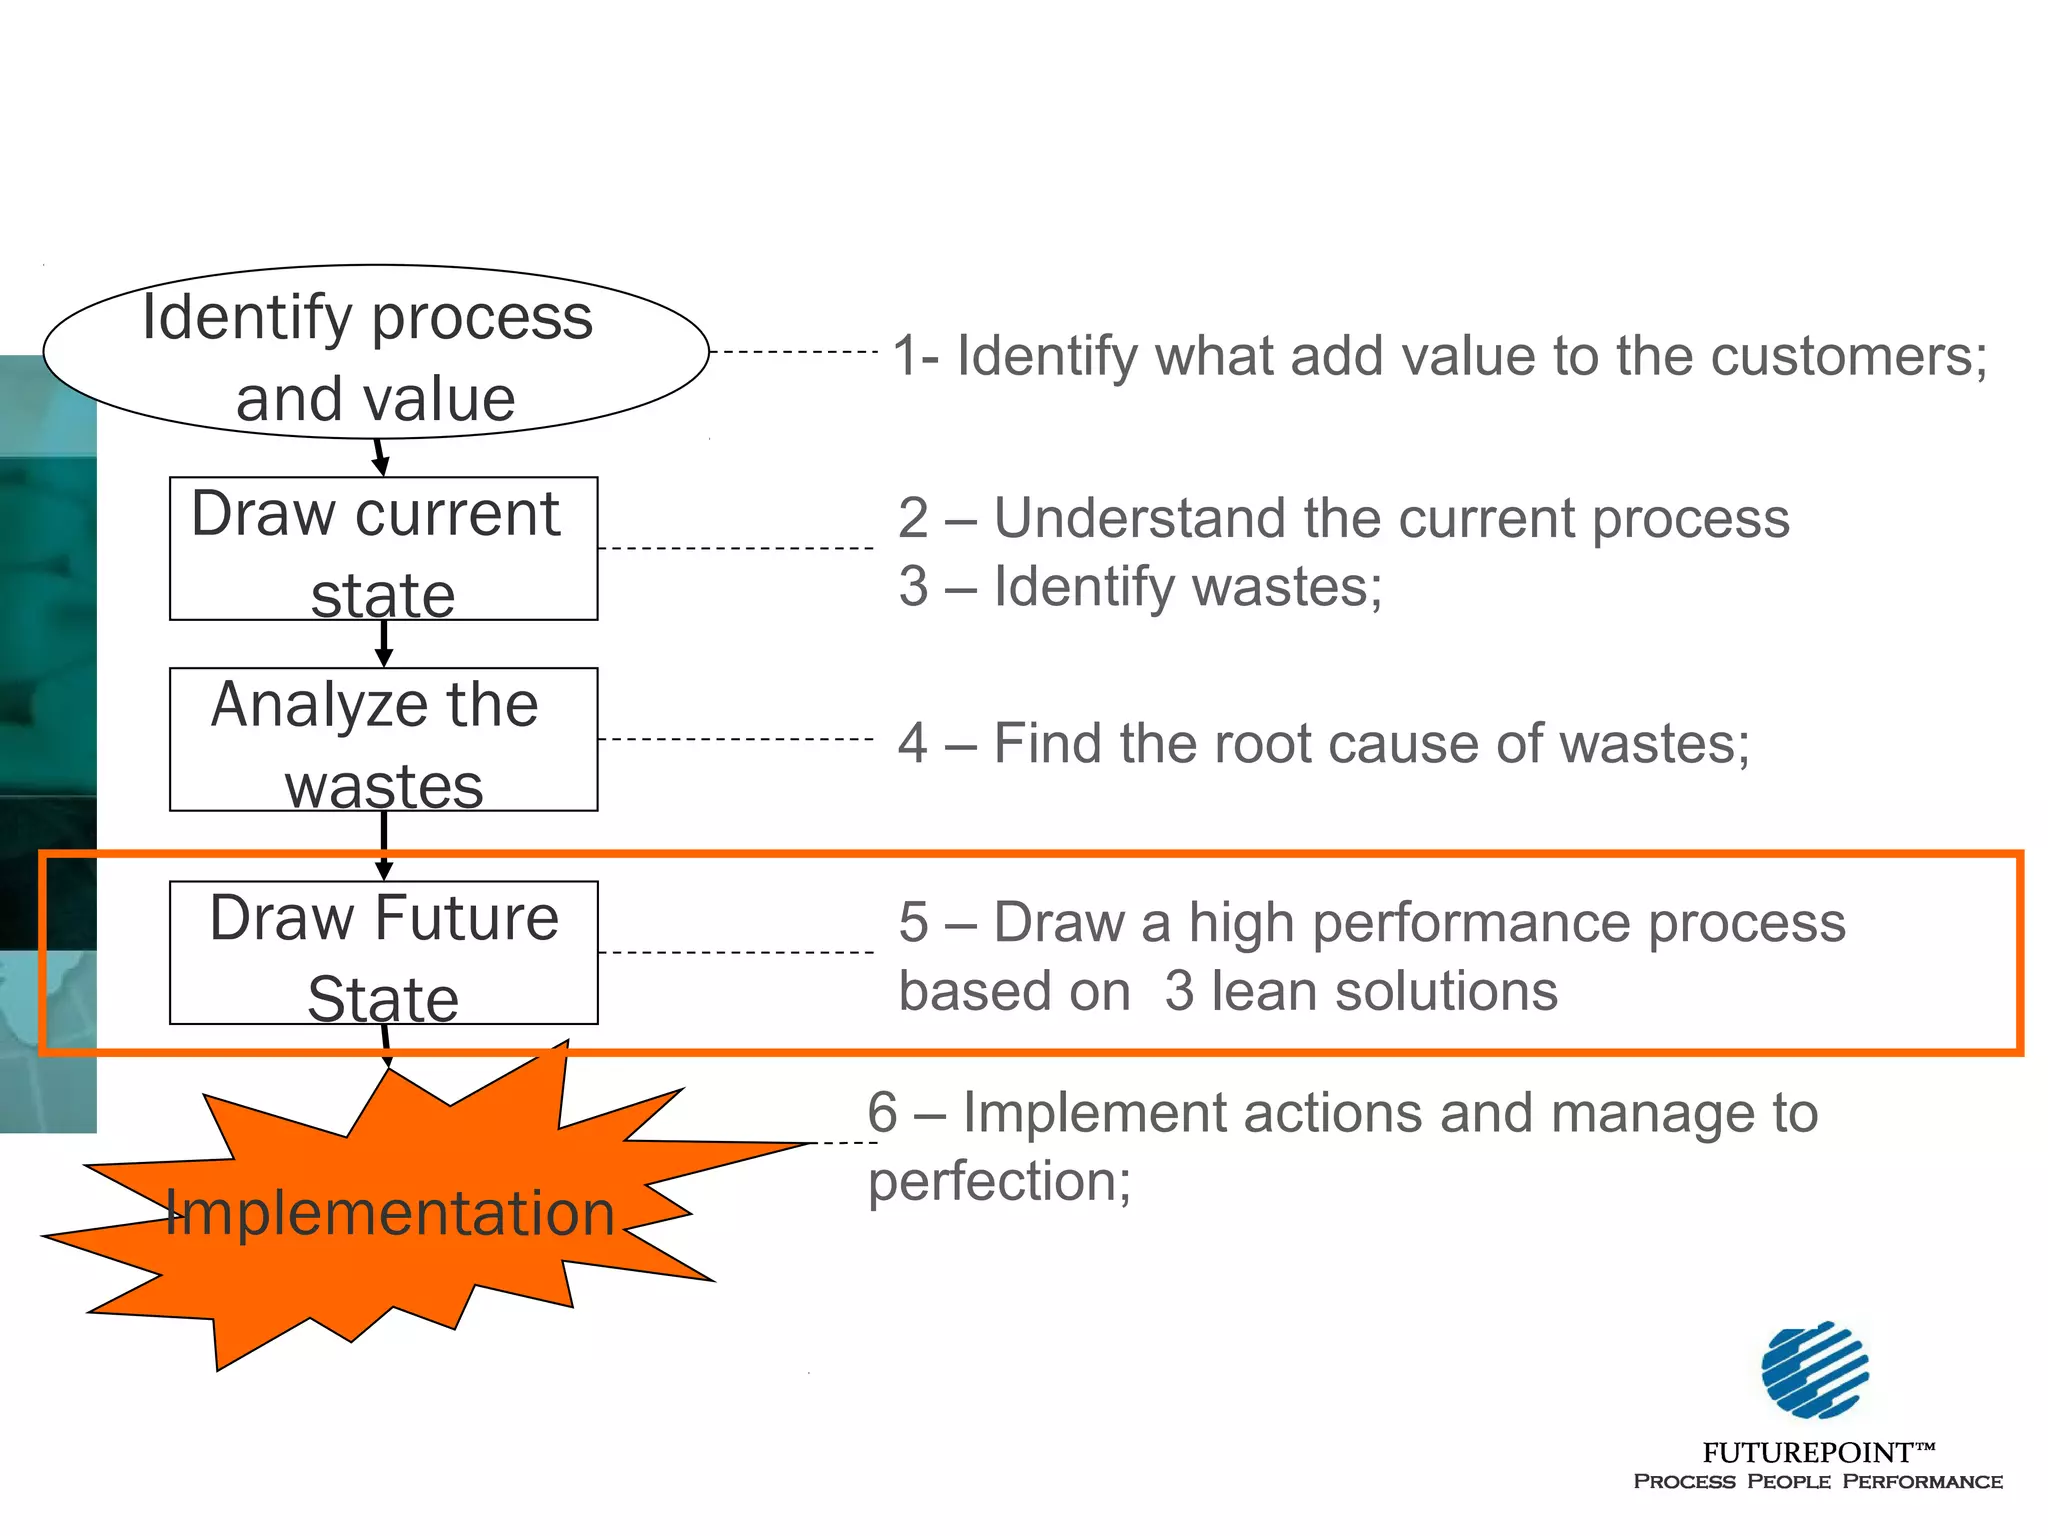
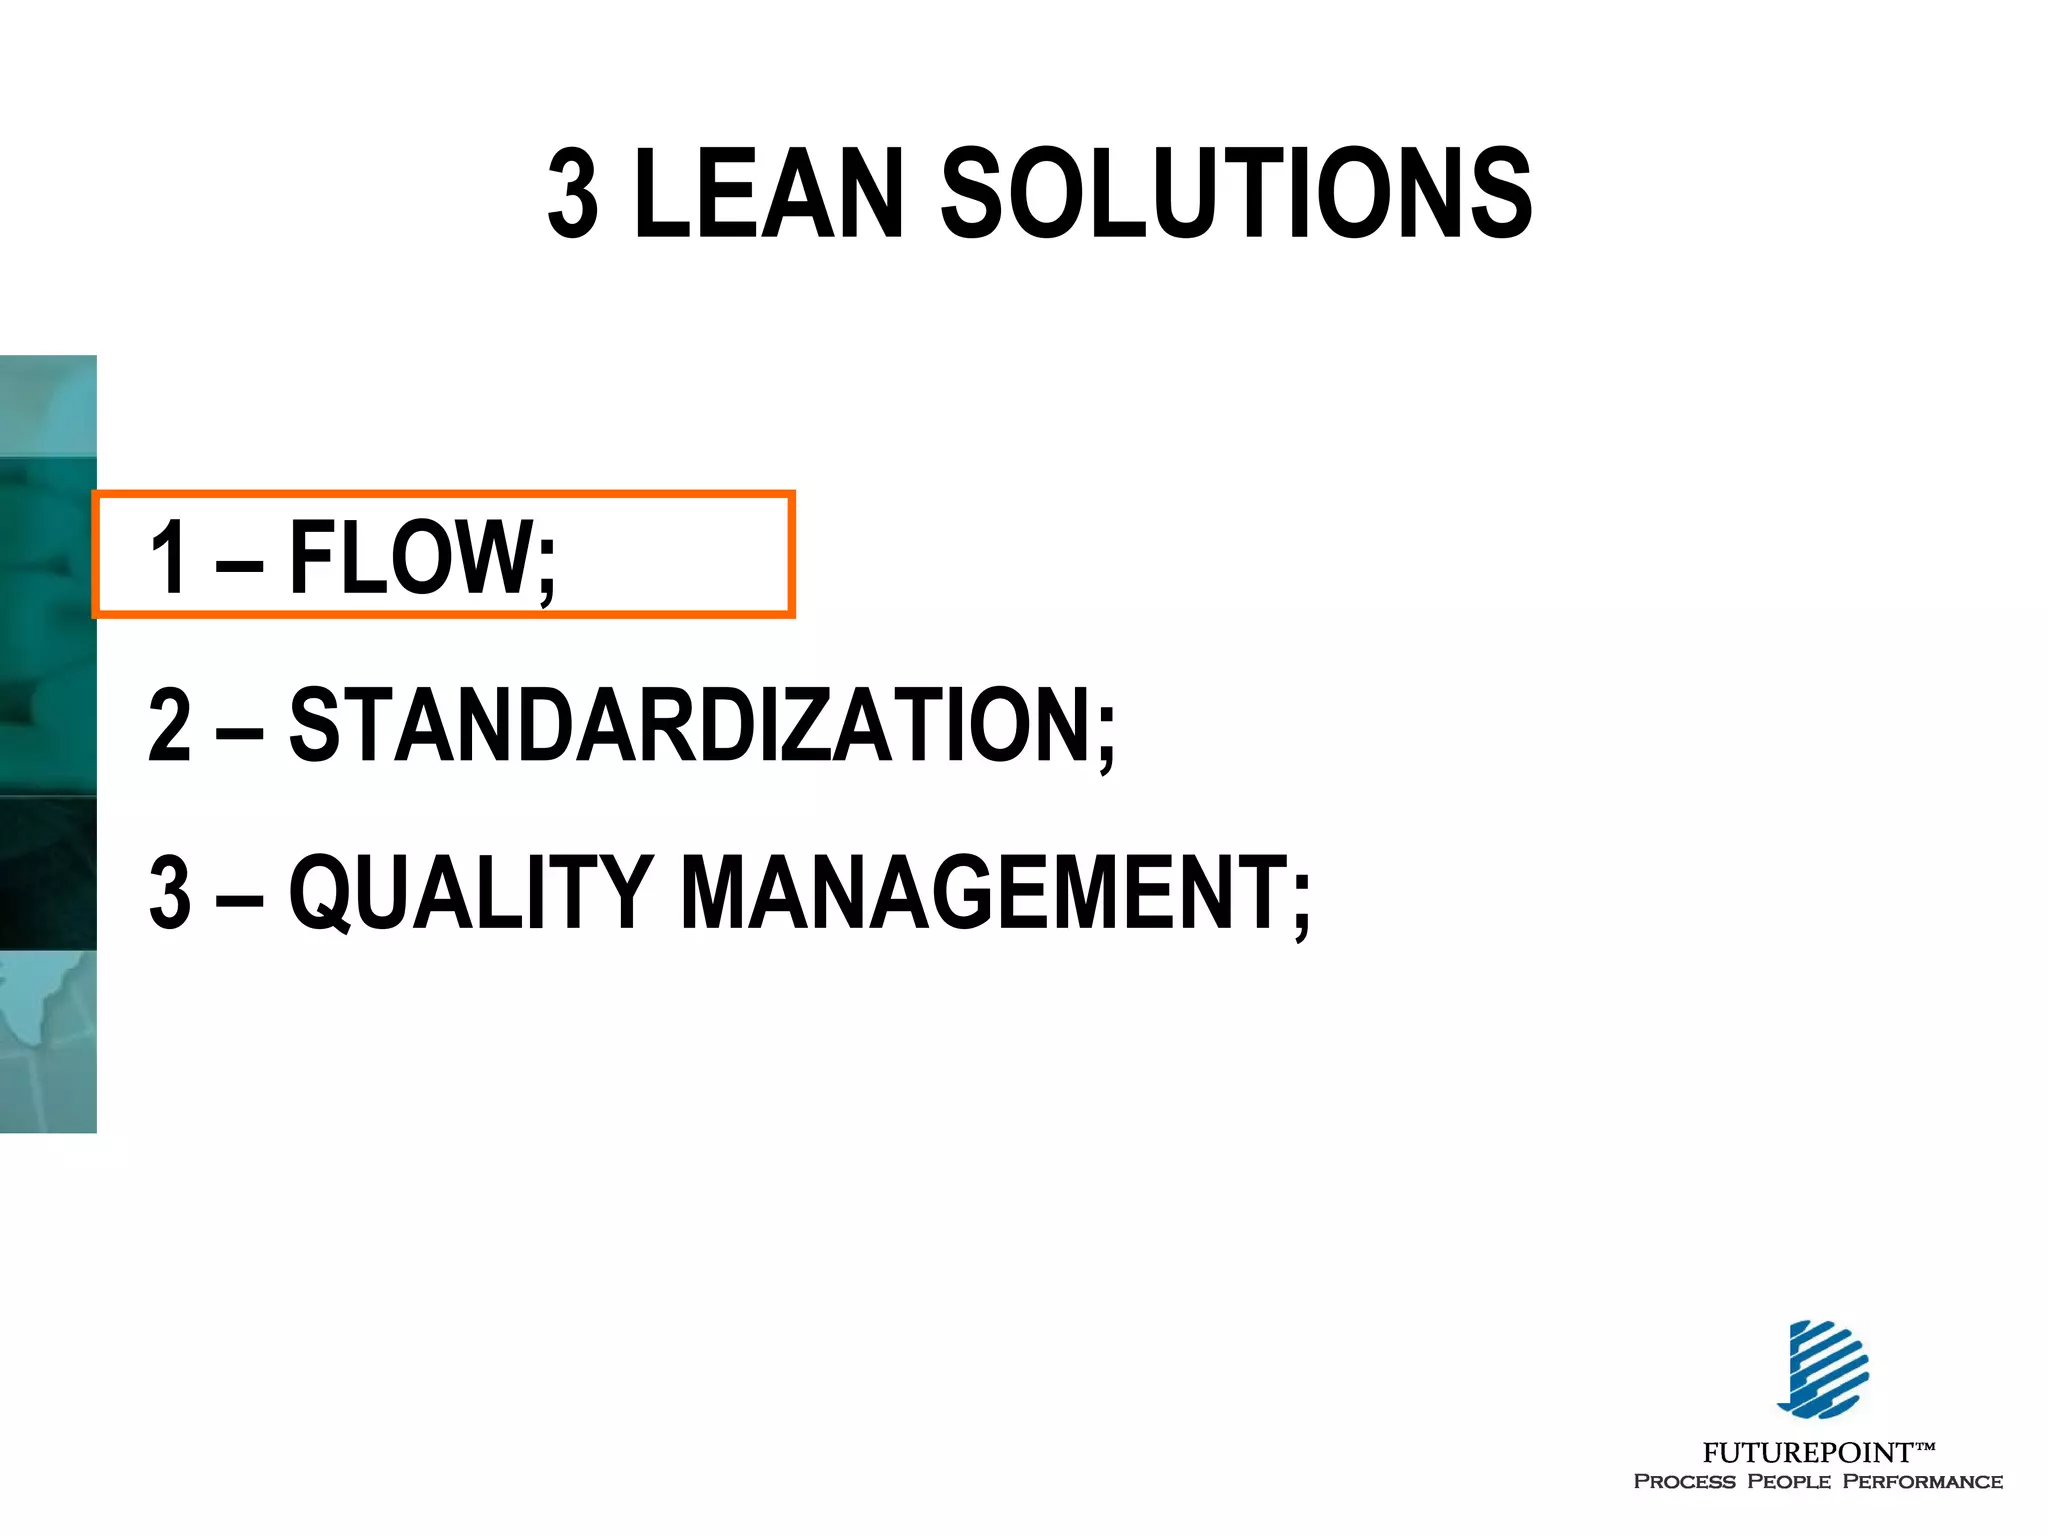
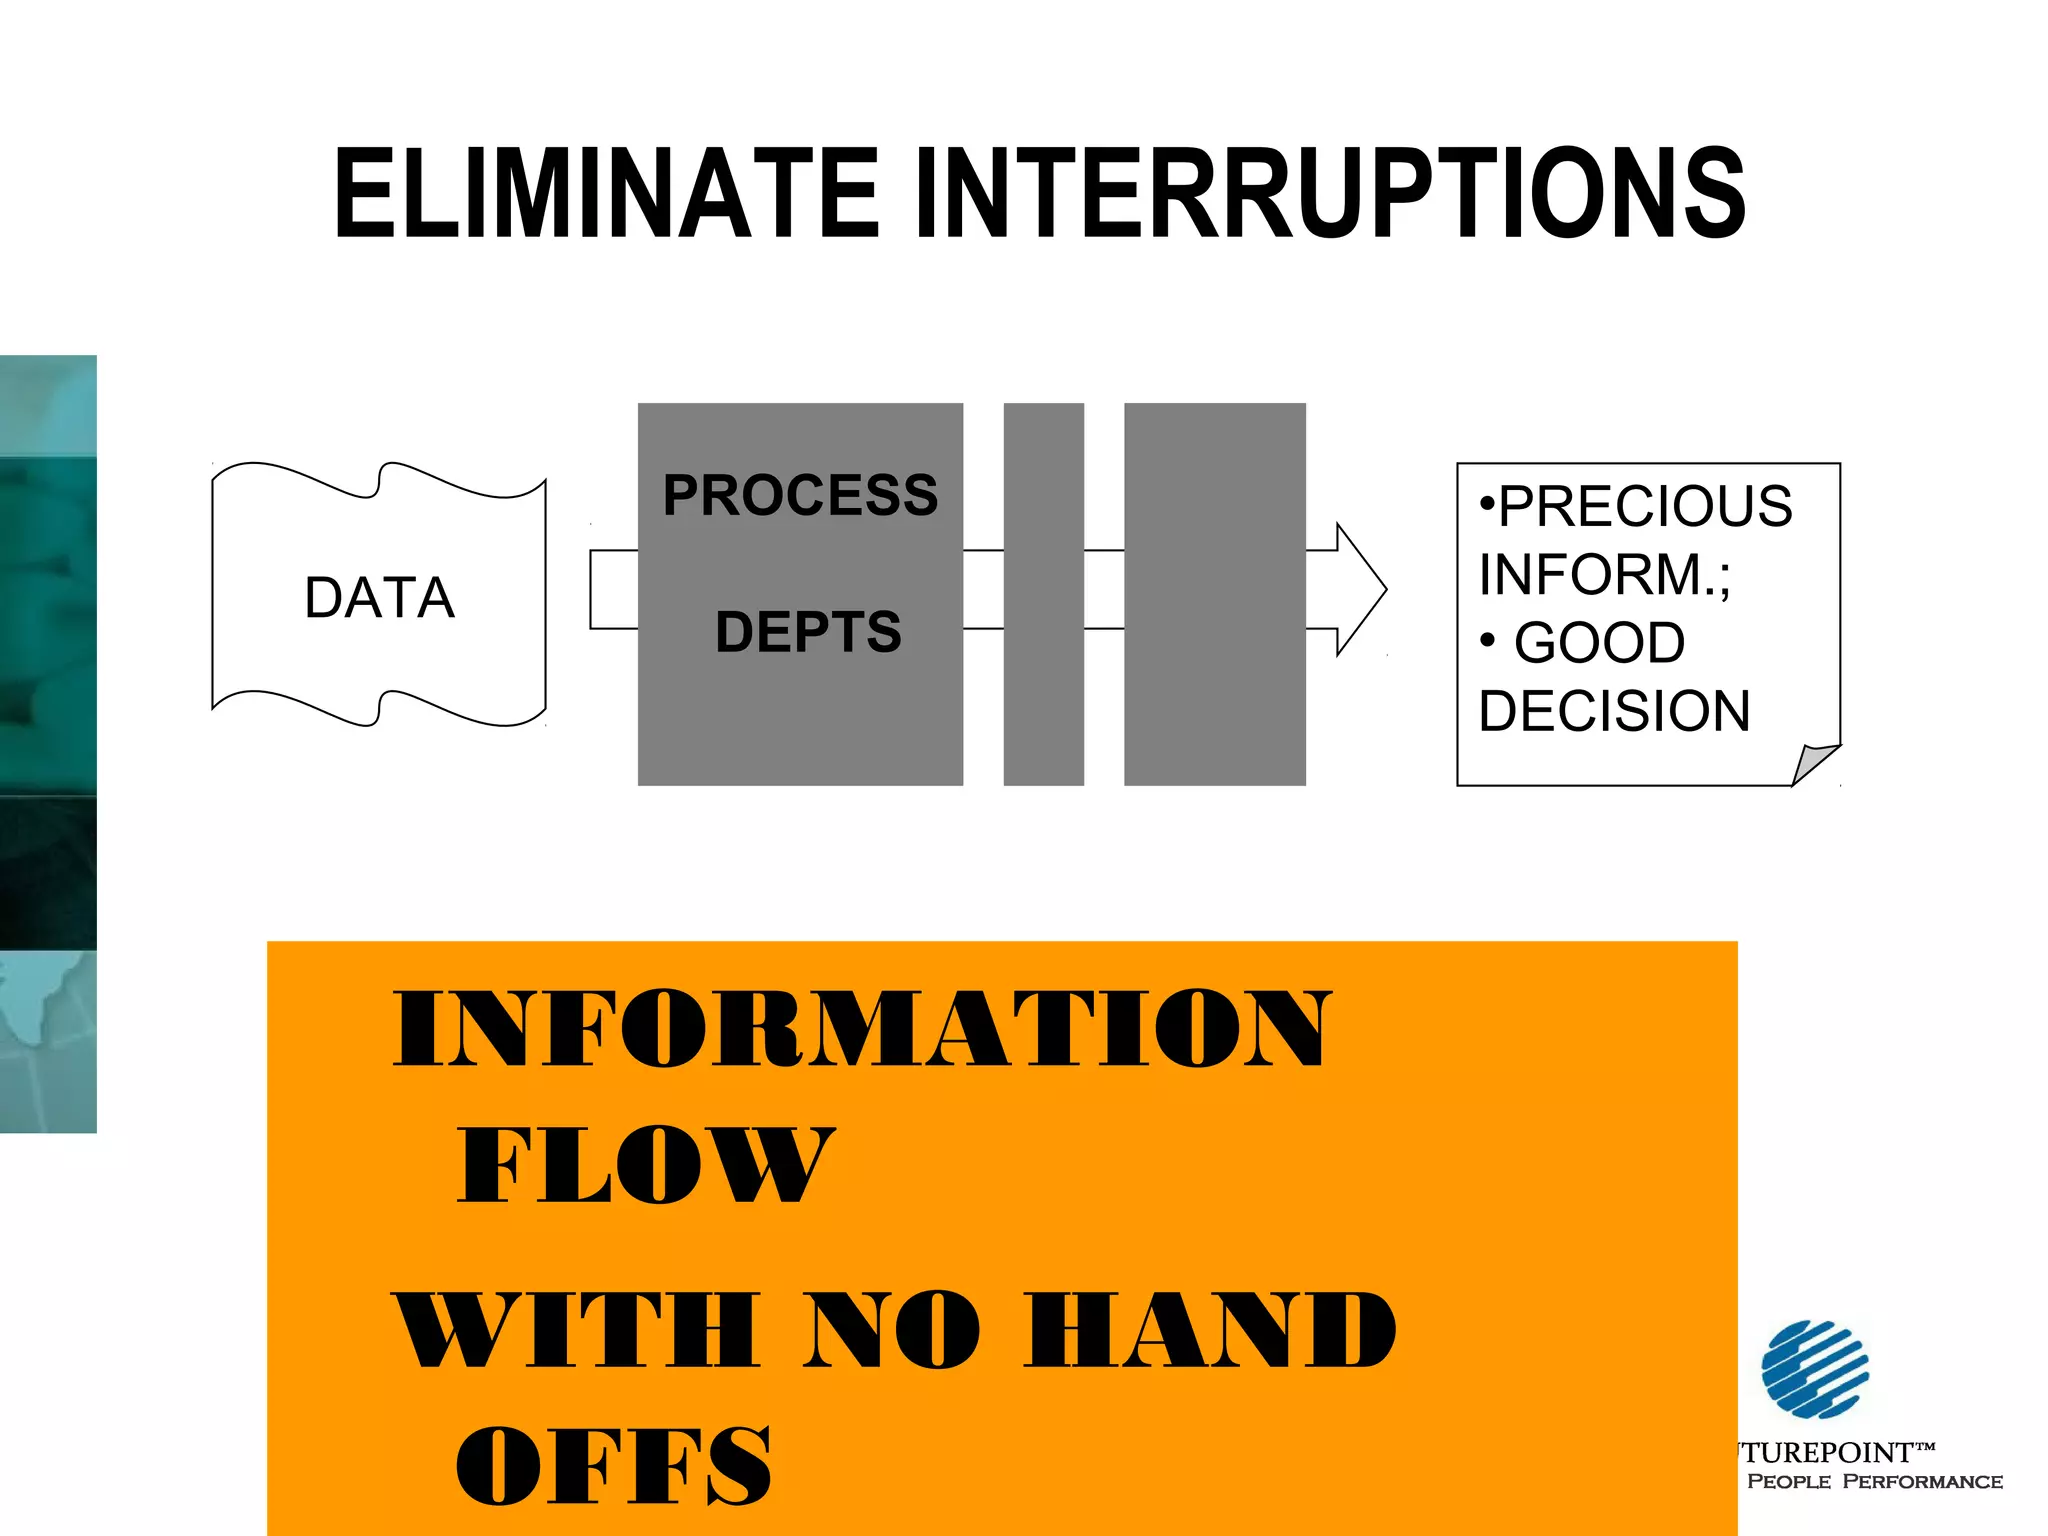
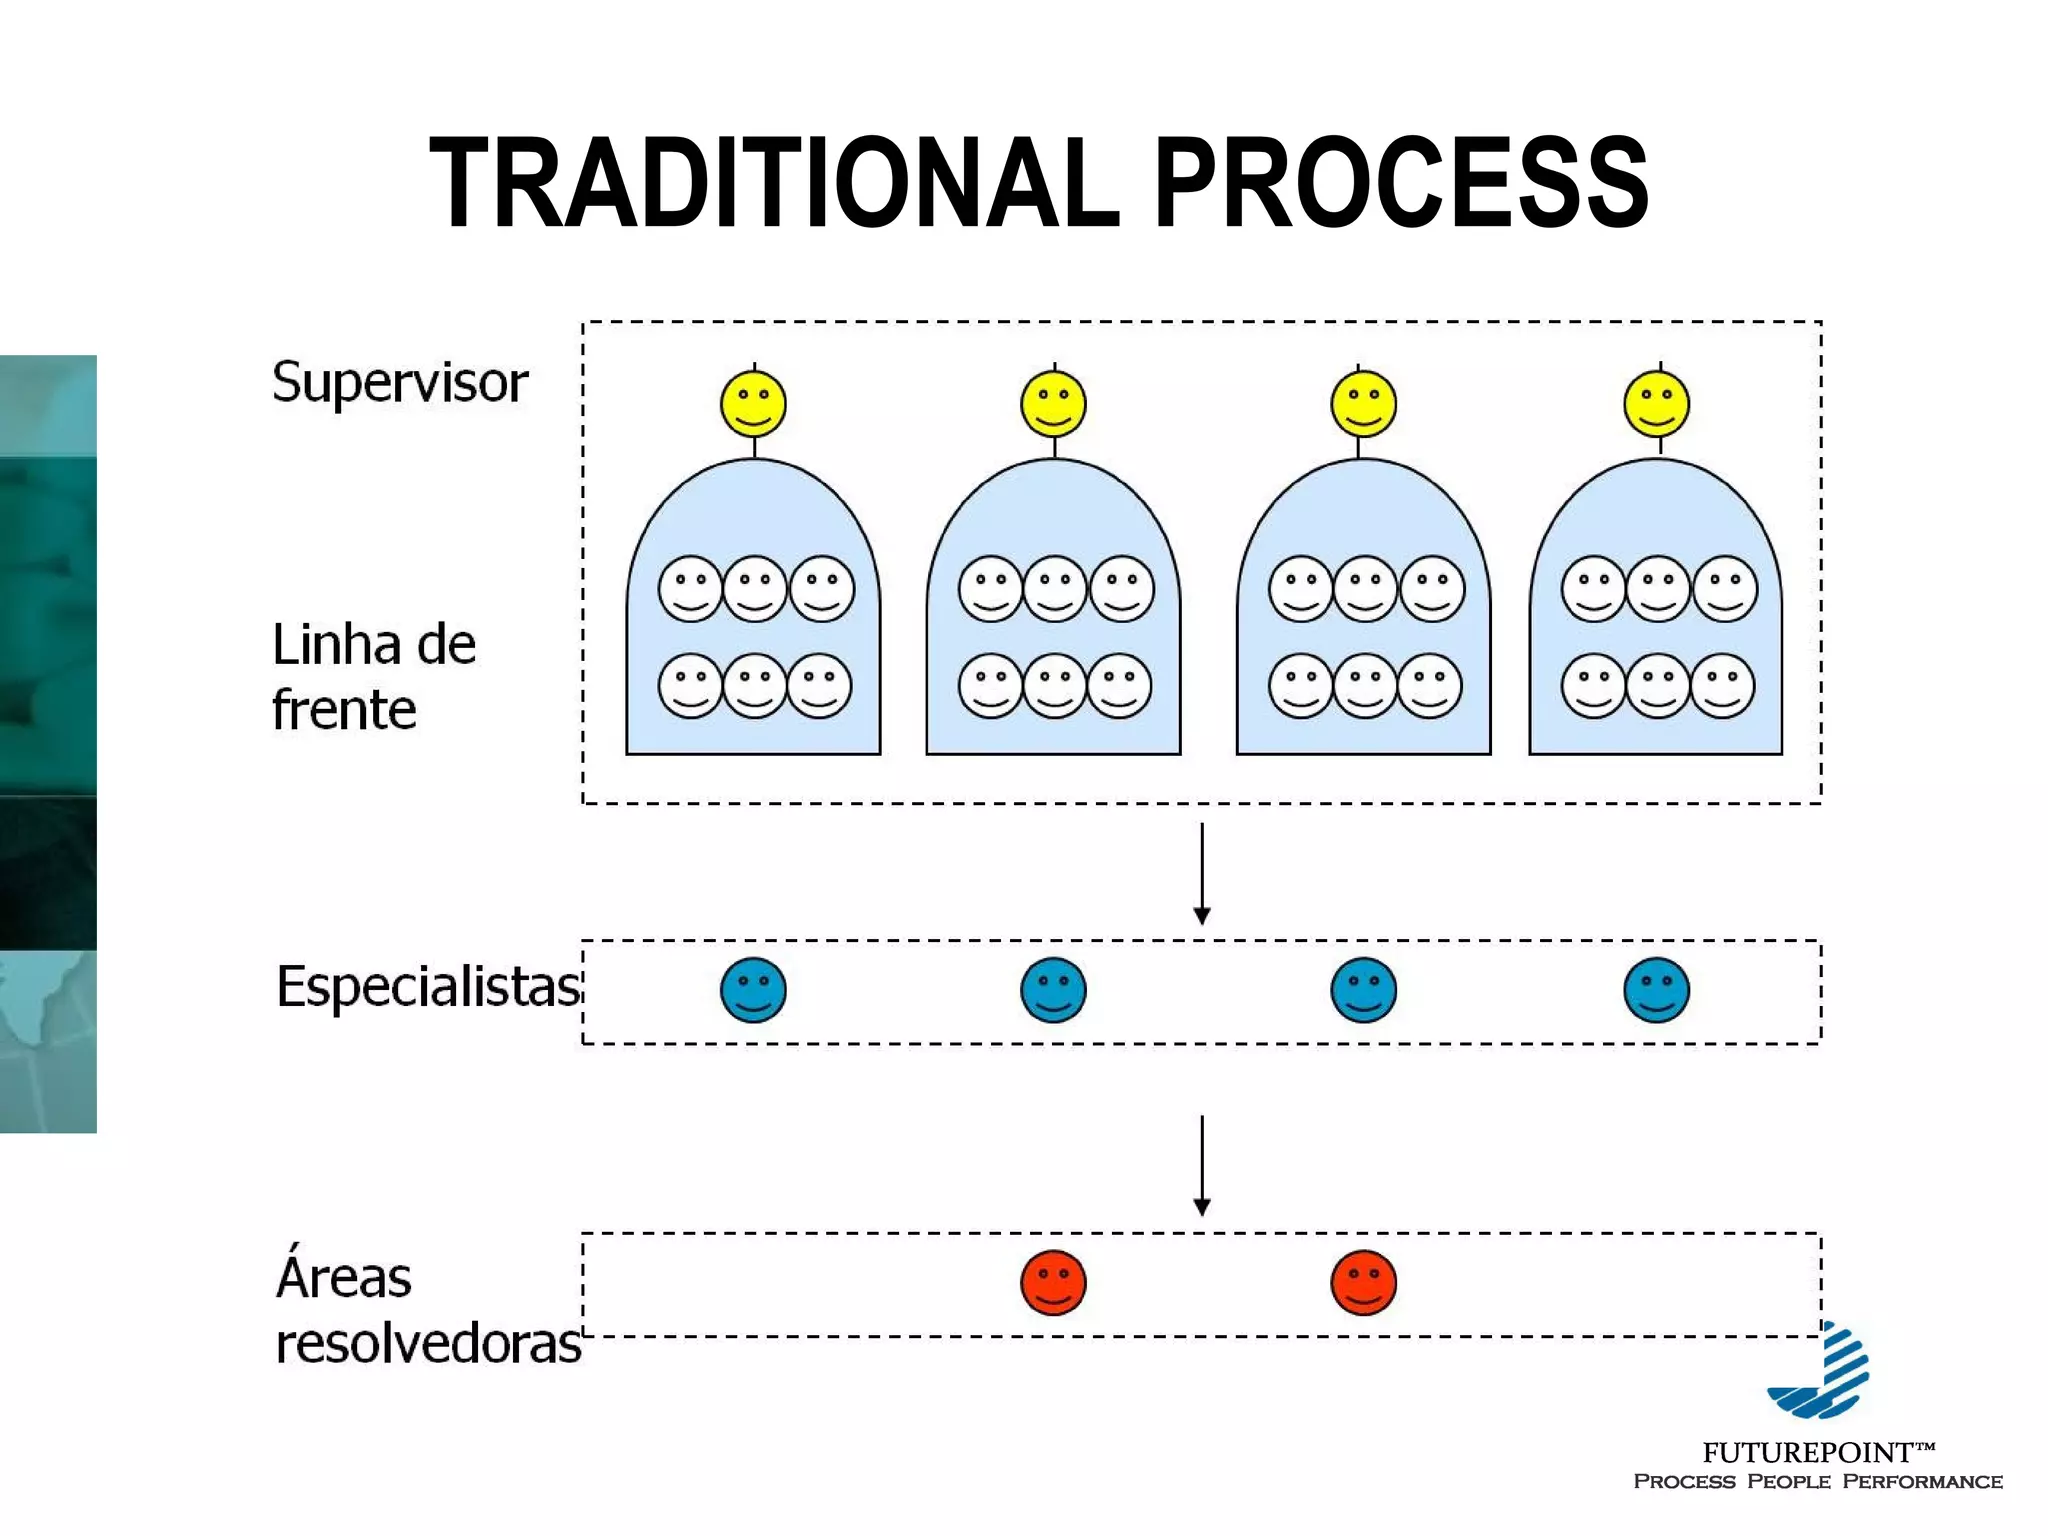
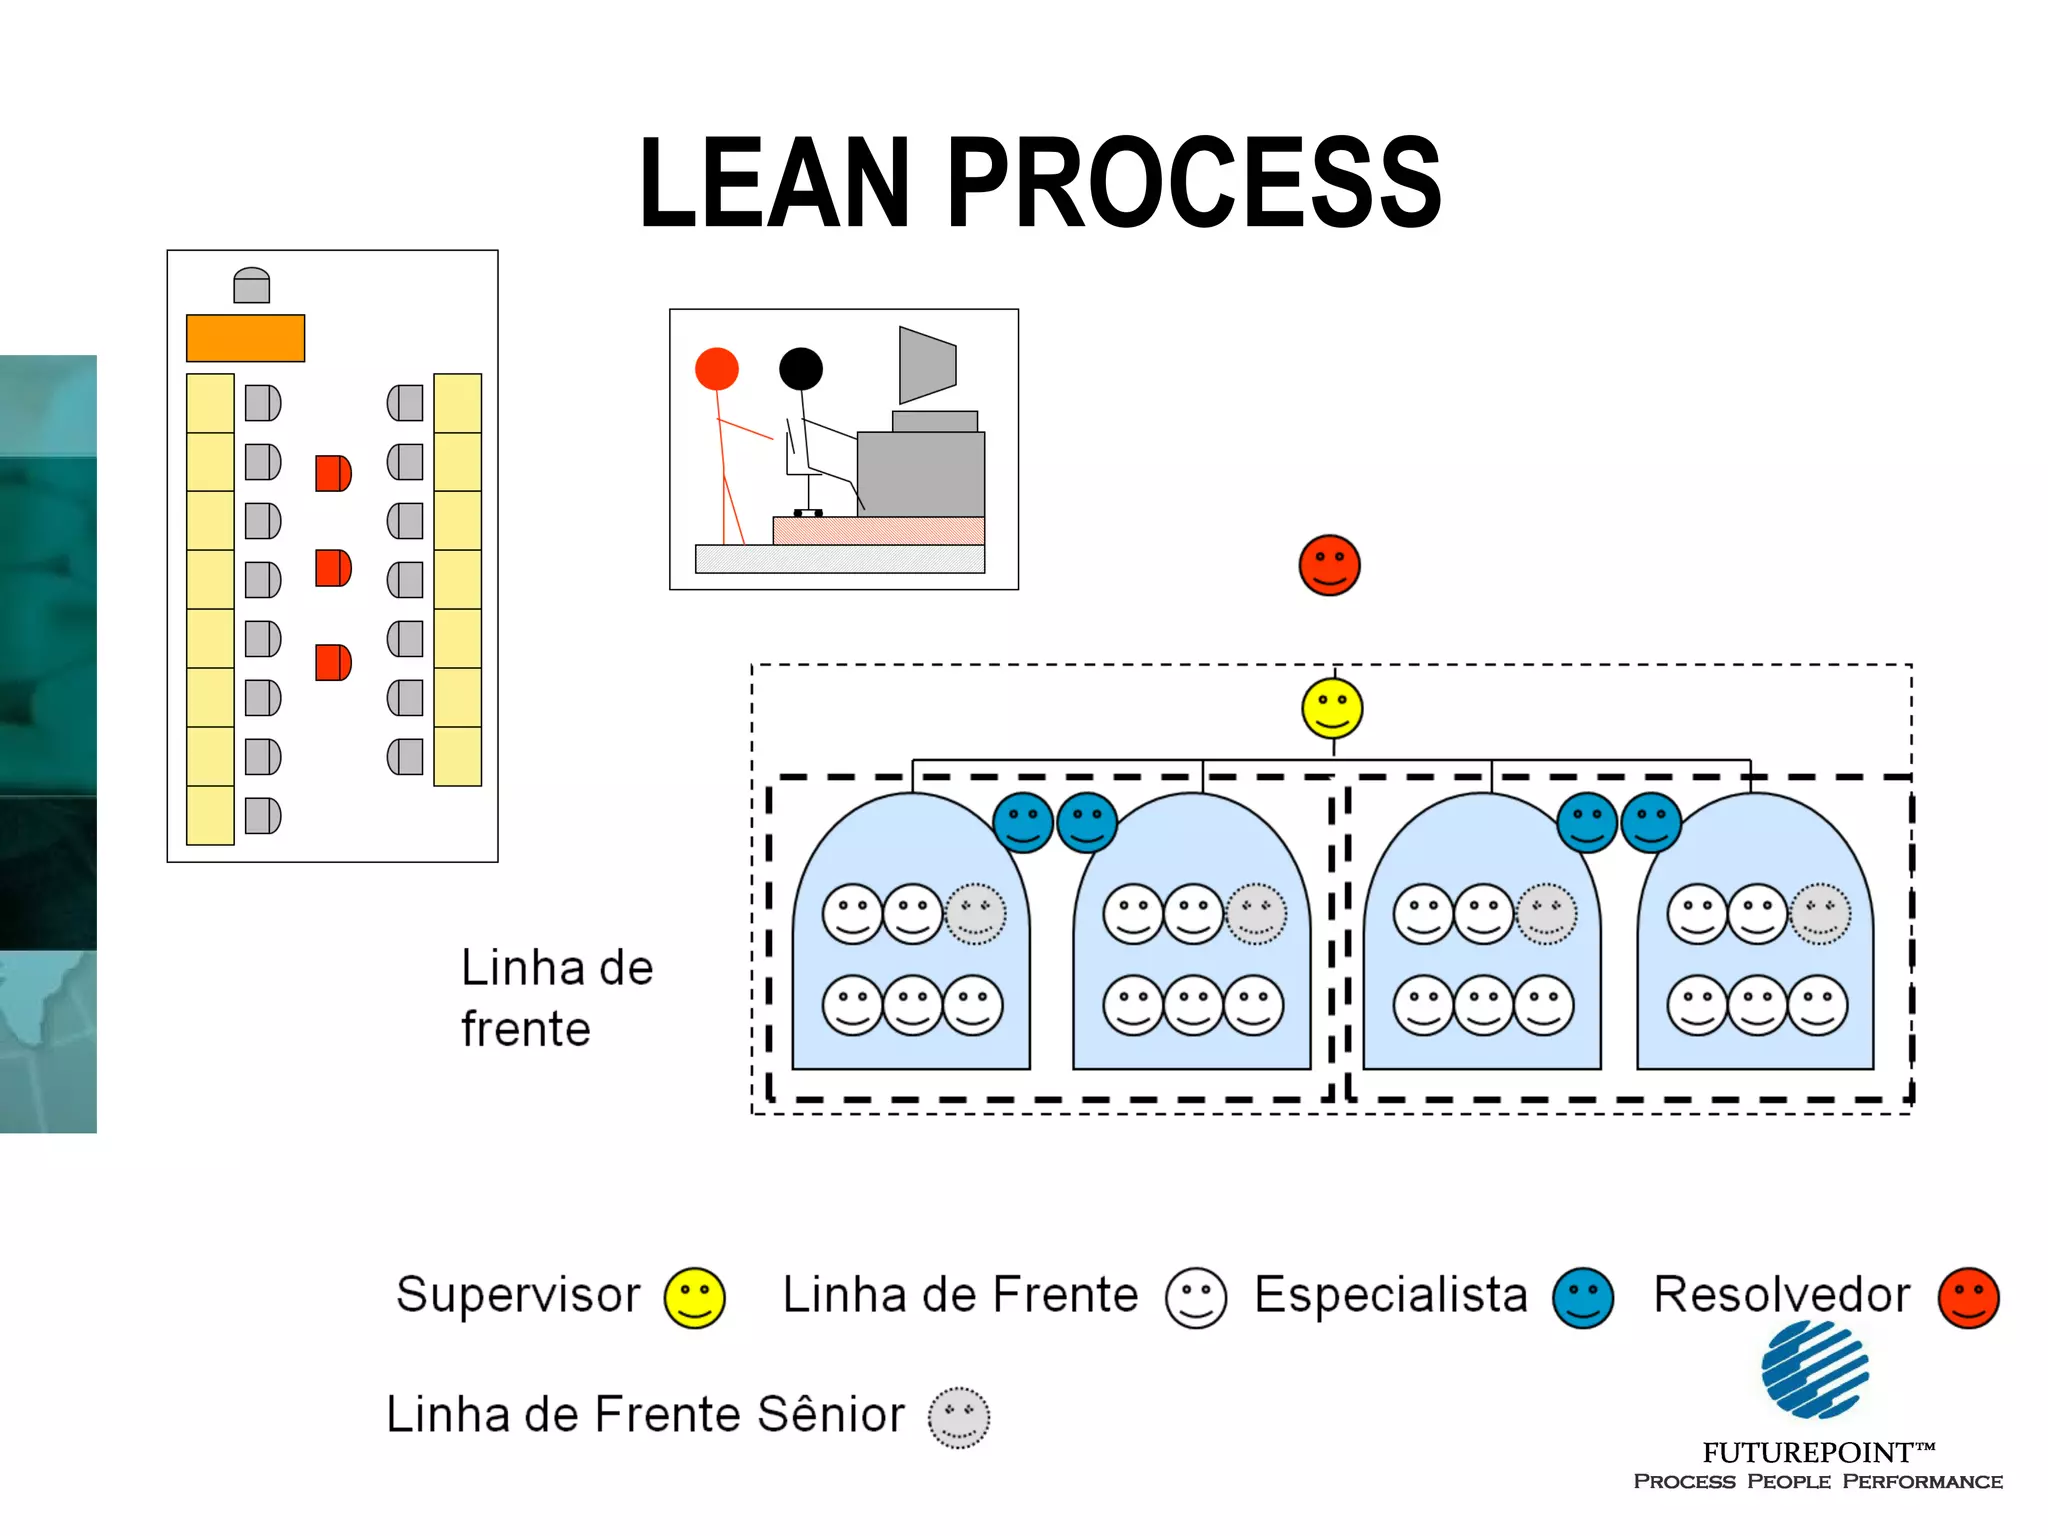
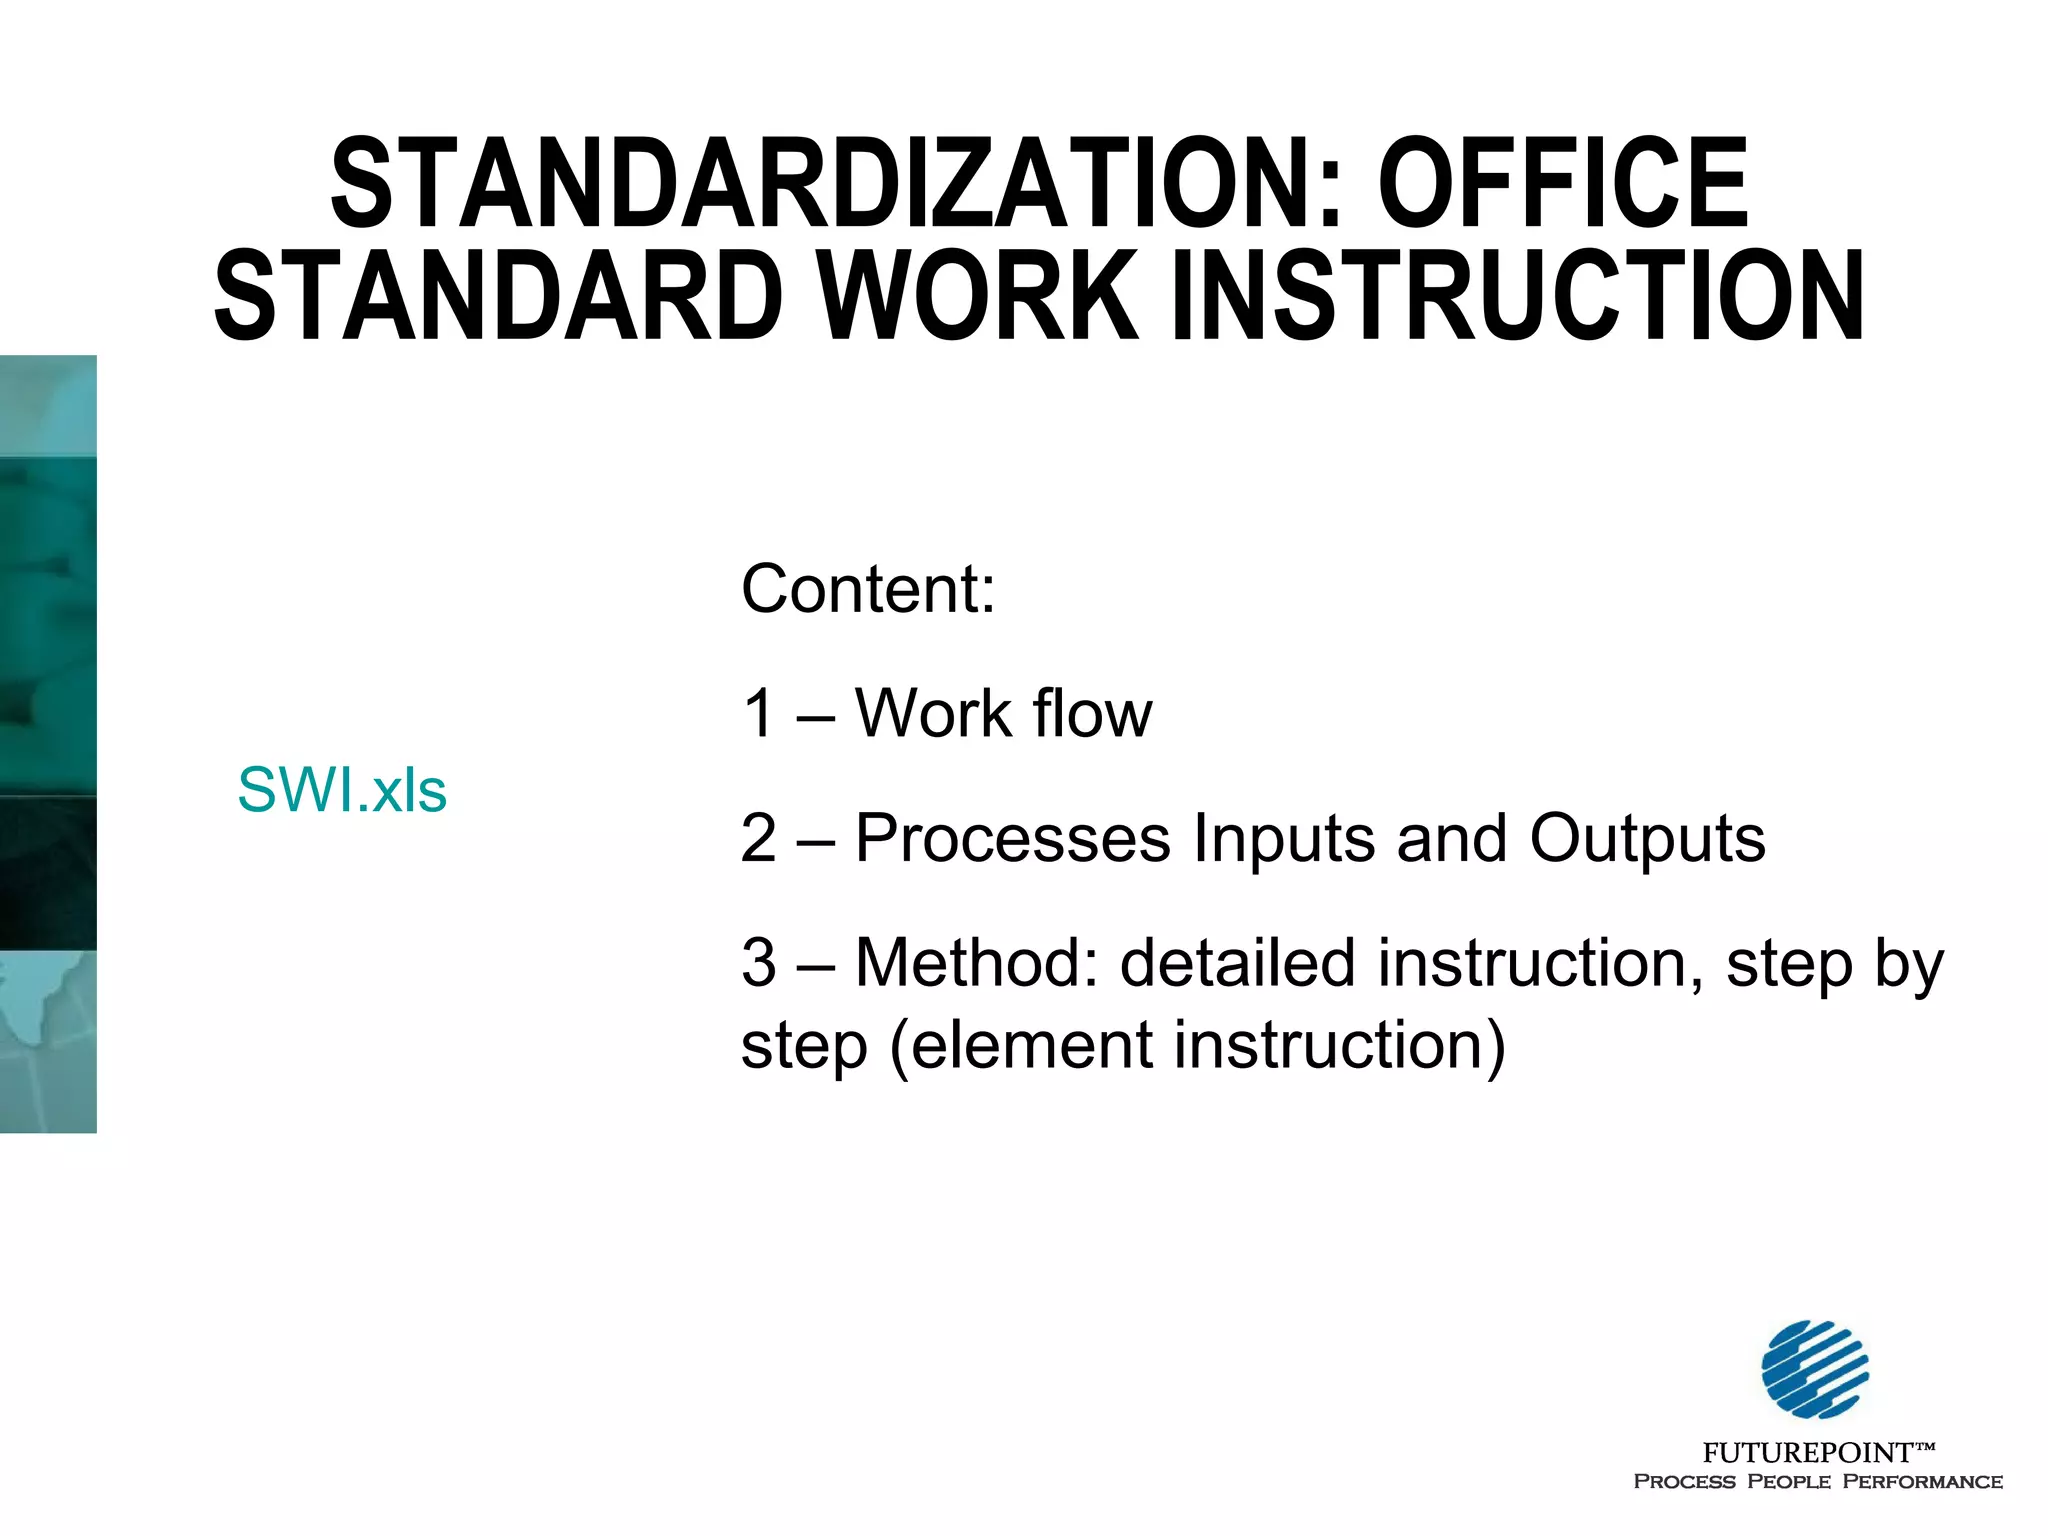


The document outlines a 6-step process for improving processes in offices. The steps include: 1) identifying what adds value for customers, 2) understanding the current process, 3) identifying wastes, 4) finding the root causes of wastes, 5) designing a high-performance process based on lean solutions, and 6) implementing actions and managing for perfection. The document provides details on each step, such as analyzing wastes using tools like value stream mapping, identifying 9 common types of wastes in offices, and proposing 3 lean solutions including improving flow, standardizing processes, and implementing quality management practices.