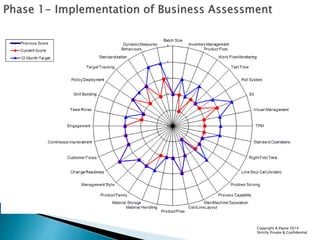
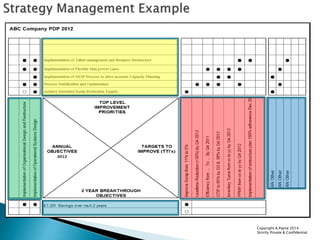
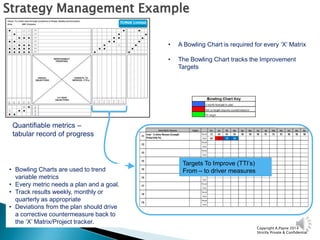
Copyright A.Payne 2014
Strictly Private & Confidential
Parts
•Batch Size
•Inventory Management
•Product Flow
•Work Flow Monitoring
•TAKT
•Pull System
Process
•5S
•Visual Management
•TPM
•Standard Operations
•Right First Time
•Line Stop Call
•Problem Solving
•Process Capability
Plant
•Man/Machine Separation
•Cell/Line Layout
•Process Flow
•Material Handling
•Material Storage
•Product Family
People
•Management Style
•Change Readiness
•Customer Focus
•Continuous Improvement
•Engagement
•Team Roles
•Skill Building
Performance
•Policy Deployment
•KPI Tracking
•Standardisation
•Behaviours
•Real Time Measure
Batch Size Score Inventory Management Score Product Flow Score Work Flow Monitoring Score
5
Batch size match minimum customer order
size. Stock management part of integrated
optimisation of stock along the supply
chain.
FIFO occurs within lots and no material is
found outside designated areas. Inventory
is stored in non-dedicated, flexible storage
locations.
Co-ordinated 1x1 production occurs for all
operations, as well as co-ordinated
shutdowns for planned downtime.
Traditional department processes (i.e.
fettling) have been “right-sized” throughout
the process.
Visual indication showing clearly a products
position against plan. In case of delay,
recovery action visible and managed by the
cell team.
4
Batch size and reorder frequency
determined by a formal capacity analysis -
based on setup time. Regular review of
parameters to set stock levels to achieve
required delivery performance.
FIFO system is “fail-safe” and inventory has
clear locations marked close to the point of
use. Inventory min/max levels are clearly
displayed.
Co-ordinated 1x1 production occurs for all
operations, as well as co-ordinated
shutdowns for planned downtime. Focus on
continuously improving set-up/changeover
efficiency.
Visual indication showing clearly a products
position against plan. In case of delay,
recovery action visible and managed by
supervision.
3
Batch size and reorder frequency
determined by a formal capacity analysis -
based on setup time. Stock levels
scientifically, but infrequently reviewed. No
corrective action after failure.
Formal system to support FIFO is in place,
but lapses occur due to lack of discipline
and/or weak design. Specific areas for
inventory are clearly labelled.
The majority (>75%) of the processes follow
1x1 production techniques and only
standard WIP is present between
processes. Mixed-model production is
utilised to reduce inventory levels &
changeovers are continuously improved.
Visual indication showing clearly a products
position against plan. No visible system to
manage and recover delays.
2
Batch size, reorder frequency and lead time
based on informal capacity analysis eg
shopfloor experience. High stock levels set
for total safety. Just in case mentality, high
obselescence.
x
Only isolated areas practice FIFO.
Designated areas for inventory may exist,
but it is not clear because there are no
labels and there is little discipline in place.
x
Production processes are located in the
same general area & some follow 1X1.
Large amounts of WIP still separate
operations & “batch” production still occurs.
Adhoc FIFO system applied, reprioritisation
of work performed regularly. x
1
Maximum batch sizes / reorder frequency
set to optimise utilisation of equipment
(based on economic batch quantity) Adhoc
stock management, emergency orders, late
deliveries.
FIFO is not practised and it is difficult to
identify locations and levels of inventory
(raw, WIP, F/G). Inventory is located away
from the point of need.
Production processes are isolated “islands”
with large amounts of WIP between
operations (i.e., departmentalised).
Products move through the production line
in large batches resulting in long throughput
times.
x No visible position of products position
against plan, products expidited
© The Manufacturing Institute 2008. All rights reserved.
Copyright A.Payne 2014
Strictly Private & Confidential
•Demand / Capacity
Management
•Scheduling
•Inventory
Management
•Logistics
•Process Foundations
•Process Stability
Copyright A.Payne 2014
Strictly Private & Confidential
 Take the Projects/Opportunities from the Business
Assessment
 Take the Projects/Kaizen Events from the VSM and
OSD
 Join them together through Strategy Management
and gain alignment within the Business.
Copyright A.Payne 2014
Strictly Private & Confidential
Copyright A.Payne 2014
Strictly Private & Confidential
• A Bowling Chart is required for every ‘X’ Matrix
• The Bowling Chart tracks the Improvement
Targets
Quantifiable metrics –
tabular record of progress
Targets To Improve (TTI’s)
From – to driver measures• Bowling Charts are used to trend
variable metrics
• Every metric needs a plan and a goal.
• Track results weekly, monthly or
quarterly as appropriate
• Deviations from the plan should drive
a corrective countermeasure back to
the ‘X’ Matrix/Project tracker.
Strategy Management Example
Copyright A.Payne 2014
Strictly Private & Confidential
Copyright A.Payne 2014
Strictly Private & Confidential
• Process
Capability
• Standard Work
• Key
Performance
Indicator/Driver
Measures
• Visual
Management
• 5S
• TPM (AM)
• Real Time
Resolution
• Single Piece /
Batch Flow
• Direct Line Feed
Delivery
• Line Balancing
• Skills Alignment
• Value stream
Mapping
• SIPS
• Linkage and
Flow
• Shift Pattern
Convergence
• SIPS
• Smoothed
Demand
Amplification
• Balancing Skills
Requirements
• SIPS
• Single Point
Scheduling
• Pulling Material
• SIPS
Stability
Synchronous
Production
Level
Production
Pull System
Continuous
Flow
C.I.
C.I. C.I.
C.I.
95%
Copyright A.Payne 2014
Strictly Private & Confidential
1. Identify a problem (your opportunity to get better)
2. Conduct research to understand the current situation
3. Develop a target or goals
4. Conduct root cause analysis
5. Devise countermeasures / recommendations to address root
causes
6. Create an implementation plan
7. Develop a follow-up plan
The results of steps 1-7 can be recorded & communicated on
an A3
9
Copyright A.Payne 2014
Strictly Private & Confidential
◦ Drives ownership, responsibility and accountability through A3
(one page plan).
◦ Covers Safety, Quality, Cost, Delivery, Productivity, Sales, People.
◦ Can be applied to all levels and functions of the business, Sales
and Marketing to Operations.
◦ Complete involvement of resources.
◦ The ability to see the abnormal from normal conditions.
◦ Embeds Coaching mentality. (Question & Challenge with dignity &
respect)
Copyright A.Payne 2014
Strictly Private & Confidential
 Help change leaders establish a clear direction and
cause for the change.
◦ Strategic Intent – Develop a clear strategy
◦ Effective group of leaders (assessment & training)
◦ Generate support from stakeholders
◦ Minimize resistance (understand threats & opportunities)
◦ Makes a Case for Change – Significant, compelling; threat or
opportunity
◦ Compelling Vision – Clear, realistic and inspiring
 Tools
◦ Stakeholder Engagement Strategy
◦ Elevator Speech
◦ Threats & Opportunities
◦ Performance Gap Analysis
CHANGE TRANSITION CURVE
Copyright A.Payne 2014
Strictly Private & Confidential
 Create mindset and behavior change through
effective communication, leadership and involvement.
◦ Create Literacy
◦ Help people understand the what, why, how and WIIFM
◦ Build capability through training
◦ Influence Mindsets
◦ Gain acceptance and involvement
 Tools
◦ Communication Strategy
◦ Control the Controllable(s)
CHANGE TRANSITION CURVE
Copyright A.Payne 2014
Strictly Private & Confidential
 Productivity increases by up to 50%
 Error Reduction 30%
 Space Reduction 20%
 Inventory Reduction >50%
 Leadtime reduction >50%
Execute & Drive the plan will deliver
Copyright A.Payne 2014
Strictly Private & Confidential
For Further Information please contact
TCMUK Limited
Call 0845 643 4094
www.totalchangemanagment.co.uk
enquiry@totalchangemanagement.co.uk

A Guide to Operational Excellence

  • 2.
    Copyright A.Payne 2014 StrictlyPrivate & Confidential Parts •Batch Size •Inventory Management •Product Flow •Work Flow Monitoring •TAKT •Pull System Process •5S •Visual Management •TPM •Standard Operations •Right First Time •Line Stop Call •Problem Solving •Process Capability Plant •Man/Machine Separation •Cell/Line Layout •Process Flow •Material Handling •Material Storage •Product Family People •Management Style •Change Readiness •Customer Focus •Continuous Improvement •Engagement •Team Roles •Skill Building Performance •Policy Deployment •KPI Tracking •Standardisation •Behaviours •Real Time Measure Batch Size Score Inventory Management Score Product Flow Score Work Flow Monitoring Score 5 Batch size match minimum customer order size. Stock management part of integrated optimisation of stock along the supply chain. FIFO occurs within lots and no material is found outside designated areas. Inventory is stored in non-dedicated, flexible storage locations. Co-ordinated 1x1 production occurs for all operations, as well as co-ordinated shutdowns for planned downtime. Traditional department processes (i.e. fettling) have been “right-sized” throughout the process. Visual indication showing clearly a products position against plan. In case of delay, recovery action visible and managed by the cell team. 4 Batch size and reorder frequency determined by a formal capacity analysis - based on setup time. Regular review of parameters to set stock levels to achieve required delivery performance. FIFO system is “fail-safe” and inventory has clear locations marked close to the point of use. Inventory min/max levels are clearly displayed. Co-ordinated 1x1 production occurs for all operations, as well as co-ordinated shutdowns for planned downtime. Focus on continuously improving set-up/changeover efficiency. Visual indication showing clearly a products position against plan. In case of delay, recovery action visible and managed by supervision. 3 Batch size and reorder frequency determined by a formal capacity analysis - based on setup time. Stock levels scientifically, but infrequently reviewed. No corrective action after failure. Formal system to support FIFO is in place, but lapses occur due to lack of discipline and/or weak design. Specific areas for inventory are clearly labelled. The majority (>75%) of the processes follow 1x1 production techniques and only standard WIP is present between processes. Mixed-model production is utilised to reduce inventory levels & changeovers are continuously improved. Visual indication showing clearly a products position against plan. No visible system to manage and recover delays. 2 Batch size, reorder frequency and lead time based on informal capacity analysis eg shopfloor experience. High stock levels set for total safety. Just in case mentality, high obselescence. x Only isolated areas practice FIFO. Designated areas for inventory may exist, but it is not clear because there are no labels and there is little discipline in place. x Production processes are located in the same general area & some follow 1X1. Large amounts of WIP still separate operations & “batch” production still occurs. Adhoc FIFO system applied, reprioritisation of work performed regularly. x 1 Maximum batch sizes / reorder frequency set to optimise utilisation of equipment (based on economic batch quantity) Adhoc stock management, emergency orders, late deliveries. FIFO is not practised and it is difficult to identify locations and levels of inventory (raw, WIP, F/G). Inventory is located away from the point of need. Production processes are isolated “islands” with large amounts of WIP between operations (i.e., departmentalised). Products move through the production line in large batches resulting in long throughput times. x No visible position of products position against plan, products expidited © The Manufacturing Institute 2008. All rights reserved.
  • 3.
    Copyright A.Payne 2014 StrictlyPrivate & Confidential •Demand / Capacity Management •Scheduling •Inventory Management •Logistics •Process Foundations •Process Stability
  • 4.
    Copyright A.Payne 2014 StrictlyPrivate & Confidential  Take the Projects/Opportunities from the Business Assessment  Take the Projects/Kaizen Events from the VSM and OSD  Join them together through Strategy Management and gain alignment within the Business.
  • 5.
    Copyright A.Payne 2014 StrictlyPrivate & Confidential
  • 6.
    Copyright A.Payne 2014 StrictlyPrivate & Confidential • A Bowling Chart is required for every ‘X’ Matrix • The Bowling Chart tracks the Improvement Targets Quantifiable metrics – tabular record of progress Targets To Improve (TTI’s) From – to driver measures• Bowling Charts are used to trend variable metrics • Every metric needs a plan and a goal. • Track results weekly, monthly or quarterly as appropriate • Deviations from the plan should drive a corrective countermeasure back to the ‘X’ Matrix/Project tracker. Strategy Management Example
  • 7.
    Copyright A.Payne 2014 StrictlyPrivate & Confidential
  • 8.
    Copyright A.Payne 2014 StrictlyPrivate & Confidential • Process Capability • Standard Work • Key Performance Indicator/Driver Measures • Visual Management • 5S • TPM (AM) • Real Time Resolution • Single Piece / Batch Flow • Direct Line Feed Delivery • Line Balancing • Skills Alignment • Value stream Mapping • SIPS • Linkage and Flow • Shift Pattern Convergence • SIPS • Smoothed Demand Amplification • Balancing Skills Requirements • SIPS • Single Point Scheduling • Pulling Material • SIPS Stability Synchronous Production Level Production Pull System Continuous Flow C.I. C.I. C.I. C.I. 95%
  • 9.
    Copyright A.Payne 2014 StrictlyPrivate & Confidential 1. Identify a problem (your opportunity to get better) 2. Conduct research to understand the current situation 3. Develop a target or goals 4. Conduct root cause analysis 5. Devise countermeasures / recommendations to address root causes 6. Create an implementation plan 7. Develop a follow-up plan The results of steps 1-7 can be recorded & communicated on an A3 9
  • 10.
    Copyright A.Payne 2014 StrictlyPrivate & Confidential ◦ Drives ownership, responsibility and accountability through A3 (one page plan). ◦ Covers Safety, Quality, Cost, Delivery, Productivity, Sales, People. ◦ Can be applied to all levels and functions of the business, Sales and Marketing to Operations. ◦ Complete involvement of resources. ◦ The ability to see the abnormal from normal conditions. ◦ Embeds Coaching mentality. (Question & Challenge with dignity & respect)
  • 11.
    Copyright A.Payne 2014 StrictlyPrivate & Confidential  Help change leaders establish a clear direction and cause for the change. ◦ Strategic Intent – Develop a clear strategy ◦ Effective group of leaders (assessment & training) ◦ Generate support from stakeholders ◦ Minimize resistance (understand threats & opportunities) ◦ Makes a Case for Change – Significant, compelling; threat or opportunity ◦ Compelling Vision – Clear, realistic and inspiring  Tools ◦ Stakeholder Engagement Strategy ◦ Elevator Speech ◦ Threats & Opportunities ◦ Performance Gap Analysis CHANGE TRANSITION CURVE
  • 12.
    Copyright A.Payne 2014 StrictlyPrivate & Confidential  Create mindset and behavior change through effective communication, leadership and involvement. ◦ Create Literacy ◦ Help people understand the what, why, how and WIIFM ◦ Build capability through training ◦ Influence Mindsets ◦ Gain acceptance and involvement  Tools ◦ Communication Strategy ◦ Control the Controllable(s) CHANGE TRANSITION CURVE
  • 13.
    Copyright A.Payne 2014 StrictlyPrivate & Confidential  Productivity increases by up to 50%  Error Reduction 30%  Space Reduction 20%  Inventory Reduction >50%  Leadtime reduction >50% Execute & Drive the plan will deliver
  • 14.
    Copyright A.Payne 2014 StrictlyPrivate & Confidential For Further Information please contact TCMUK Limited Call 0845 643 4094 www.totalchangemanagment.co.uk enquiry@totalchangemanagement.co.uk

Editor's Notes

  • #10 REQUIRED DO: Read slide. SAY: These steps should not take place in isolation. Communication should be happening all through the process, from identifying the problem, through analyzing the situation, suggesting countermeasures and preparing action plans. A3 thinking is not just logical and structured, it is visual. The steps we just reviewed are captured and diagramed on that one sheet of A3 paper. Let’s have a look. Next slide.