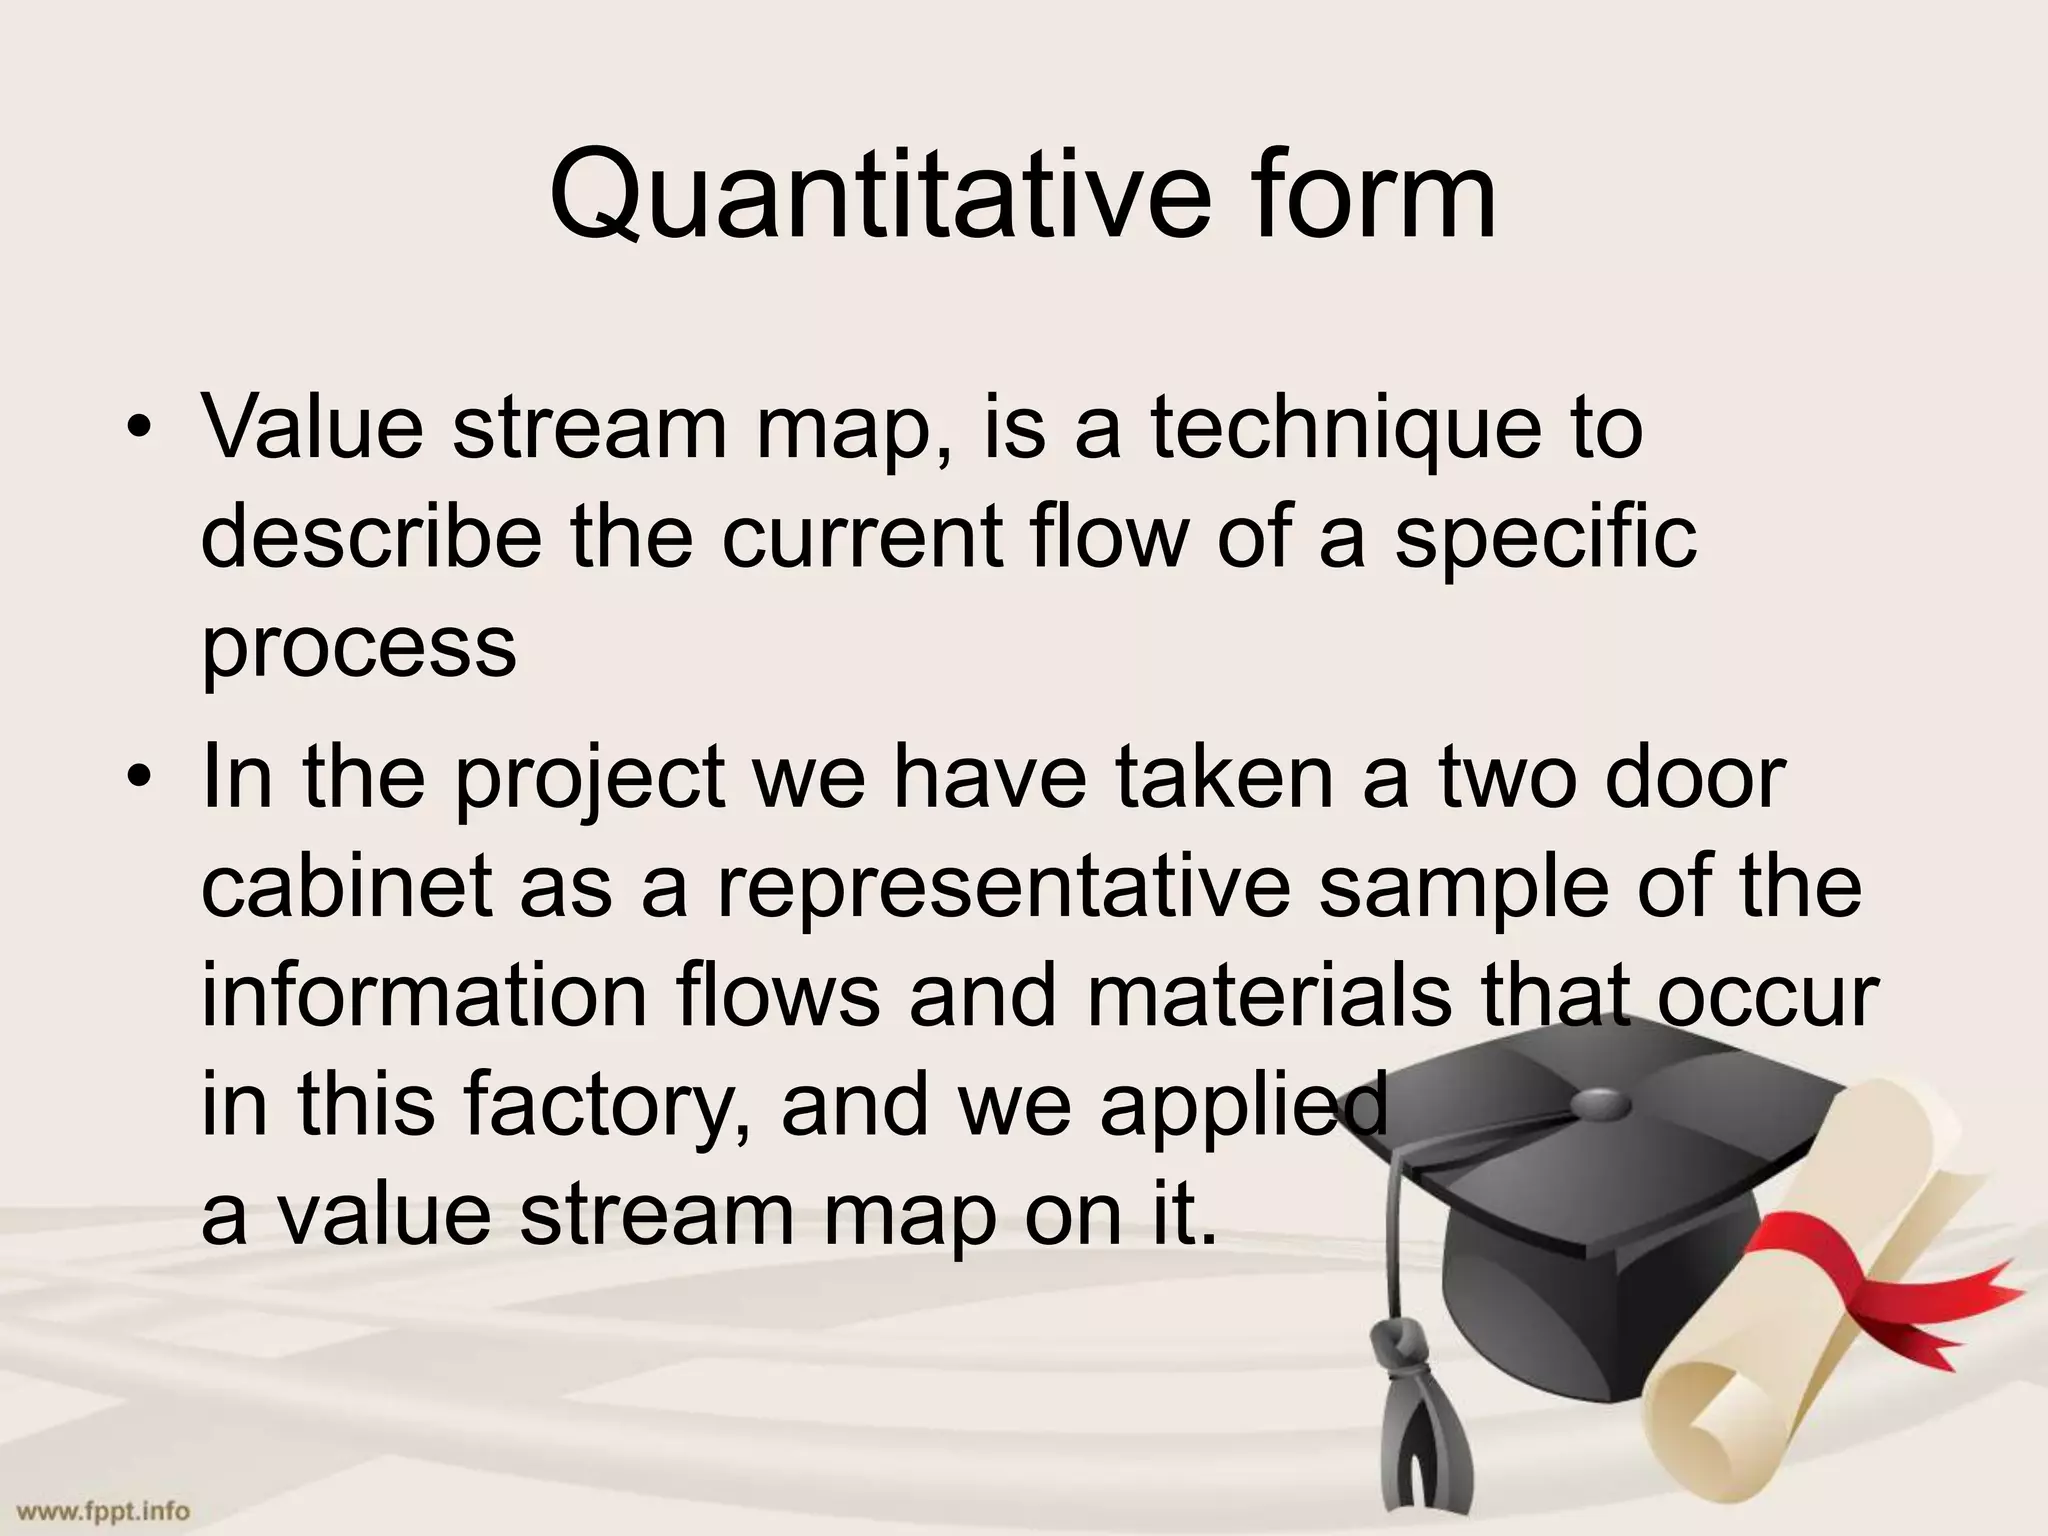
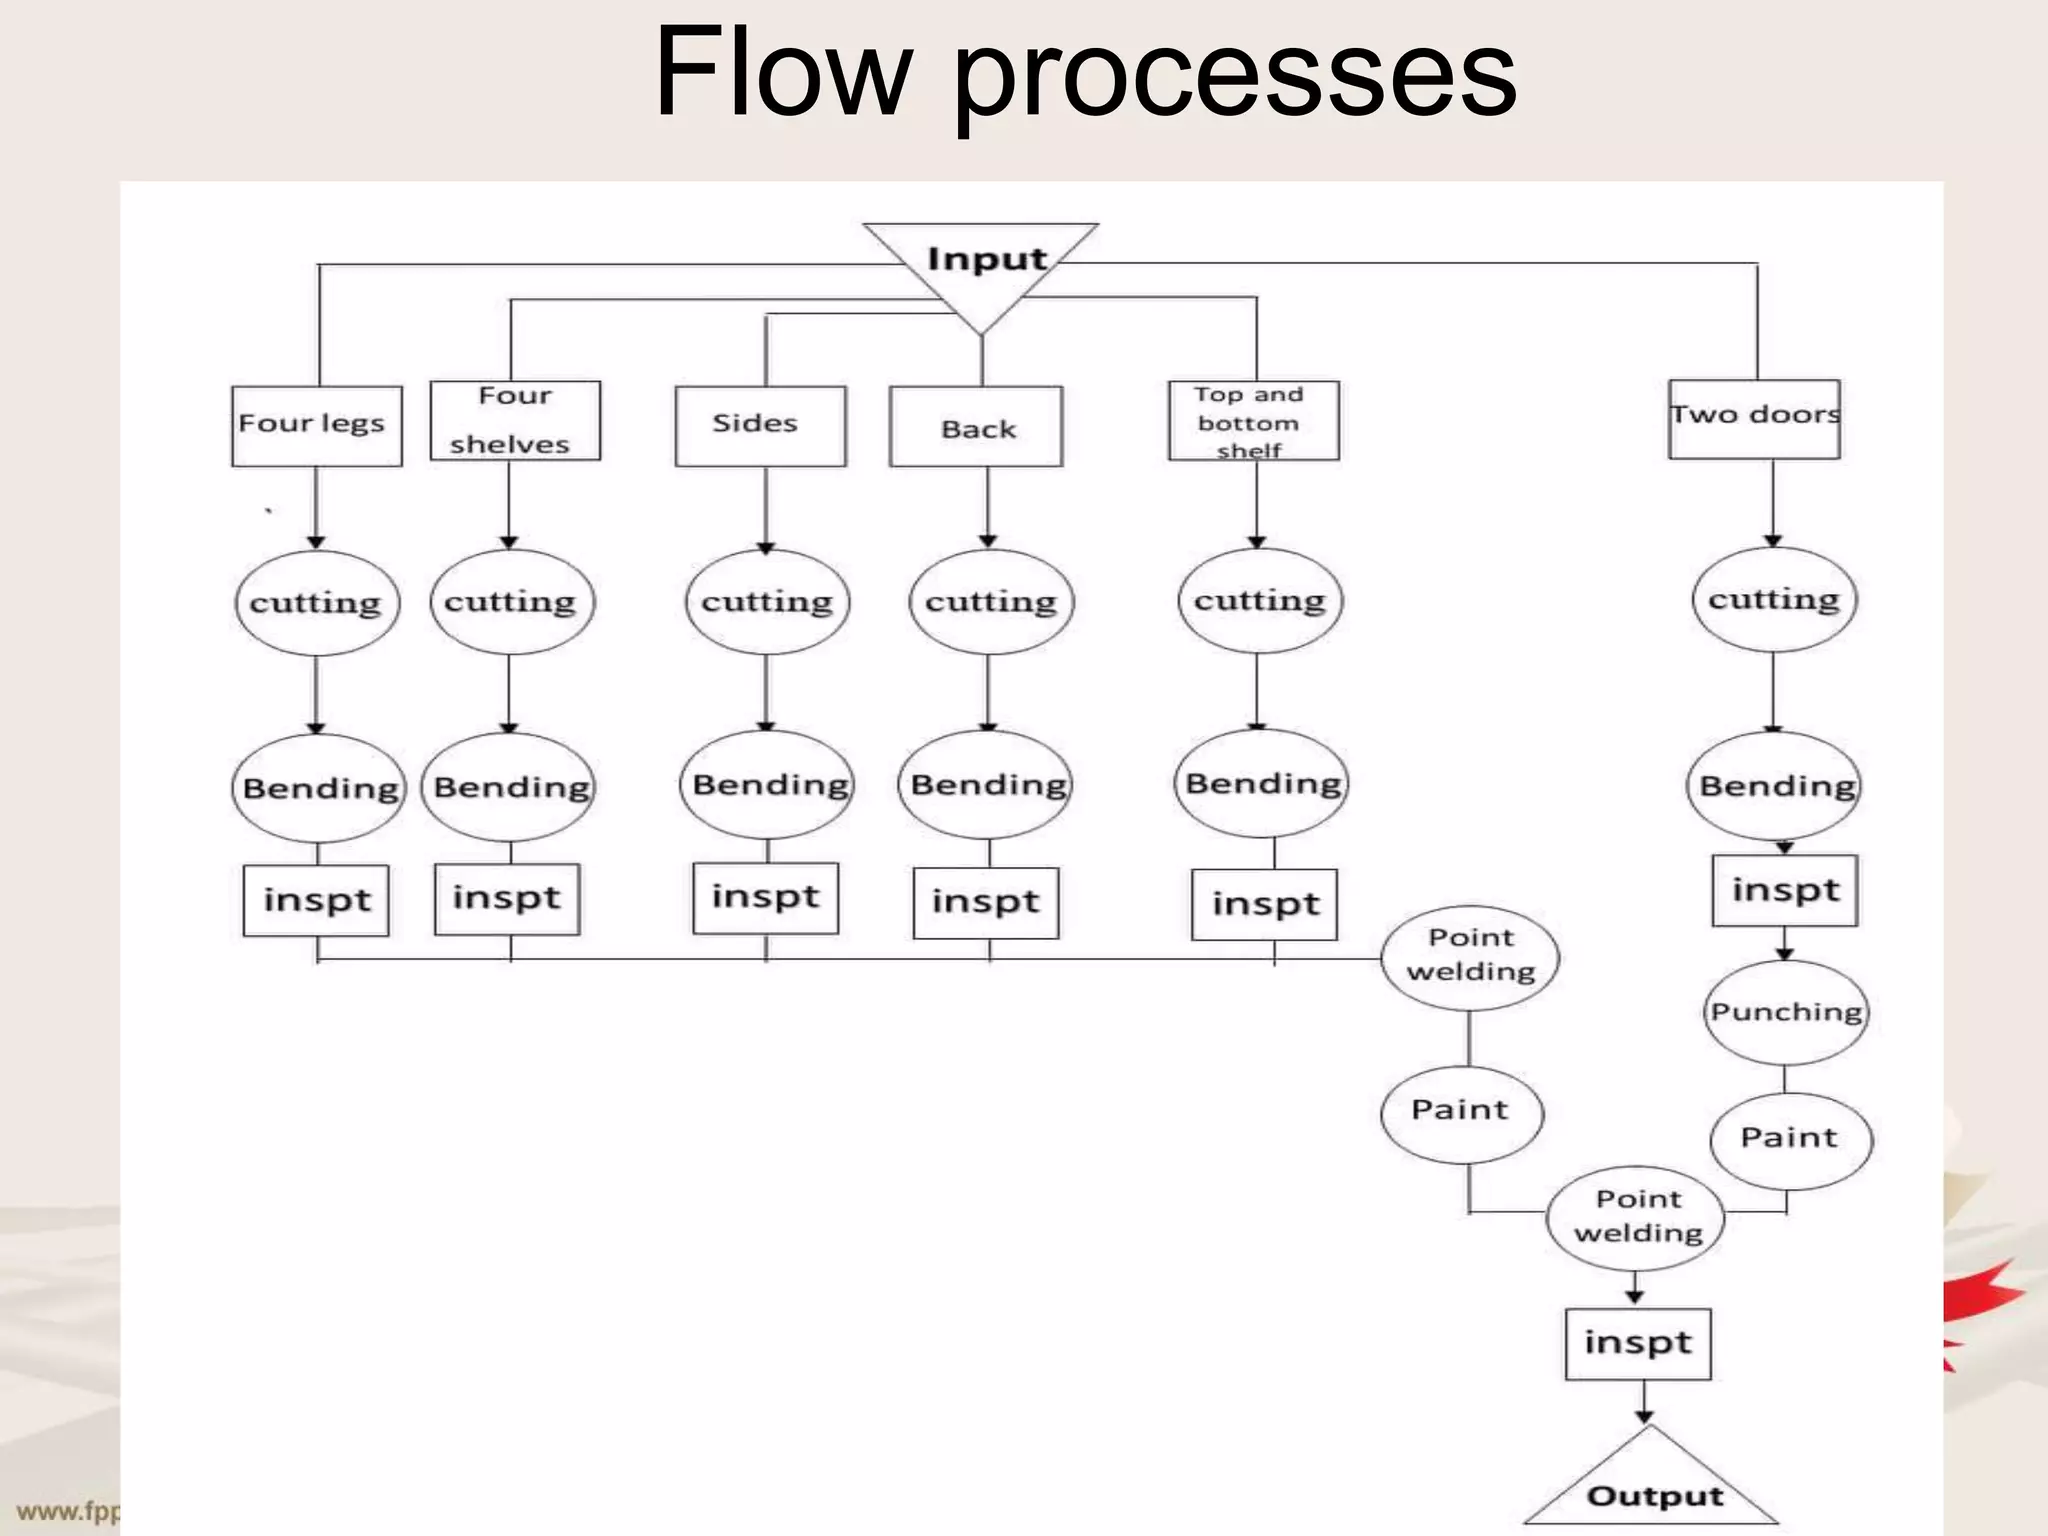
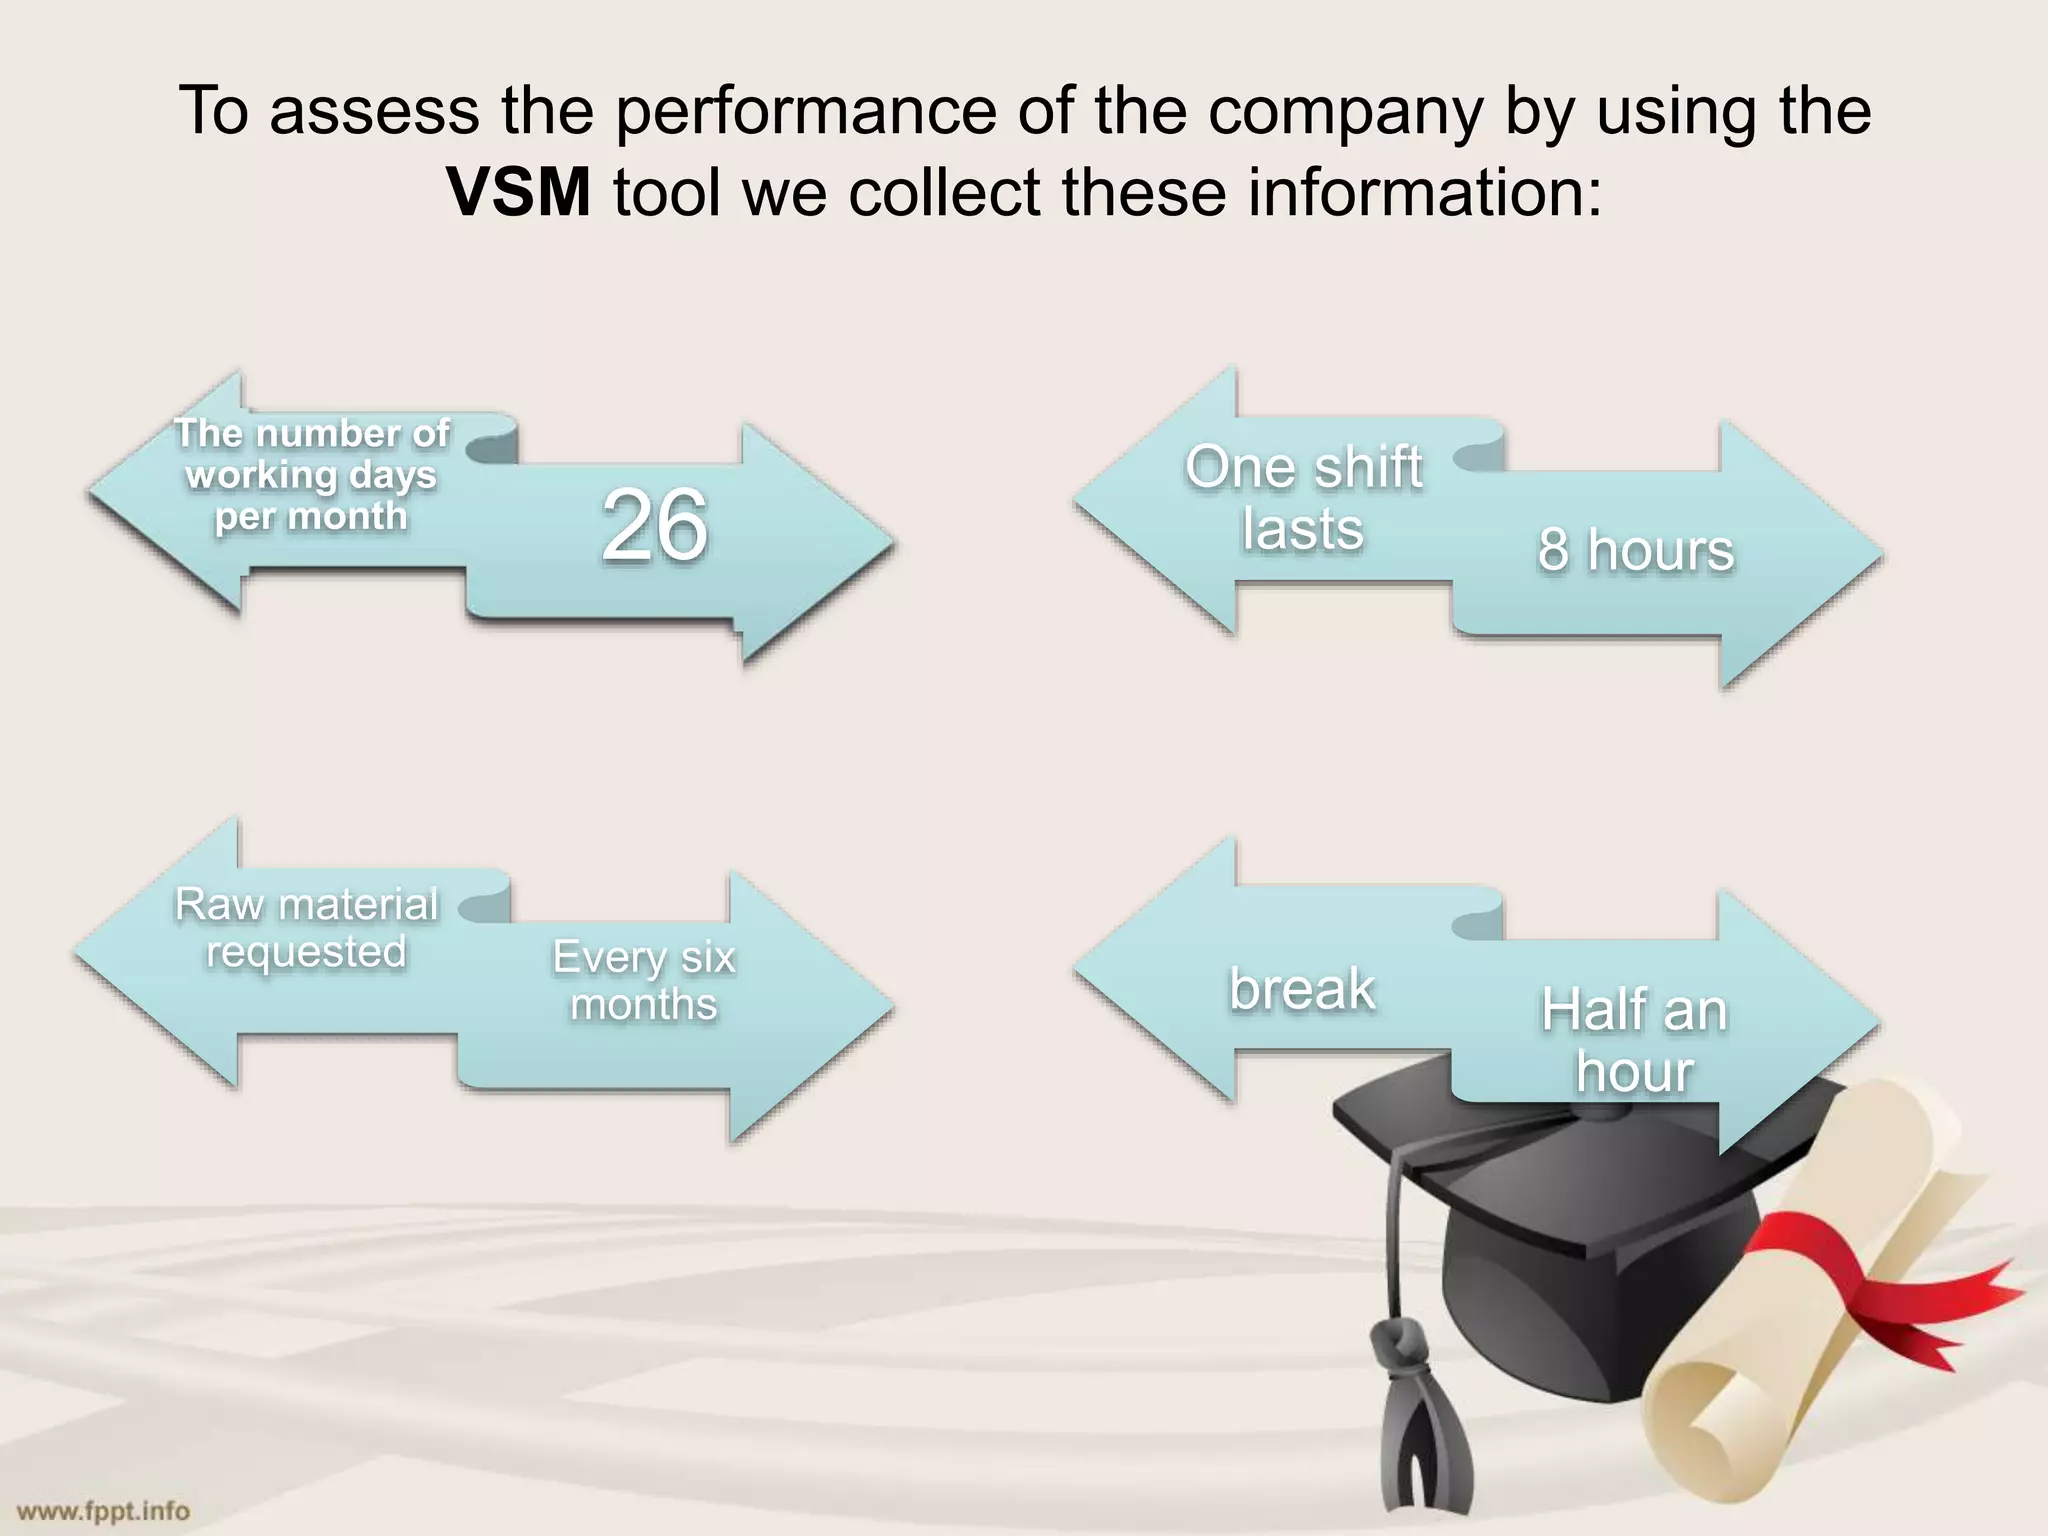
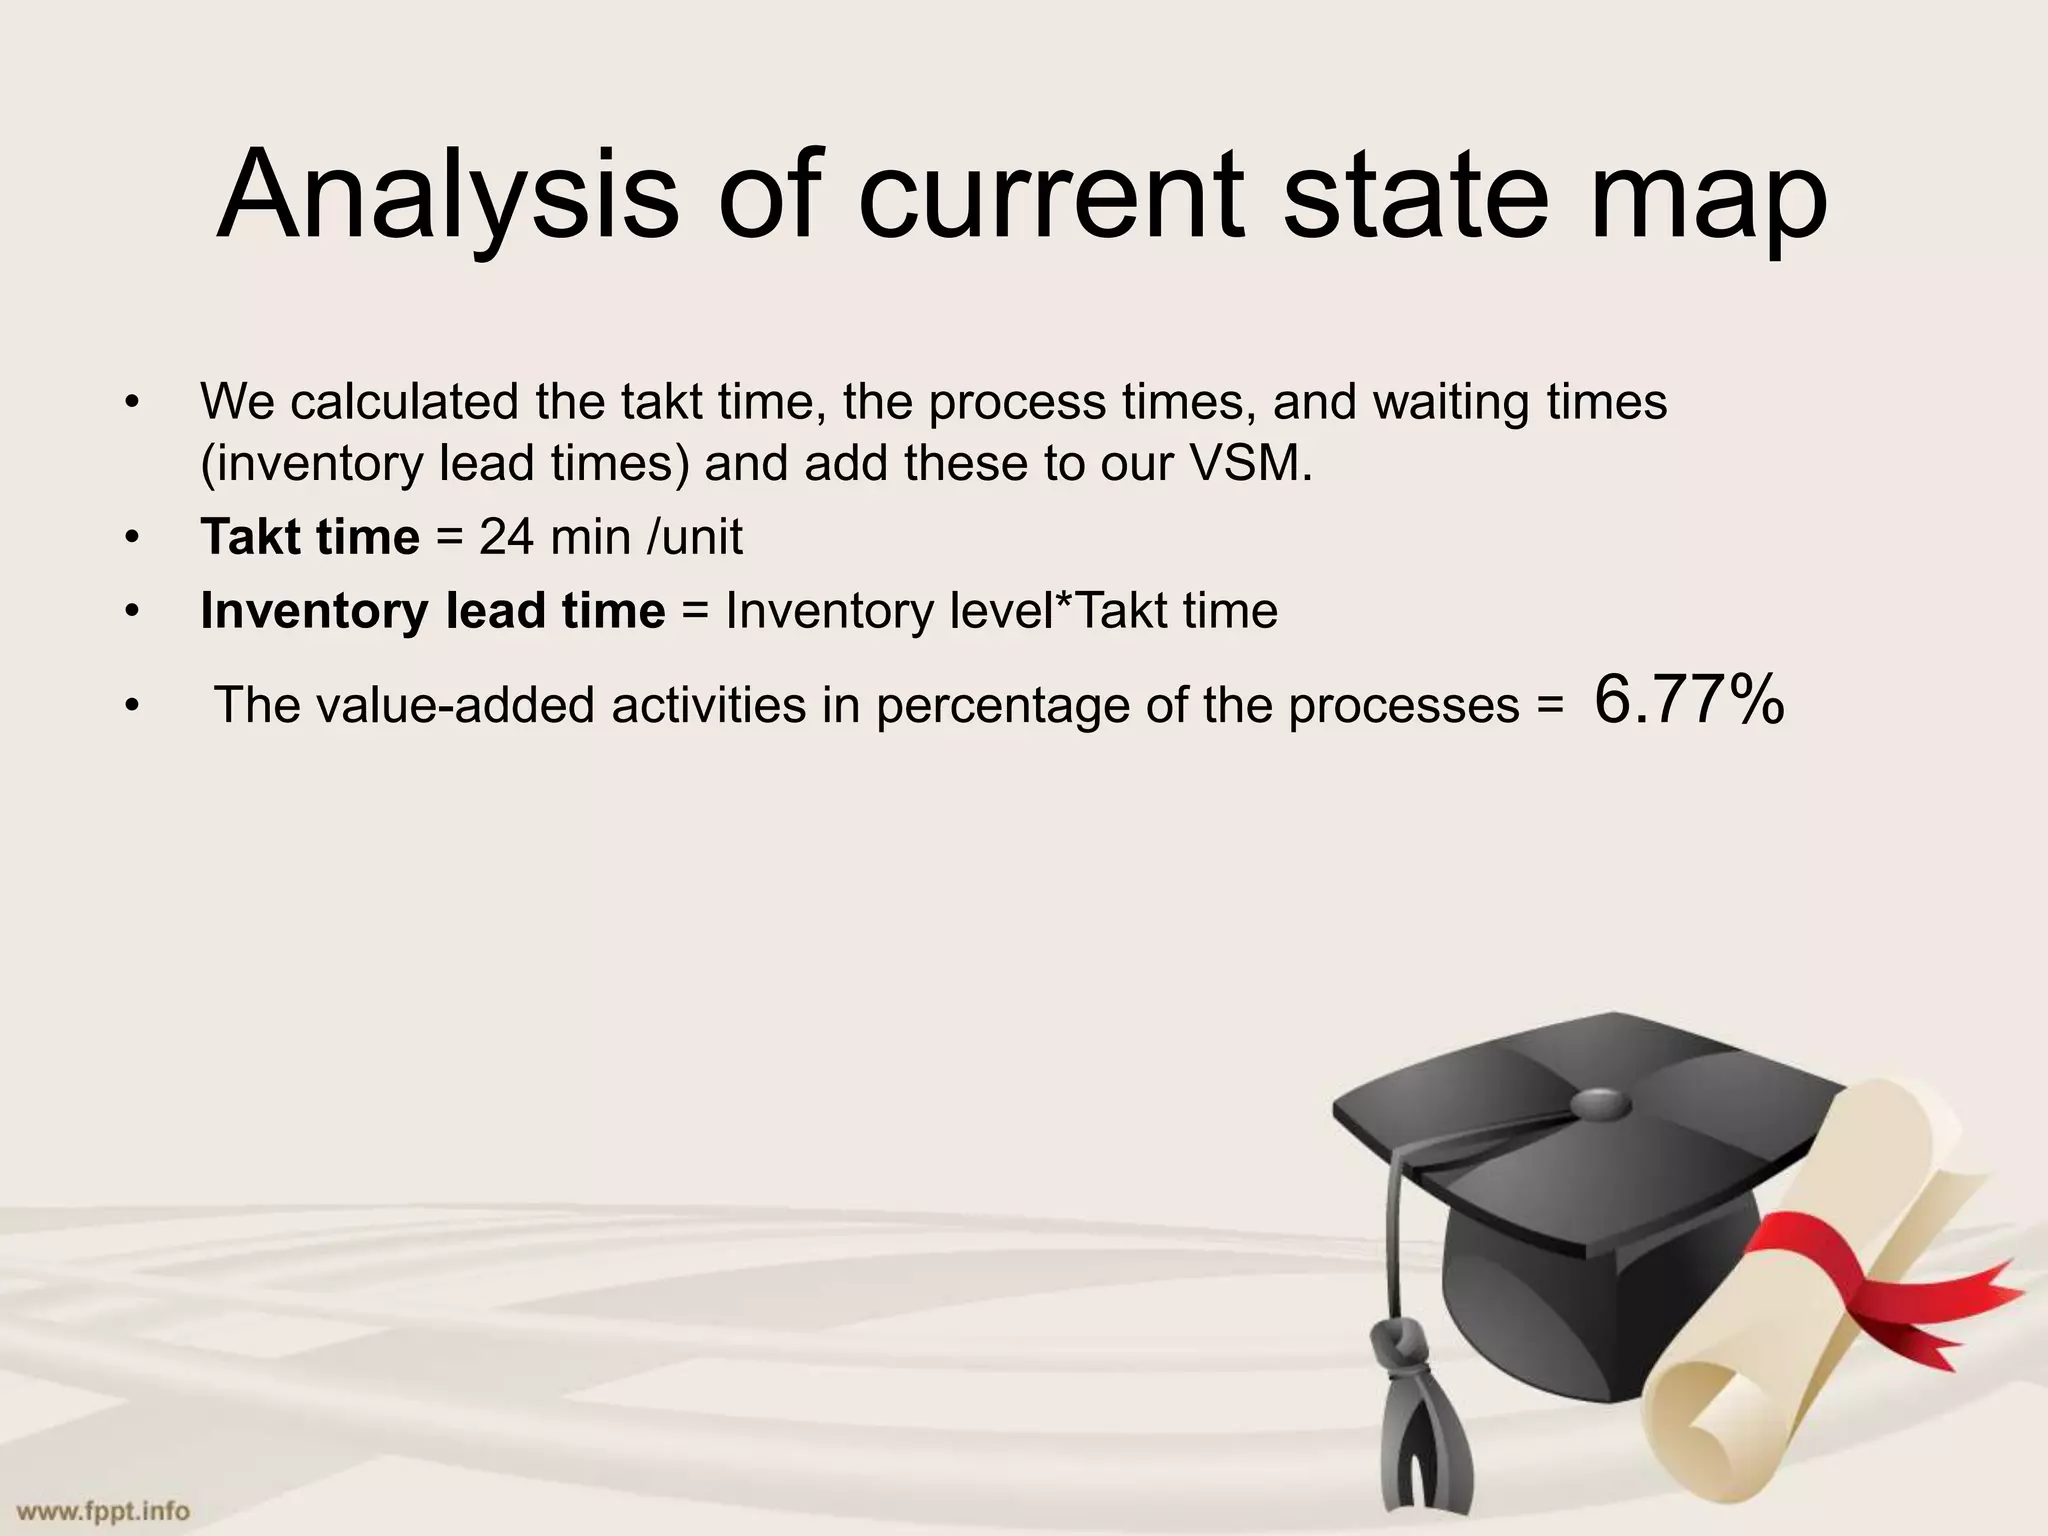
Title
Applying lean manufacturing concepts in
furniture factory: case study-based project.
Supervised by:
Dr. Moawia Ramadan
Prepared by: Dina Hijab
Majeda Hussain
Musab Nazzal
Shahd Saye
d
Introduction
• in project 1 we defined the problem in
Aldajani factory as accumulation of huge
amounts of waste, and we found that lean
manufacturing technique is a successful
way to solve this problem.
• The main objective of the project, is to
apply many techniques of lean
manufacturing techniques in Al-Dajani co.
to remove / or reduce waste resulting from
many sections that exist in the metal
furniture factory.
• So, we applied techniques
like 5s, value stream map and
cause-effect diagram)
Definition and frame work
• We will start with the project using the
methodology of “define, measure, analyze,
improve and control” (DMAIC).
Measure
• We measure some of the waste by the
engineering sense (qualitative form) and
some of them by specific tools like VSM
(quantitative form).
Qualitative form
• Motion waste.
• Transportation waste.
• Inventory waste.
• Waiting waste.
• Defects waste.
Type of waste Description Observed
Motion 1 Poor workstation layout Yes
2 Shared equipment and machines Yes
3 Poor production planning Yes
4 Poor process design Yes
Transportation 1 Poor layouts – large distance between operations Yes
2 Large Batch sizes No
3 Multiple storage facilities Yes
Inventory 1 Overproduction of goods Yes
2 Inventory defects Yes
3 Huge amount of raw material Yes
4 Delays in production Yes
Waiting 1 Unplanned downtime or Idle equipment Yes
2 Long or delayed set-up times No
3 Lack of process control No
4 Poor process communication Yes
Defects 1 Poor quality control at the production level No
2 Poor machine repair Yes
3 Lack of process standards Yes
4 Not understanding your customers’ needs No
Quantitative form
• Value stream map, is a technique to
describe the current flow of a specific
process
• In the project we have taken a two door
cabinet as a representative sample of the
information flows and materials that occur
in this factory, and we applied
a value stream map on it.
Flow processes
Product family
Current state drawing
Future state drawing
Work plan and
implementation
To assess the performance of the company by using the
VSM tool we collect these information:
The number of
working days
per month
26
One shift
lasts 8 hours
break Half an
hour
Raw material
requested Every six
months
Analysis of current state map
• We calculated the takt time, the process times, and waiting times
(inventory lead times) and add these to our VSM.
• Takt time = 24 min /unit
• Inventory lead time = Inventory level*Takt time
• The value-added activities in percentage of the processes = 6.77%
Analyze process capacity
• Achieving balance between the customer’s
demand and the capacity of the production
process so that there is a balance between the
time-specific operations for each process. Also,
there must be a balance in the arrangement and
sequencing of products so that we achieve a
stable and predictable production pace.
• There are two steps to achieve this
balance :
1. Compare the time it takes to make one
piece with the takt time.
2. Assess the balance of the production
processes, by comparing the time of each
process with respect to the others, this helps
to determine the potential bottlenecks for
this process,
• We studied the bottleneck in order to calculate the maximum
output.
• maximum output = 3.2 unit
• This means that the company can produce 3 pieces in
the one-way tour instead of producing one piece. So
they can produce 41 pieces.
• In comparison with the customer’s
request, it is possible to fulfill the
request within two days in addition
to the day of the paint.
Waiting
Transportation
Inventory
Motion
Over
production
Over
processing
Defects
TIM
WOOD
The future state map
1. Move towards continuous flow (Kanban)
“Flow where you can, pull where you must“
2. Rebalancing the process
3. Kaizen
(continuous
improvement)
After analyzing the current situation of the
company we set a specific steps for
improvement.
using our results, kaizen and kampan
methods we draw a template for the future
state map which shows the progress of the
process after applying all the changes to it.
Recommendations:
1. Commitment to safety instructions, and keep aisles clear
from obstacles Continuous cleaning for the workplace
through following programmed cleaning schedule.
2. Maintain the arrangement of tools used in manufacturing
operations.
3. Give workers standard operating procedures in order to
reduce defects and increase productivity.
4. The necessity of employing an industrial engineer to
follow up an application of lean system in order to
improve quality and reduce wastes.
5. Improve the factory lighting system.
6. Better production planning in order to reduce the
excessive amount of inventory.
7. Using CNC method to cut the metallic boards in order
to reduce waste.
8. making new products using the waste of material such
as producing second hand tables or cabinet.
9. Improve their marketing skills to build bridges to reach
customers’ needs and fulfill it.
10. Also there is no website showing their
products and that is considered something
important due to online purchasing.

ppt-project-final.ppt

  • 1.
    Title Applying lean manufacturingconcepts in furniture factory: case study-based project. Supervised by: Dr. Moawia Ramadan Prepared by: Dina Hijab Majeda Hussain Musab Nazzal Shahd Saye d
  • 2.
    Introduction • in project1 we defined the problem in Aldajani factory as accumulation of huge amounts of waste, and we found that lean manufacturing technique is a successful way to solve this problem.
  • 3.
    • The mainobjective of the project, is to apply many techniques of lean manufacturing techniques in Al-Dajani co. to remove / or reduce waste resulting from many sections that exist in the metal furniture factory. • So, we applied techniques like 5s, value stream map and cause-effect diagram) Definition and frame work
  • 4.
    • We willstart with the project using the methodology of “define, measure, analyze, improve and control” (DMAIC).
  • 5.
    Measure • We measuresome of the waste by the engineering sense (qualitative form) and some of them by specific tools like VSM (quantitative form).
  • 6.
    Qualitative form • Motionwaste. • Transportation waste. • Inventory waste. • Waiting waste. • Defects waste.
  • 7.
    Type of wasteDescription Observed Motion 1 Poor workstation layout Yes 2 Shared equipment and machines Yes 3 Poor production planning Yes 4 Poor process design Yes Transportation 1 Poor layouts – large distance between operations Yes 2 Large Batch sizes No 3 Multiple storage facilities Yes Inventory 1 Overproduction of goods Yes 2 Inventory defects Yes 3 Huge amount of raw material Yes 4 Delays in production Yes Waiting 1 Unplanned downtime or Idle equipment Yes 2 Long or delayed set-up times No 3 Lack of process control No 4 Poor process communication Yes Defects 1 Poor quality control at the production level No 2 Poor machine repair Yes 3 Lack of process standards Yes 4 Not understanding your customers’ needs No
  • 8.
    Quantitative form • Valuestream map, is a technique to describe the current flow of a specific process • In the project we have taken a two door cabinet as a representative sample of the information flows and materials that occur in this factory, and we applied a value stream map on it.
  • 9.
  • 10.
    Product family Current statedrawing Future state drawing Work plan and implementation
  • 11.
    To assess theperformance of the company by using the VSM tool we collect these information: The number of working days per month 26 One shift lasts 8 hours break Half an hour Raw material requested Every six months
  • 13.
    Analysis of currentstate map • We calculated the takt time, the process times, and waiting times (inventory lead times) and add these to our VSM. • Takt time = 24 min /unit • Inventory lead time = Inventory level*Takt time • The value-added activities in percentage of the processes = 6.77%
  • 15.
    Analyze process capacity •Achieving balance between the customer’s demand and the capacity of the production process so that there is a balance between the time-specific operations for each process. Also, there must be a balance in the arrangement and sequencing of products so that we achieve a stable and predictable production pace.
  • 16.
    • There aretwo steps to achieve this balance : 1. Compare the time it takes to make one piece with the takt time. 2. Assess the balance of the production processes, by comparing the time of each process with respect to the others, this helps to determine the potential bottlenecks for this process,
  • 19.
    • We studiedthe bottleneck in order to calculate the maximum output. • maximum output = 3.2 unit • This means that the company can produce 3 pieces in the one-way tour instead of producing one piece. So they can produce 41 pieces. • In comparison with the customer’s request, it is possible to fulfill the request within two days in addition to the day of the paint.
  • 20.
  • 21.
    The future statemap 1. Move towards continuous flow (Kanban) “Flow where you can, pull where you must“ 2. Rebalancing the process 3. Kaizen (continuous improvement)
  • 22.
    After analyzing thecurrent situation of the company we set a specific steps for improvement. using our results, kaizen and kampan methods we draw a template for the future state map which shows the progress of the process after applying all the changes to it.
  • 24.
    Recommendations: 1. Commitment tosafety instructions, and keep aisles clear from obstacles Continuous cleaning for the workplace through following programmed cleaning schedule. 2. Maintain the arrangement of tools used in manufacturing operations. 3. Give workers standard operating procedures in order to reduce defects and increase productivity. 4. The necessity of employing an industrial engineer to follow up an application of lean system in order to improve quality and reduce wastes. 5. Improve the factory lighting system.
  • 25.
    6. Better productionplanning in order to reduce the excessive amount of inventory. 7. Using CNC method to cut the metallic boards in order to reduce waste. 8. making new products using the waste of material such as producing second hand tables or cabinet. 9. Improve their marketing skills to build bridges to reach customers’ needs and fulfill it. 10. Also there is no website showing their products and that is considered something important due to online purchasing.