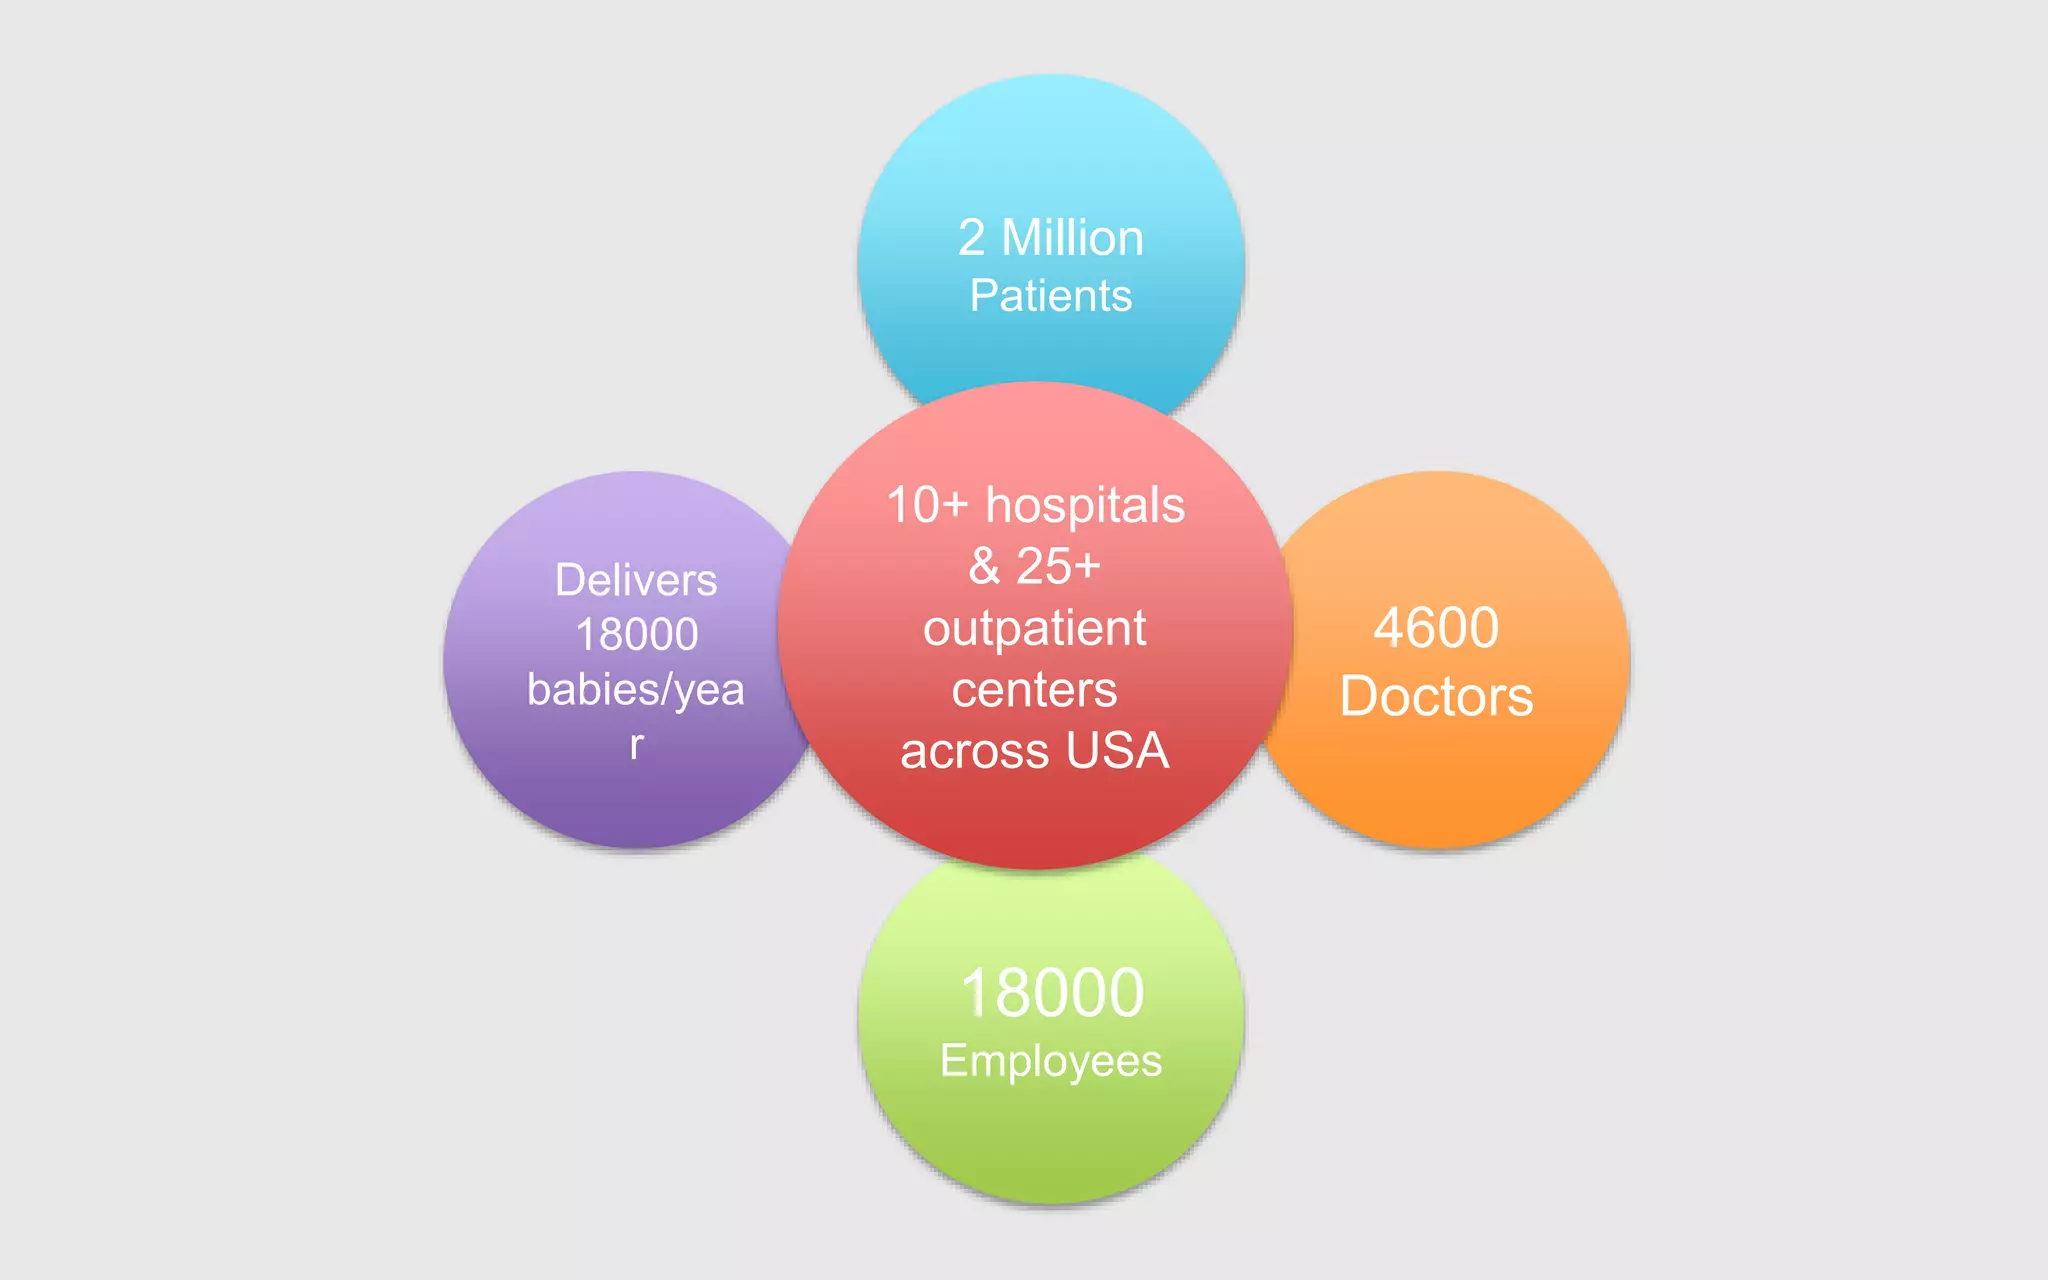
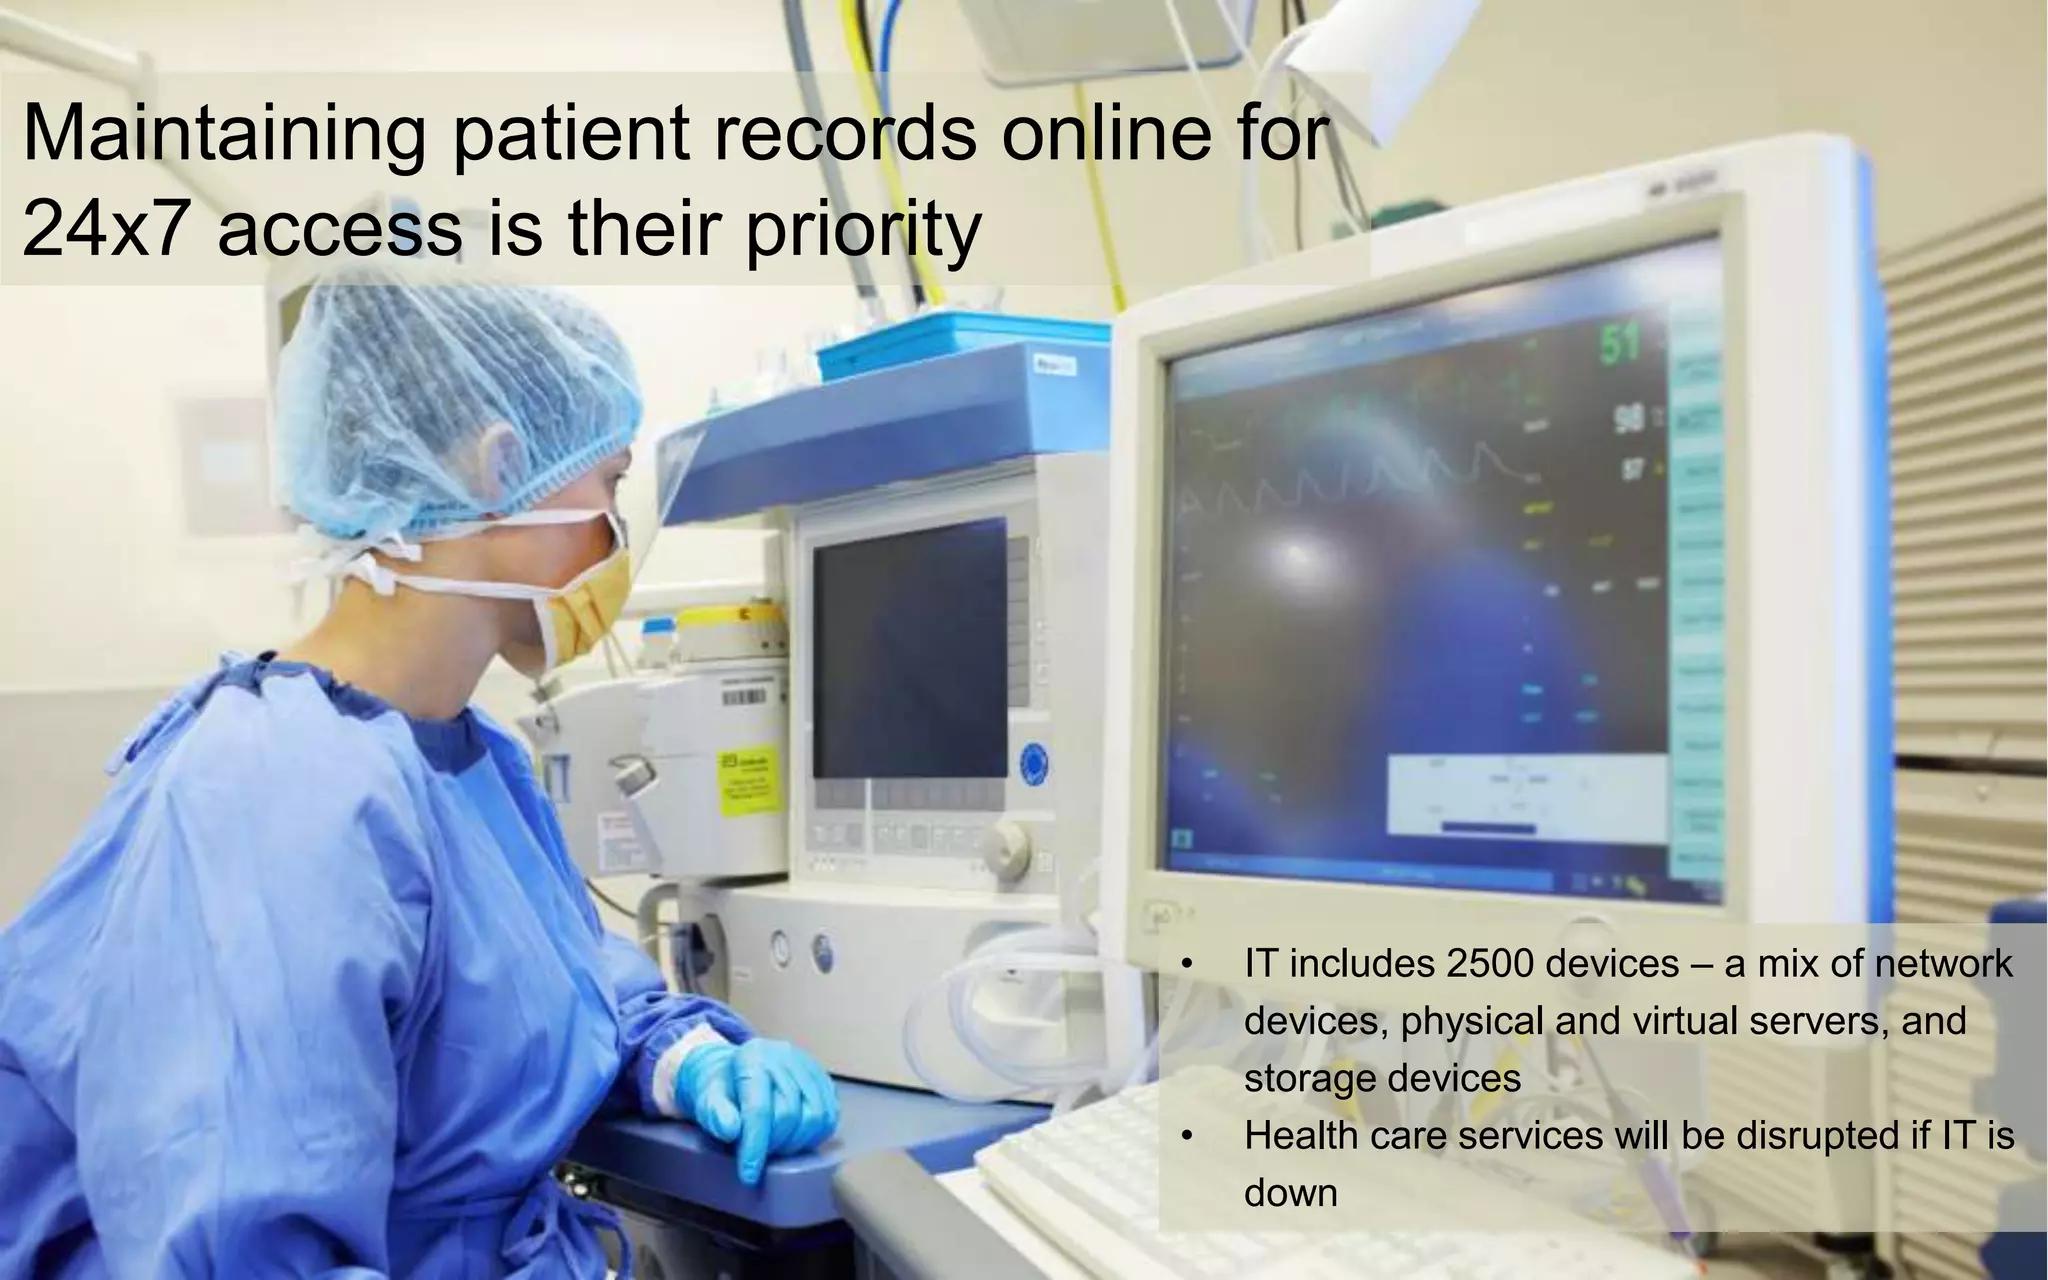
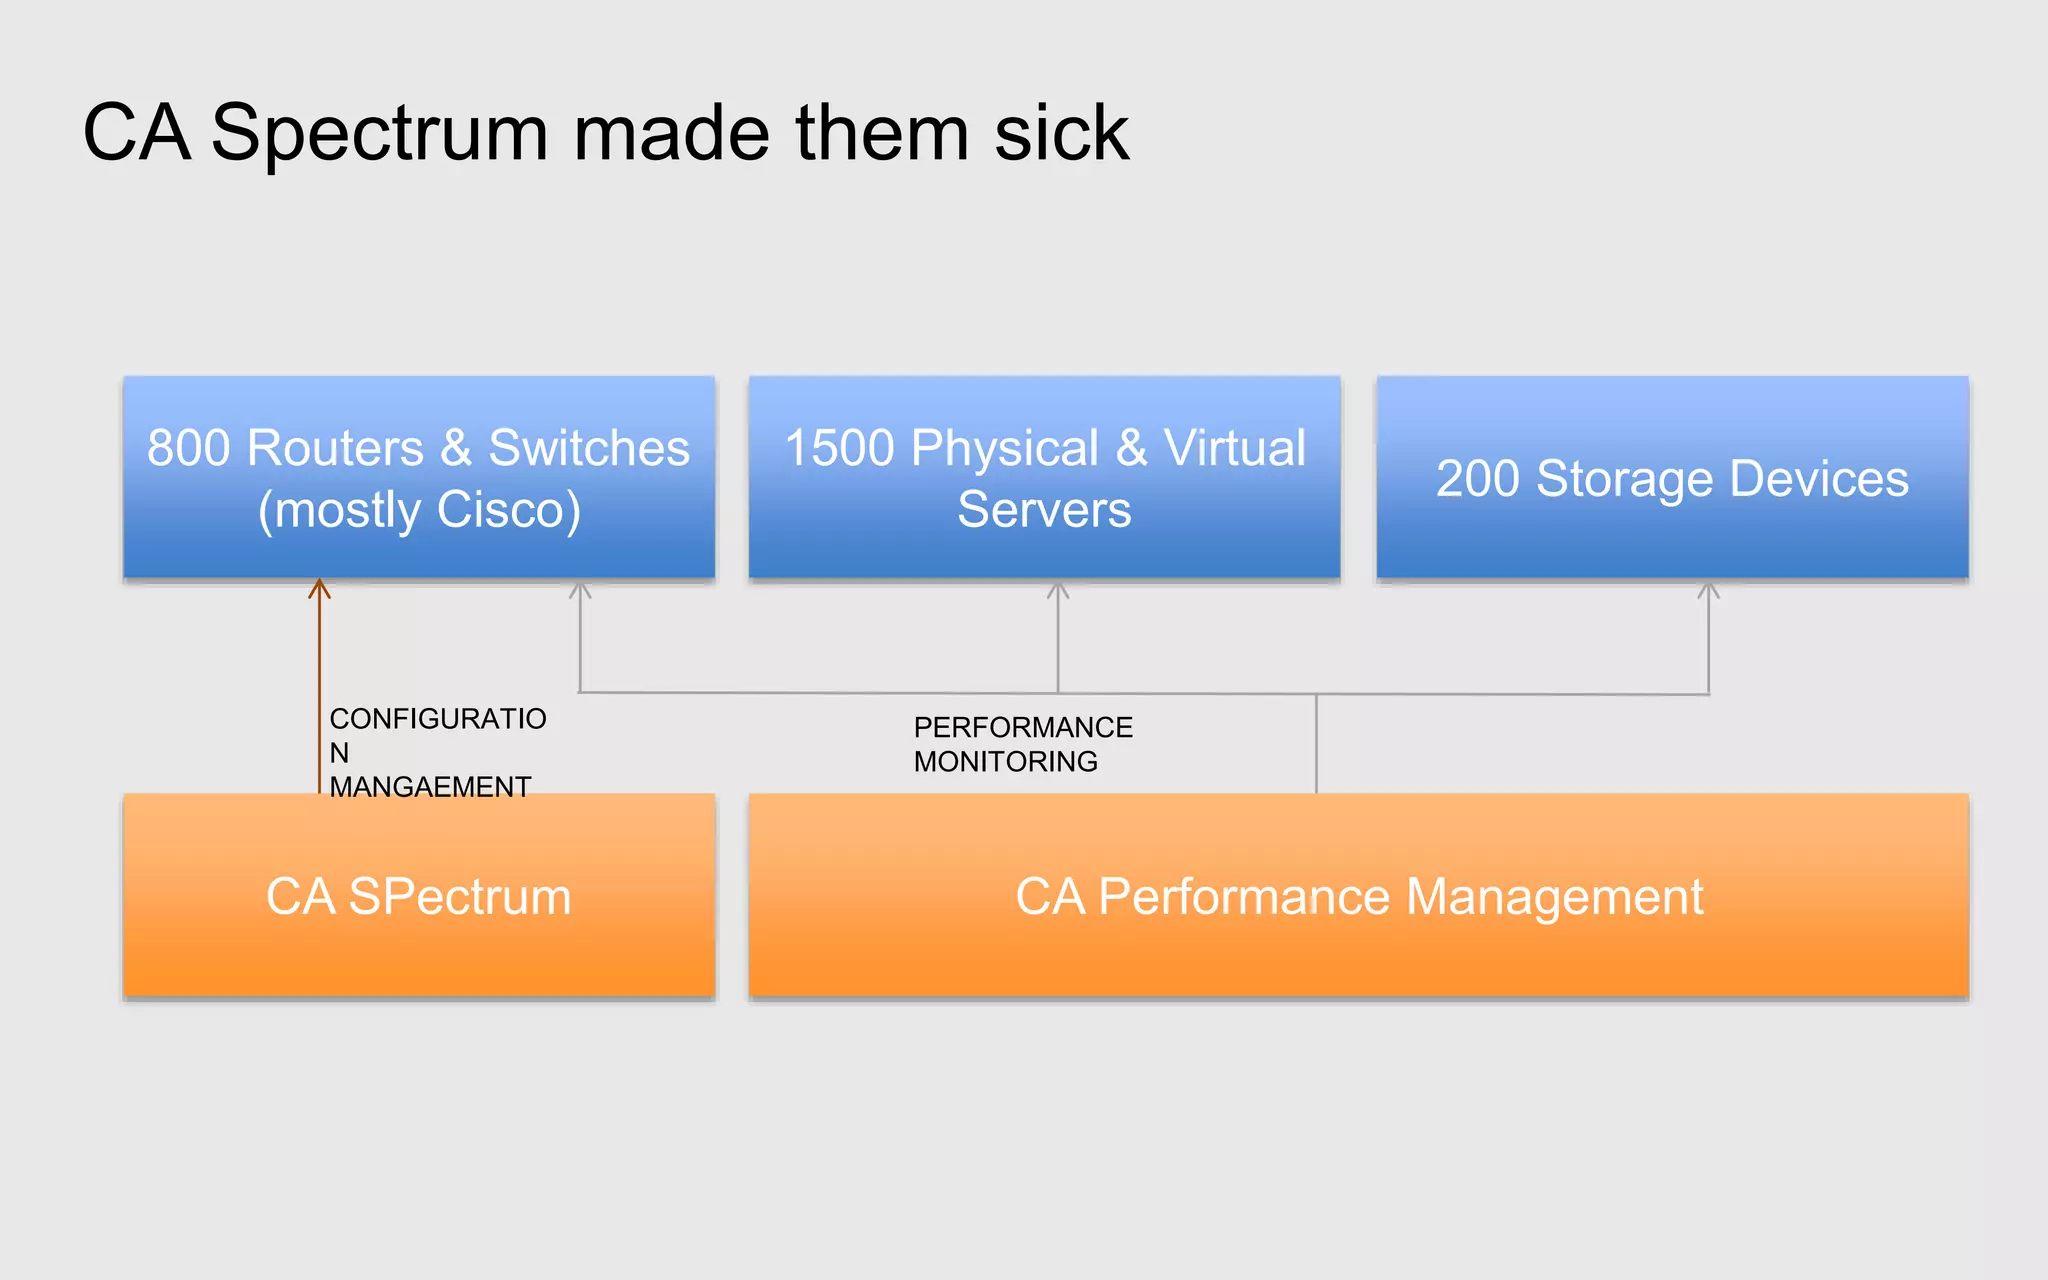
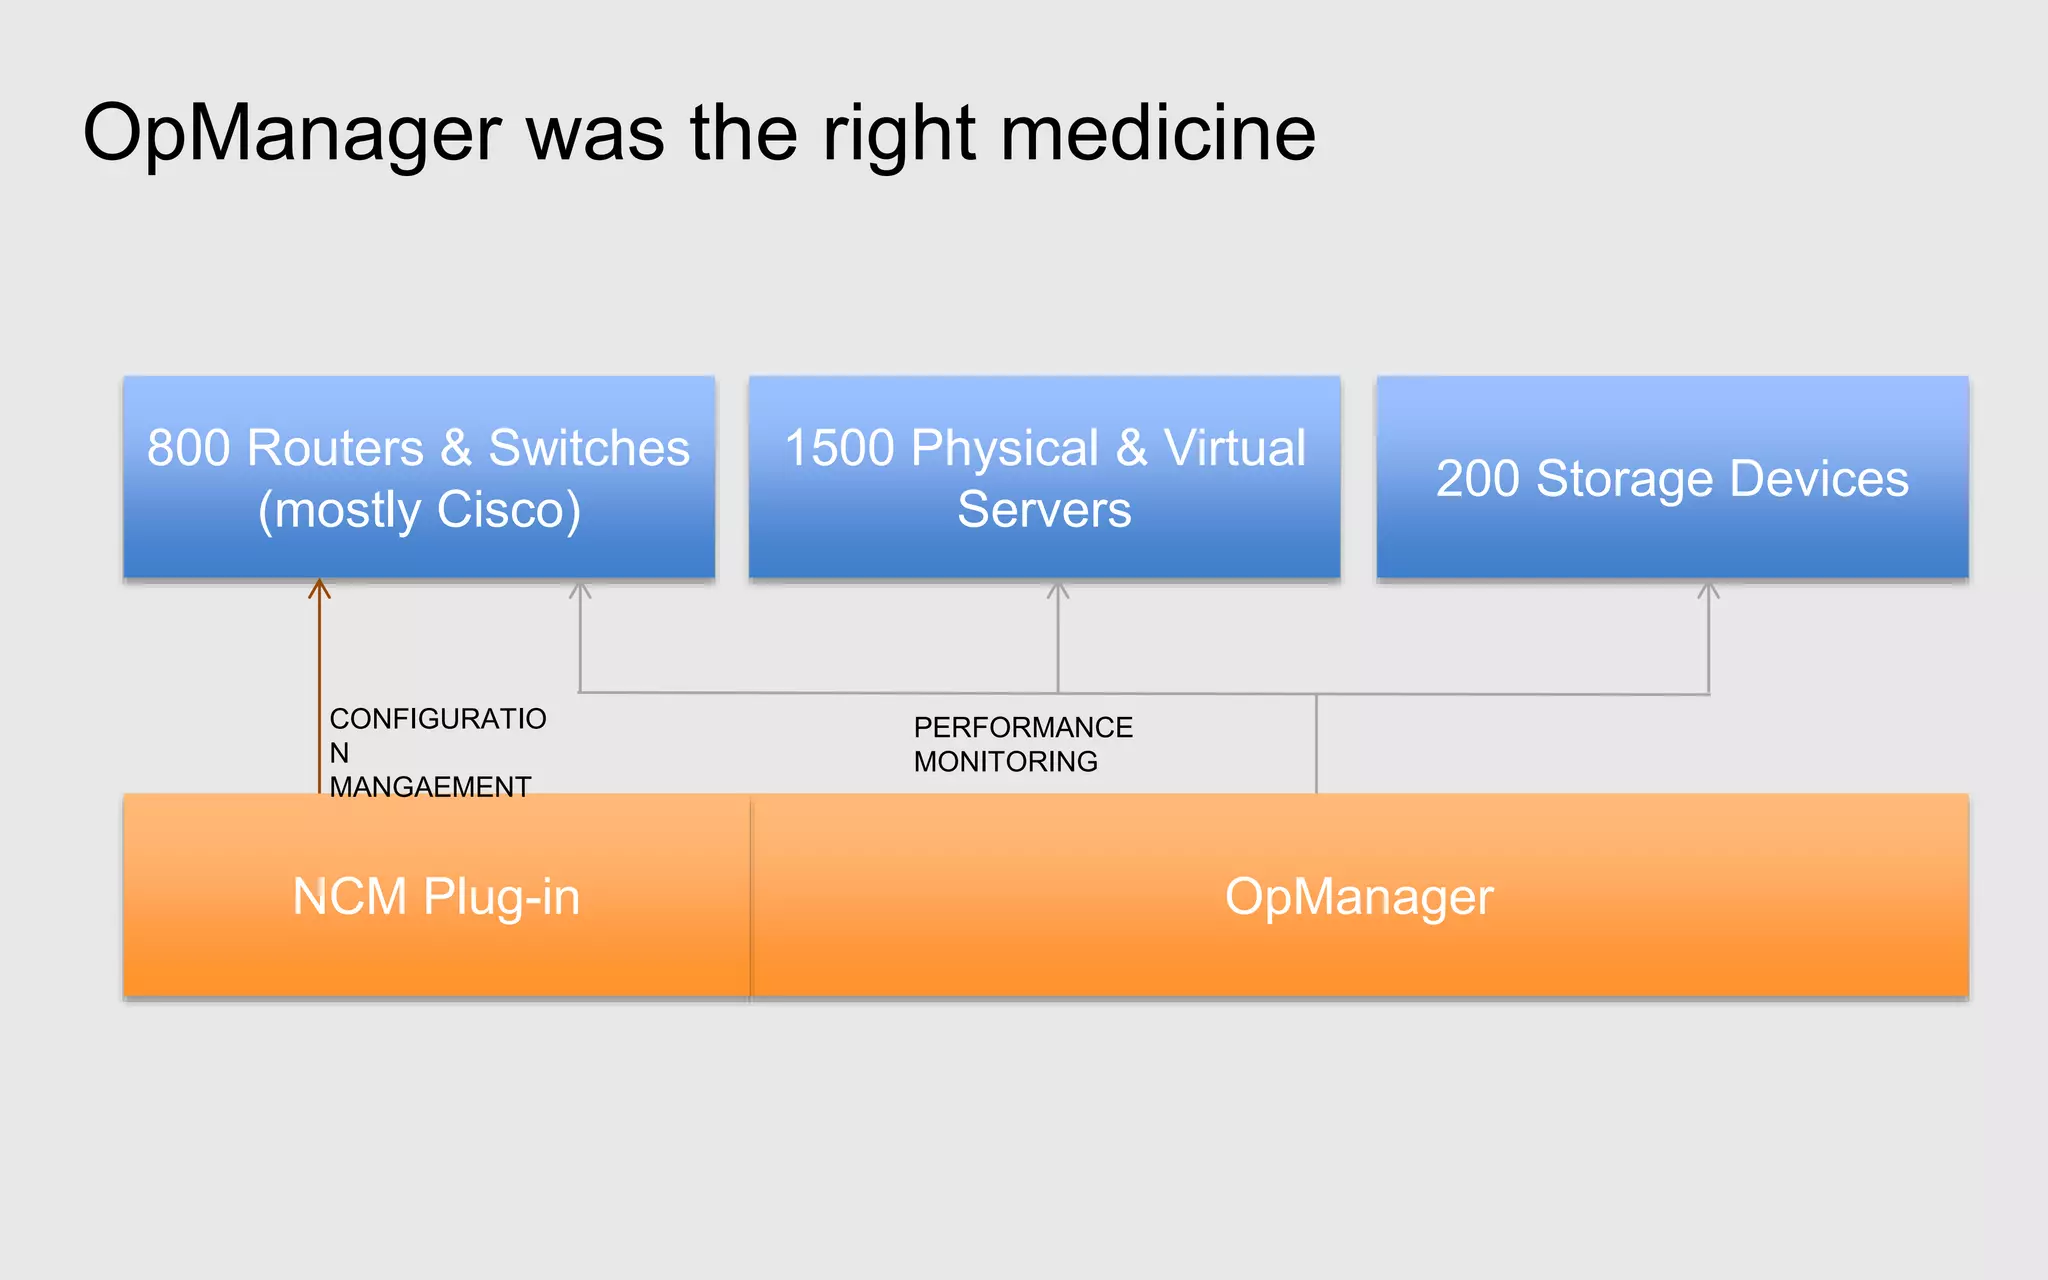
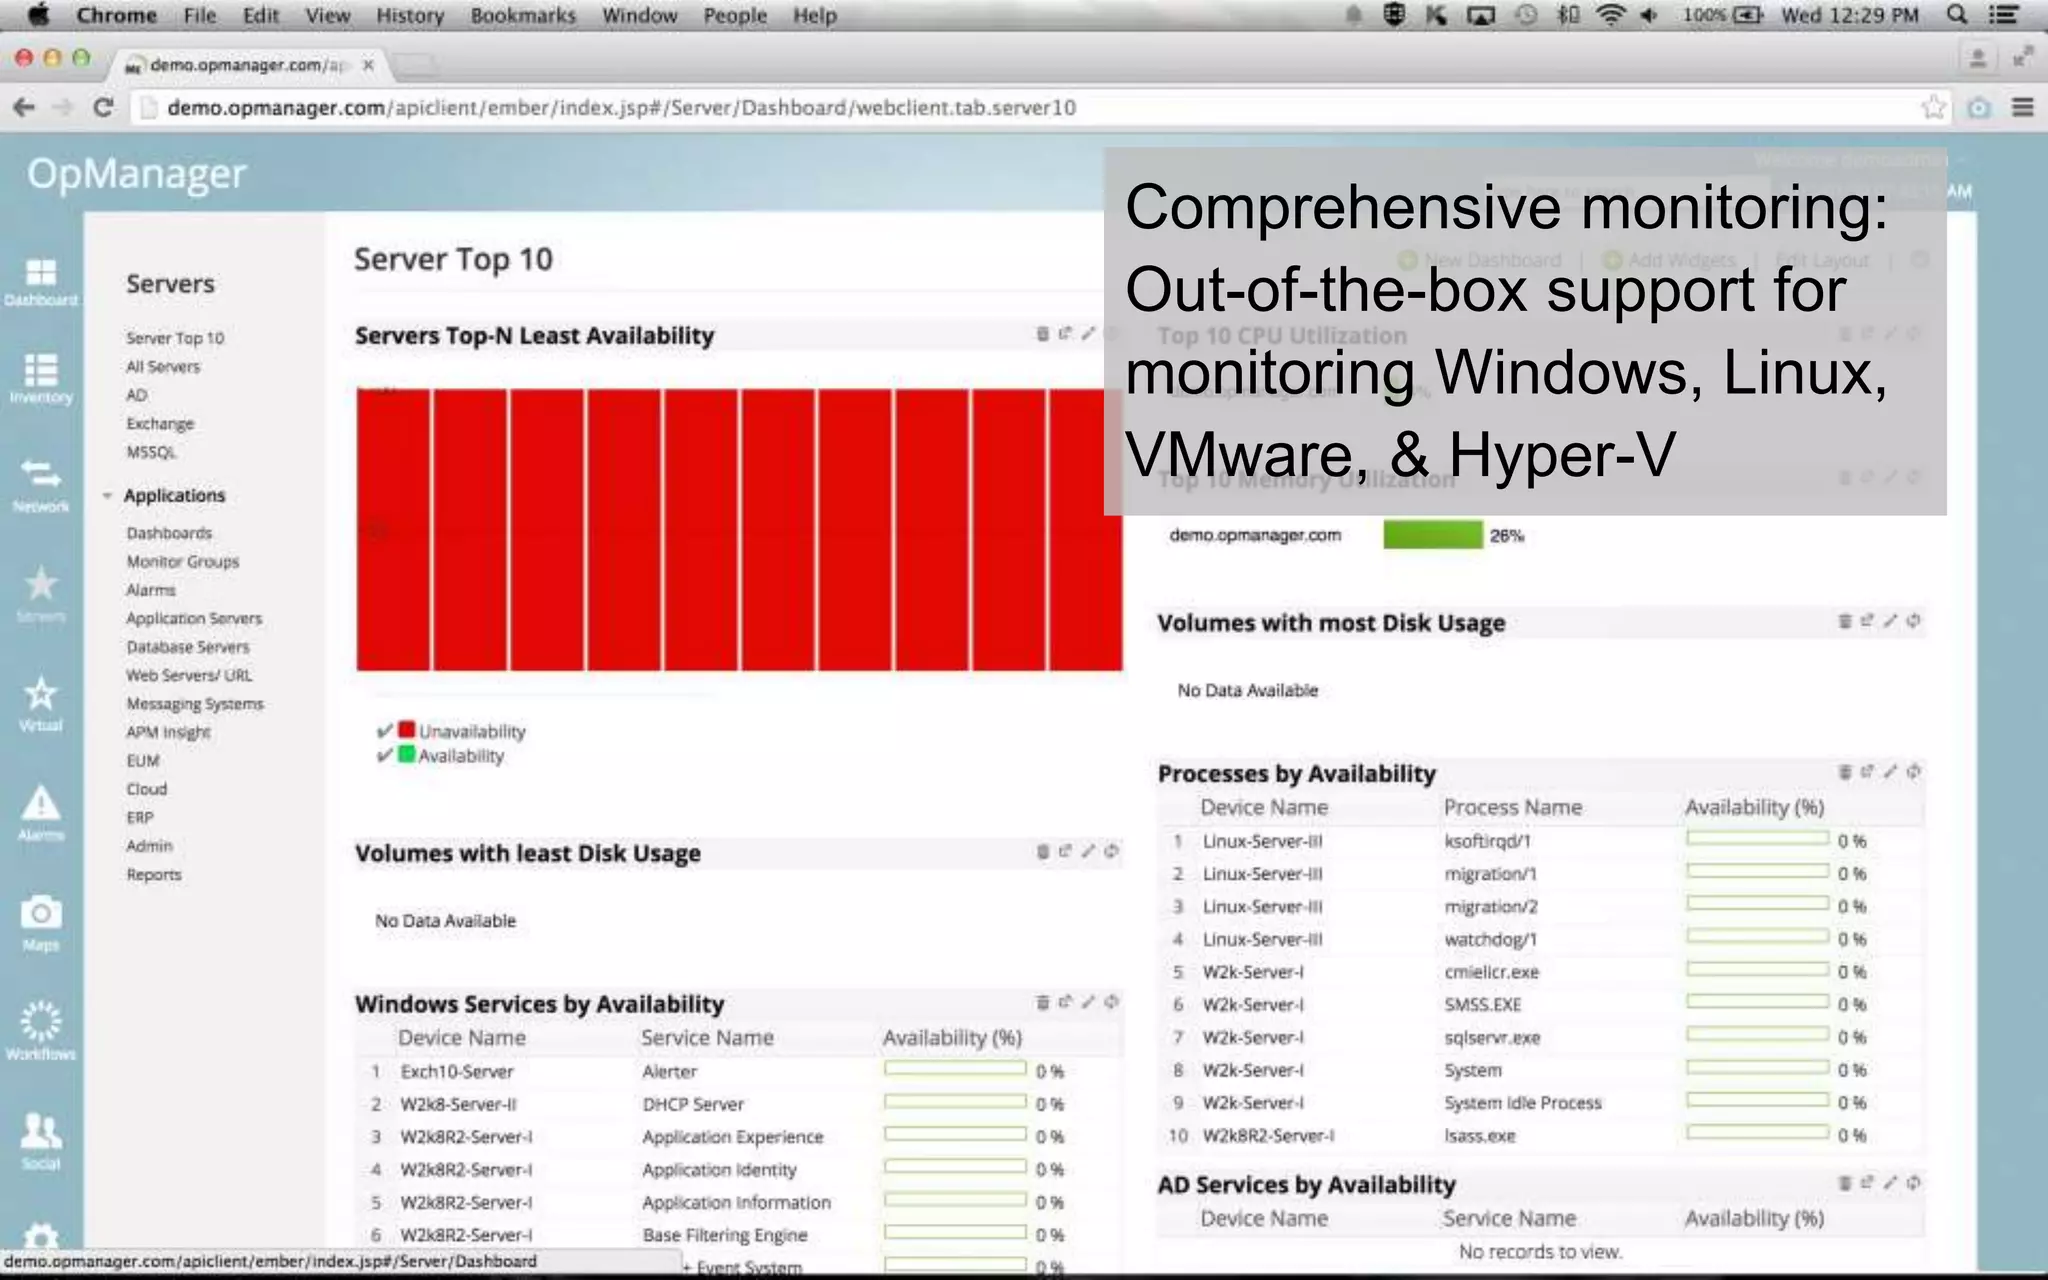
This document discusses a telecommunications company's need for a unified network monitoring tool to monitor network uptime and bandwidth usage across its IT infrastructure to minimize revenue loss from downtime. It describes how ManageEngine OpManager fulfilled their requirements by providing comprehensive network monitoring of all devices and services, real-time availability statistics, flow-based network traffic analysis, automatic network mapping to visualize their infrastructure and quickly locate issues, powerful fault management to identify and resolve network faults, and instant alerts for any network problems.
The customer is a privately held paint and retail company with 1,001-5,000 employees located in the United States. They needed to monitor and manage their network devices, servers, network bandwidth usage, and mission critical applications. ManageEngine OpManager provided end-to-end network monitoring across their critical IT resources like routers, switches, firewalls, and servers. It also offered network maps and plugins to monitor network traffic, configure devices, and ensure compliance. OpManager helped fulfill all of the customer's monitoring requirements.
Gulf Chemicals & Metallurgy Corporation manages 1700 interfaces across its branch offices with ManageEngine OpManager. It needed a solution to proactively monitor availability and performance across devices and branches, receive instant notifications of failures, and reduce the manual effort of multiple monitoring tools. OpManager provided centralized monitoring of routers, switches, VMs, and applications. It set thresholds to identify issues early, sent notifications via multiple channels, and automated workflows for troubleshooting through code-free configurations.
Firewall and intrusion detection systems (IDS) provide basic security but miss advanced attacks like distributed denial of service (DDOS) and zero-day intrusions. The document argues that large enterprises need extra security through network and log analysis to identify advanced threats like internal vulnerabilities being exploited, privilege misuse, and suspicious traffic patterns. It promotes the use of automated security tools that can continuously monitor system and application logs, network flows, and packet data to detect anomalies, generate real-time alerts, and produce security reports.
OpStor version 9.1 comes with device support for PureStorage and EMC Isilon. With the new SMI-S framework, storage admins can monitor any SMI-S based device with OpStor now. It also comes with a snappy new UI and forecast dashboard to give storage admins the only product to monitor all the storage hardware connected in their environment. This includes monitoring tape libraries, host / backup servers, RAIDs, HBAs, FC and SAN Switches.
This document summarizes how OpManager helps a large Indian IT services firm monitor their IT infrastructure. Some key points:
- The firm has 18,000+ employees and generates $650 million in annual revenue. Downtime of just 1 hour could result in significant losses.
- OpManager provides centralized monitoring of over 3,000 devices across their wide, geographically distributed network from its data centers in Mumbai, Pune and Chennai.
- Features like customizable dashboards, reports, network maps, and automated workflows help the firm maintain visibility into performance and configure alerts. This enables them to address issues proactively and ensure infrastructure reliability.
A leading insurance company in Michigan, USA replaces Solarwinds Orion with ManageEngine OpManager LEE for monitoring 3000 devices, which include routers, switches, firewalls, VMs, UCS, and PDUs.
This document discusses how the ManageEngine OpManager product can help simplify data center management. It provides an overview of OpManager's key capabilities for monitoring network devices, servers, applications and managing faults. These capabilities include monitoring infrastructure performance, configuring devices, visualizing topologies, automating workflows and generating reports to gain visibility into the IT environment. OpManager can monitor up to 1 million interfaces from a single server and provides dashboard views, alerts, capacity planning and tools to troubleshoot issues faster.
The customer is a large gaming, hospitality and tourism company with 70,000 employees and $9 billion in annual revenue. They rely on IT systems for computerized reservations, accounting, energy management, automated check-outs and a high-speed internet network. ManageEngine OpManager helped fulfill their IT monitoring needs by allowing them to monitor all network devices, servers, and infrastructure across their entire organization. It provides bandwidth monitoring, application performance monitoring, and automated workflow to reduce manual effort and troubleshooting time.
NCAA Basketball 2015 Championship selections has already gathered the crowd. With almost every employee in an organization streaming live videos—IT and security admins are bracing for the heavy toll on their companies' networks. It is vital for all IT managers to handle severe traffic spikes on their networks by using these tips and act proactively to prevent network outages.
The document discusses the requirements of a university customer with over 58,000 employees and 21,000 students. The university needed to monitor its network across multiple operating systems, ensure high availability, prioritize bandwidth for educational applications, and monitor collaborative applications. ManageEngine OpManager fulfilled these requirements with a centralized monitoring console, visibility into physical and virtual servers, network traffic analysis, uptime monitoring, and configuration management.
Gain in-depth visibility into your network and application layers and identify the impact that your applications are causing on your network and vice versa with ManageEngine OpManager.
An American entertainment company implemented OpManager to monitor their 350 devices including 100 network devices and 250 virtual machines. Previously they used multiple open source tools which caused complexity. OpManager provided an integrated solution for monitoring their networks, servers, and VMware infrastructure. It simplified their efforts by consolidating monitoring in a single tool with an easy interface, affordable pricing, and scalability for future growth.
A leading bank with over 780 branches across the United States had problems with monitoring network traffic across the Enterprise and in finding out the most resource-intensive applications. This Slideshare explains how they solved the challenge with ManageEngine NetFlow Analyzer by monitoring real-time network traffic based on flow data and found out application-wise bandwidth usage.
Firewall Analyzer provides network administrators with visibility and insights into network security by analyzing firewall logs. It helps secure the network through security audits, compliance management, forensic analysis of security incidents, firewall policy optimization, and insider threat detection. Without a firewall log analyzer, network administrators are unaware of security issues, policy violations, and other threats.
Ease out the GDPR adoption with ManageEngineManageEngine
Is your enterprise located in the EU or does it collect and process personal data of the EU citizens? Then it's high time for you to adopt the new GDPR regulation before 25 May, 2018. Check out what's GDPR and how ManageEngine can help you comply with this new mandate.
A leading legal services consulting firm with offices worldwide uses Applications Manager to ensure optimal performance of their business-critical applications and services.
Embrace IT Operations Management with OpManager to get the visibility into your network, server & storage, application, and service layers. Find the exact fault in minutes and troubleshoot quickly.
OpManager is integrated network management software that offers network monitoring, server monitoring, bandwidth analysis, configuration management, firewall log analysis, and IP & switch port management.
Version 12 of Firewall Analyzer includes integration with ManageEngine OpManager to provide monitoring capabilities. It also features a new, easy to use web client interface. These updates aim to improve the user experience.
Firewall Analyzer allows monitoring of virtual firewalls by resolving DNS names, enabling logging by context or vdom, and selecting syslog format. It generates context or vdom specific firewall reports on compliance, changes, and unused rules by using credentials for the base firewall. For support, contact the listed website, email, or demo site.
The document discusses the top 5 IT challenges organizations are likely to face in 2017 according to an IT management company survey. The challenges are handling security threats, adding new devices and monitoring them, dealing with budget cuts, dealing with sudden unauthorized changes and ensuring compliance, and finding correlations between issues to determine the root cause. The document then proceeds to discuss solutions provided by the company's network monitoring product, OpManager Plus, to address each of these challenges. It highlights features such as firewall management, scalability, tracking of changes, and root cause analysis to help admins strengthen security, adapt to growth, work within budgets, and resolve issues more efficiently.
This document describes new features in NetFlow Analyzer v12.2, an integrated network traffic management and configuration management software. The new version includes enhancements to the user interface, integration with wireless LAN controllers, and tighter integration with network management solutions. It also includes new features like one-click flow export, network configuration management, and auto-refresh for traffic graphs.
Here are few of the top problems a network analysis tool will help you to solve. Are you worried about any of these network related issues? Know how ManageEngine NetFlow Analyzer get to the root cause and lets you solve before it affects end user.
This document discusses several network monitoring and troubleshooting tools including analyzing network traffic by application and layer 7 using AVC, monitoring interface performance and traffic levels, detecting media and application performance issues using Cisco Mediatrace and WAAS, and monitoring VoIP call and WAN link quality with Cisco IP SLA.
This document discusses how Network Configuration Manager can help organizations prepare for and respond to network disasters. It notes that disasters are expensive, unexpected events that can disrupt business critical systems. NCM provides backups of network device configurations, allows restoration of baseline configurations, implements change management controls, enables root cause analysis of issues, ensures compliance with standards, and facilitates firmware updates. By using NCM, organizations can minimize downtime from disasters and quickly recover business operations through automated restoration and management of network devices.
Know what makes the performance monitoring different from a physical servers Vs. virtual servers and what are the essential must have monitors for VMware performance monitoring.
Radiology Workflow: Recognizing Clinical & Financial Benefits of Implementing...TriMed Media Group
This document summarizes a presentation about implementing an integrated radiology information system (RIS), picture archiving and communication system (PACS), and reporting solution at Rutland Regional Medical Center. The system provides streamlined workflow from patient check-in through report delivery. It has led to improved efficiency through a unified system, faster report turnaround times, reduced transcription needs, better monitoring of metrics, and enhanced collaboration between radiologists and other physicians. The integrated system also allows for improved coding and billing processes as well as cost savings through staffing reductions.
Radiology workflow recognizing clinical financial benefits of implementing a ...Trimed Media Group
The document discusses the benefits of implementing a full RIS-PACS-reporting solution at Rutland Regional Medical Center. It allows for a tightly connected workflow from patient arrival to report delivery. Physicians have efficient access to images and information. The single vendor system provides radiologists with a quick turnaround and unified vision. Key metrics like report turnaround time and coding callbacks have improved. The solution enhances patient care by making the physician workflow more efficient.
Hannah Armand - eHospital Head of Information Systems (outpatients), Cambridg...HIMSS UK
The document discusses Cambridge University Hospitals' (CUH) implementation of an electronic patient record (EPR) system called eHospital. It summarizes that CUH signed a 10-year contract in 2013 with Epic and Hewlett-Packard to implement the Epic EPR system trust-wide. The go-live of the new system occurred in October 2014. The implementation involved upgrading hardware, refreshing the IT infrastructure, extensive staff training, and configuring the EPR system to support all of CUH's clinical specialties and workflows. The summary discusses some of the challenges experienced during go-live and benefits that have been realized since implementation, such as improved patient safety, efficiencies, and staff satisfaction with the new system
iWard 3.0 - Advantech iHealthcare Patient Engagement SolutionMark Anthony Leorna
Advantech Intelligent Ward Solution enables patients to communicate their needs quickly, improves treatment efficiency, and increases patient and overall staff satisfaction.
If you would like to know more drop me a message on LinkedIn: https://www.linkedin.com/in/markleorna/
AI in Healthcare | Future of Smart Hospitals Renee Yao
In this talk, I specifically talk about how NVIDIA healthcare AI software and hardware were used to support healthcare AI startups' innovation. Three startups featured: Caption Health, Artisight, and Hyperfine. Audience: healthcare systems CXOs.
The document discusses an integrated data management system (IDMS) software from ITC that allows point-of-care coordinators to manage patient test results and reporting from a single location. The IDMS improves efficiency by connecting portable testing devices, tracking quality control, and generating reports for regulatory compliance. It also provides versatile filtering and reporting capabilities to oversee the point-of-care testing program.
This is a simple presentation about Hospital Information System. The following are the contents.
1) What is Hospital Information System?
2) Problems associated with traditional paper based systems.
3) Purpose of Hospital Management System
4) Functions
5) How it works?
6) System Requirements
7) Advantages
This is my first upload, hope you like it.
Community pharmacy anticoagulation monitoring service, the Canterbury approach. Presented by Vanessa Buchan, Canterbury Health Laboratories, at HINZ 2014, 11 November 2014, 12pm, Marlborough Room
A large private club with over 5000 employees and 100 IT team members needed a network monitoring tool to monitor over 15,000 interfaces across their growing network from a single console to minimize costly downtime of $150,000 per hour. They deployed ManageEngine OpManager Enterprise Edition with probes in two datacenters to centrally monitor over 1,500 devices across hundreds of remote offices, scaling to monitor over 50,000 interfaces with high availability.
This is a simple presentation about Hospital Information System. The following are the contents.
1) What is a Hospital Information System?
2) Problems associated with paper-based systems
3) Purpose of the Hospital Information System
4) Functions
5) How it works?
6) System Requirements
7) Advantages
This is my first uploaded presentation. Hope you guys like it.
Benefits of Electronic Medical Record Systems.pptxCliniceaPlatform
The healthcare sector is quickly adopting digitalization technology to enhance patient care, simplify processes, and improve overall operational effectiveness. Electronic Medical Record systems have become a critical part of the current digital revolution. During this presentation, we will delve into the substantial advantages of integrating EMR systems into healthcare institutions. Electronic Medical Record systems can completely transform the delivery of healthcare, from enhancing patient care to boosting productivity. Let us explore the benefits of embracing this breakthrough technology.
Nancy Apkarian has over 15 years of experience in healthcare IT, working with electronic health records (EHR) systems like Epic. She has extensive experience designing, implementing, and supporting medical device integrations with EHRs at Wheaton Franciscan Healthcare. Previously at Aurora Health Care, she implemented operational readiness methods, reduced ticket routing errors, and increased resolved tickets by 90%. She holds an MBA and multiple IT certifications.
Cost-effective, high-performance APV Series load balancing solutions accelerate EMR and PM applications while improving high-availability and security.
Digital Tools and Solutions for Healthcare and Pharma from Healtho5Digital MedCom
How can pharma use Digtal Tools for Physican Outreach in India. We at Healtho5 Solutions come up with specific solutions for pharma's digital needs. Mail us at drneelesh@digmed.in or neelesh@healtho5.com
Healtho5 Solutions provides HIPAA, JCI and NABH compliant digital tools and platforms to help physicians in India boost their effectiveness. Their secure and flexible web-based technology includes prescription management, drug information modules, appointment booking, patient management systems, and teleconsultation services. They maintain a single patient record across the healthcare continuum and offer extensive analytics and custom reporting with built-in rule engines.
25267-Market-Segment-Brochure-Health-Solutions-WEBJodie Louise
Clipsal Health Solutions provides integrated, reliable electrical solutions to improve efficiency in healthcare facilities. Their solutions can help reduce installation, energy, and maintenance costs while improving patient comfort and safety and increasing staff productivity. They offer expertise across six key areas: financial performance, patient safety, productivity, patient environment, occupational health and safety/security, and capital expenditure.
The document discusses using intelligent data and connectivity in healthcare. It outlines several use cases for real-time data integration like clinical decision support, remote patient monitoring, and medical device interoperability. The needs of intelligent healthcare systems include reliable and secure communication between devices, location abstraction, and scalability. The RTI Connext DataBus is presented as a solution to distribute data across these complex healthcare systems in real-time. A deep dive on DocBox, a clinical decision support system, shows how it can improve patient safety by integrating data from various sources and devices like PCA pumps. The Internet of Things is transforming healthcare by enabling smart devices and analytics to share data to deliver better care.
Scenario:
Midwest Regional Health is one of Wisconsin's largest and most sophisticated hospitals, is Implementing a new EHR system that will better their services to their internal and external customers. They are asking ITMC (I-Tech Medical Consortium) to help them navigate through this long term project, thereby improving their commitment to their surrounding community.
RTLS 2.0: Moving from Asset Tracking to Asset ManagementCenTrak
Healthcare facilities have come to realize the importance of equipment management and its organization-wide impact and interdependence with staff productivity, operations, asset performance and lifecycle costs. With the average rate for asset/equipment utilization at approximately 35%, asset tracking has become a viable area of improvement that can be achieved with measurable results.
Selecting an accuracy-based asset tracking solution that delivers 100% certainty enables a hospital to transition from asset tracking to more complex asset management and supply chain management use cases.
- Enterprise visibility to asset location and status
- Reduces time searching for equipment
- Increases staff satisfaction
- Automates PAR level management
- Reduces shrinkage
- Improves clinical workflow
- Integrates with CMMS
Similar to Leading Healthcare in New Jersey trusts OpManager LEE (20)
Learn how analyzing key website metrics that are related to user interactions will help you make insightful improvements. Understand how replaying individual customer transactions and analyzing every element of your webpage will help drill down to the root causes issues and create better content strategies respectively.
Learn how to how to monitor and gain code-level insights into the performance of your Java, Node.js, PHP, and .NET Core applications in real-time with the help of ManageEngine Applications Manager.
Get a complete overview of NetFlow Analyzer. Learn about the basic initial settings, configuration, customization, alerts, reports, and the various other features of the product.
Learn how to monitor the operational status of servers and virtual machines across an organization's IT infrastructure, track the status of critical metrics, tackle hardware problems, and optimize resource allocation effectively with ManageEngine Applications Manager.
This document discusses monitoring various cloud infrastructure and applications using an end-to-end application performance monitoring solution. It covers monitoring metrics in AWS, GCP, Oracle Cloud Infrastructure, Hyperconverged infrastructure like Nutanix and Cisco UCS, Oracle Autonomous Database, and using trend analysis reports for forecasting and resource planning. Upcoming monitoring enhancements for additional cloud services on AWS, Azure, and GCP are also outlined through 2020.
Learn the various advanced monitoring, customization, troubleshooting and security features in Netflow Analyzer.
Agenda:
-Troubleshooting with forensics and ASAM
-Reporting and automation
-Traffic shaping
-Distributed Monitoring
Learn how to track key operational metrics of your Node.js and PHP infrastructure in real-time and get insight into the nuances of autonomous databases.
The document discusses the results of a study on the impact of COVID-19 lockdowns on air pollution. Researchers analyzed satellite data from NASA and the European Space Agency and found that nitrogen dioxide levels decreased significantly during lockdown periods in major cities across the world as traffic and industrial activities reduced. Overall, the temporary improvements in air quality during widespread lockdowns highlight the human-caused nature of poor air pollution but also show how collective changes in behavior can positively impact the environment.
NetFlow Analyzer captures flow data and monitors interface bandwidth usage in real-time. This product overview will help you get the most out of NetFlow Analyzer.
This document discusses monitoring cloud and hyperconverged infrastructure. It covers monitoring Amazon Web Services (AWS) by visualizing metrics for compute, storage, databases and other services. It also discusses monitoring Oracle Cloud Infrastructure and Google Cloud Platform, including compute metrics. Monitoring Nutanix hyperconverged infrastructure is covered, such as storage, virtual machines and alerts. The document concludes with the importance of capacity planning for cloud resources.
This document discusses website monitoring strategies including tracking key metrics of web servers like Apache, IIS and Nginx; optimizing individual URLs for user experience; using synthetic monitoring to simulate web transactions; and detecting unauthorized content changes. It provides overviews of monitoring various web servers and their key performance indicators. It also describes optimizing the user experience by monitoring URL sequences, implementing real browser monitoring, and using web transaction recording. Finally, it discusses monitoring website content to detect hacks and defacement.
This document summarizes a presentation about unlocking the value of big data infrastructure. It discusses key components of Apache Hadoop and Spark including HDFS, MapReduce, YARN, and Spark cores/RDDs. It also discusses leveraging graph databases for business, NoSQL databases in big data frameworks like MongoDB, Cassandra, and Redis. Finally, it discusses discovering and mapping issues, and forecasting utilization trends to plan capacity.
This document discusses implementing the right website monitoring strategy. It covers monitoring web servers like Apache, IIS, and Nginx to ensure performance and availability. It also discusses optimizing individual URLs, monitoring dynamic webpages through synthetic transactions, and detecting unauthorized changes to websites through content monitoring. The overall strategy aims to provide visibility, optimize user experience, and prevent hacks.
This document summarizes a training session on fault management and IT automation using OpManager. It includes an agenda covering alarm severity levels, threshold violation alarms, alarms from event logs, SNMP traps, syslog alarms, and notifications. It also discusses using IT workflows to automate problem remediation.
Northern Engraving | Nameplate Manufacturing Process - 2024Northern Engraving
Manufacturing custom quality metal nameplates and badges involves several standard operations. Processes include sheet prep, lithography, screening, coating, punch press and inspection. All decoration is completed in the flat sheet with adhesive and tooling operations following. The possibilities for creating unique durable nameplates are endless. How will you create your brand identity? We can help!
inQuba Webinar Mastering Customer Journey Management with Dr Graham HillLizaNolte
HERE IS YOUR WEBINAR CONTENT! 'Mastering Customer Journey Management with Dr. Graham Hill'. We hope you find the webinar recording both insightful and enjoyable.
In this webinar, we explored essential aspects of Customer Journey Management and personalization. Here’s a summary of the key insights and topics discussed:
Key Takeaways:
Understanding the Customer Journey: Dr. Hill emphasized the importance of mapping and understanding the complete customer journey to identify touchpoints and opportunities for improvement.
Personalization Strategies: We discussed how to leverage data and insights to create personalized experiences that resonate with customers.
Technology Integration: Insights were shared on how inQuba’s advanced technology can streamline customer interactions and drive operational efficiency.
zkStudyClub - LatticeFold: A Lattice-based Folding Scheme and its Application...Alex Pruden
Folding is a recent technique for building efficient recursive SNARKs. Several elegant folding protocols have been proposed, such as Nova, Supernova, Hypernova, Protostar, and others. However, all of them rely on an additively homomorphic commitment scheme based on discrete log, and are therefore not post-quantum secure. In this work we present LatticeFold, the first lattice-based folding protocol based on the Module SIS problem. This folding protocol naturally leads to an efficient recursive lattice-based SNARK and an efficient PCD scheme. LatticeFold supports folding low-degree relations, such as R1CS, as well as high-degree relations, such as CCS. The key challenge is to construct a secure folding protocol that works with the Ajtai commitment scheme. The difficulty, is ensuring that extracted witnesses are low norm through many rounds of folding. We present a novel technique using the sumcheck protocol to ensure that extracted witnesses are always low norm no matter how many rounds of folding are used. Our evaluation of the final proof system suggests that it is as performant as Hypernova, while providing post-quantum security.
Paper Link: https://eprint.iacr.org/2024/257
Session 1 - Intro to Robotic Process Automation.pdfUiPathCommunity
👉 Check out our full 'Africa Series - Automation Student Developers (EN)' page to register for the full program:
https://bit.ly/Automation_Student_Kickstart
In this session, we shall introduce you to the world of automation, the UiPath Platform, and guide you on how to install and setup UiPath Studio on your Windows PC.
📕 Detailed agenda:
What is RPA? Benefits of RPA?
RPA Applications
The UiPath End-to-End Automation Platform
UiPath Studio CE Installation and Setup
💻 Extra training through UiPath Academy:
Introduction to Automation
UiPath Business Automation Platform
Explore automation development with UiPath Studio
👉 Register here for our upcoming Session 2 on June 20: Introduction to UiPath Studio Fundamentals: https://community.uipath.com/events/details/uipath-lagos-presents-session-2-introduction-to-uipath-studio-fundamentals/
"Scaling RAG Applications to serve millions of users", Kevin GoedeckeFwdays
How we managed to grow and scale a RAG application from zero to thousands of users in 7 months. Lessons from technical challenges around managing high load for LLMs, RAGs and Vector databases.
LF Energy Webinar: Carbon Data Specifications: Mechanisms to Improve Data Acc...DanBrown980551
This LF Energy webinar took place June 20, 2024. It featured:
-Alex Thornton, LF Energy
-Hallie Cramer, Google
-Daniel Roesler, UtilityAPI
-Henry Richardson, WattTime
In response to the urgency and scale required to effectively address climate change, open source solutions offer significant potential for driving innovation and progress. Currently, there is a growing demand for standardization and interoperability in energy data and modeling. Open source standards and specifications within the energy sector can also alleviate challenges associated with data fragmentation, transparency, and accessibility. At the same time, it is crucial to consider privacy and security concerns throughout the development of open source platforms.
This webinar will delve into the motivations behind establishing LF Energy’s Carbon Data Specification Consortium. It will provide an overview of the draft specifications and the ongoing progress made by the respective working groups.
Three primary specifications will be discussed:
-Discovery and client registration, emphasizing transparent processes and secure and private access
-Customer data, centering around customer tariffs, bills, energy usage, and full consumption disclosure
-Power systems data, focusing on grid data, inclusive of transmission and distribution networks, generation, intergrid power flows, and market settlement data
"Choosing proper type of scaling", Olena SyrotaFwdays
Imagine an IoT processing system that is already quite mature and production-ready and for which client coverage is growing and scaling and performance aspects are life and death questions. The system has Redis, MongoDB, and stream processing based on ksqldb. In this talk, firstly, we will analyze scaling approaches and then select the proper ones for our system.
Dandelion Hashtable: beyond billion requests per second on a commodity serverAntonios Katsarakis
This slide deck presents DLHT, a concurrent in-memory hashtable. Despite efforts to optimize hashtables, that go as far as sacrificing core functionality, state-of-the-art designs still incur multiple memory accesses per request and block request processing in three cases. First, most hashtables block while waiting for data to be retrieved from memory. Second, open-addressing designs, which represent the current state-of-the-art, either cannot free index slots on deletes or must block all requests to do so. Third, index resizes block every request until all objects are copied to the new index. Defying folklore wisdom, DLHT forgoes open-addressing and adopts a fully-featured and memory-aware closed-addressing design based on bounded cache-line-chaining. This design offers lock-free index operations and deletes that free slots instantly, (2) completes most requests with a single memory access, (3) utilizes software prefetching to hide memory latencies, and (4) employs a novel non-blocking and parallel resizing. In a commodity server and a memory-resident workload, DLHT surpasses 1.6B requests per second and provides 3.5x (12x) the throughput of the state-of-the-art closed-addressing (open-addressing) resizable hashtable on Gets (Deletes).
"What does it really mean for your system to be available, or how to define w...Fwdays
We will talk about system monitoring from a few different angles. We will start by covering the basics, then discuss SLOs, how to define them, and why understanding the business well is crucial for success in this exercise.
For the full video of this presentation, please visit: https://www.edge-ai-vision.com/2024/06/temporal-event-neural-networks-a-more-efficient-alternative-to-the-transformer-a-presentation-from-brainchip/
Chris Jones, Director of Product Management at BrainChip , presents the “Temporal Event Neural Networks: A More Efficient Alternative to the Transformer” tutorial at the May 2024 Embedded Vision Summit.
The expansion of AI services necessitates enhanced computational capabilities on edge devices. Temporal Event Neural Networks (TENNs), developed by BrainChip, represent a novel and highly efficient state-space network. TENNs demonstrate exceptional proficiency in handling multi-dimensional streaming data, facilitating advancements in object detection, action recognition, speech enhancement and language model/sequence generation. Through the utilization of polynomial-based continuous convolutions, TENNs streamline models, expedite training processes and significantly diminish memory requirements, achieving notable reductions of up to 50x in parameters and 5,000x in energy consumption compared to prevailing methodologies like transformers.
Integration with BrainChip’s Akida neuromorphic hardware IP further enhances TENNs’ capabilities, enabling the realization of highly capable, portable and passively cooled edge devices. This presentation delves into the technical innovations underlying TENNs, presents real-world benchmarks, and elucidates how this cutting-edge approach is positioned to revolutionize edge AI across diverse applications.
How information systems are built or acquired puts information, which is what they should be about, in a secondary place. Our language adapted accordingly, and we no longer talk about information systems but applications. Applications evolved in a way to break data into diverse fragments, tightly coupled with applications and expensive to integrate. The result is technical debt, which is re-paid by taking even bigger "loans", resulting in an ever-increasing technical debt. Software engineering and procurement practices work in sync with market forces to maintain this trend. This talk demonstrates how natural this situation is. The question is: can something be done to reverse the trend?
The Microsoft 365 Migration Tutorial For Beginner.pptxoperationspcvita
This presentation will help you understand the power of Microsoft 365. However, we have mentioned every productivity app included in Office 365. Additionally, we have suggested the migration situation related to Office 365 and how we can help you.
You can also read: https://www.systoolsgroup.com/updates/office-365-tenant-to-tenant-migration-step-by-step-complete-guide/
Introduction of Cybersecurity with OSS at Code Europe 2024Hiroshi SHIBATA
I develop the Ruby programming language, RubyGems, and Bundler, which are package managers for Ruby. Today, I will introduce how to enhance the security of your application using open-source software (OSS) examples from Ruby and RubyGems.
The first topic is CVE (Common Vulnerabilities and Exposures). I have published CVEs many times. But what exactly is a CVE? I'll provide a basic understanding of CVEs and explain how to detect and handle vulnerabilities in OSS.
Next, let's discuss package managers. Package managers play a critical role in the OSS ecosystem. I'll explain how to manage library dependencies in your application.
I'll share insights into how the Ruby and RubyGems core team works to keep our ecosystem safe. By the end of this talk, you'll have a better understanding of how to safeguard your code.
Main news related to the CCS TSI 2023 (2023/1695)Jakub Marek
An English 🇬🇧 translation of a presentation to the speech I gave about the main changes brought by CCS TSI 2023 at the biggest Czech conference on Communications and signalling systems on Railways, which was held in Clarion Hotel Olomouc from 7th to 9th November 2023 (konferenceszt.cz). Attended by around 500 participants and 200 on-line followers.
The original Czech 🇨🇿 version of the presentation can be found here: https://www.slideshare.net/slideshow/hlavni-novinky-souvisejici-s-ccs-tsi-2023-2023-1695/269688092 .
The videorecording (in Czech) from the presentation is available here: https://youtu.be/WzjJWm4IyPk?si=SImb06tuXGb30BEH .
3. Maintaining patient records online for
24x7 access is their priority
• IT includes 2500 devices – a mix of network
devices, physical and virtual servers, and
storage devices
• Health care services will be disrupted if IT is
down
4. CA Spectrum made them sick
800 Routers & Switches
(mostly Cisco)
1500 Physical & Virtual
Servers
200 Storage Devices
CA Performance ManagementCA SPectrum
PERFORMANCE
MONITORING
CONFIGURATIO
N
MANGAEMENT
5. No clue on how to use
• Too complex to setup and use
• Not hands on and required costly consultation
• No proper correlation between configuration
management and performance monitoring
solution
• Difficult to correlate data
6. OpManager was the right medicine
800 Routers & Switches
(mostly Cisco)
1500 Physical & Virtual
Servers
200 Storage Devices
OpManagerNCM Plug-in
PERFORMANCE
MONITORING
CONFIGURATIO
N
MANGAEMENT
7. OpManager ensured 24x7
access to IT services to doctors
• Easy to setup and use
• Very intuitive
• Tighter integration between configuration
management and performance monitoring
• Easy to correlate fault and performance data