Transcript: #StandardsGoals for 2024: What’s new for BISAC - Tech Forum 2024
Cis516 Week 7
1. OpManager Enterprise Network Management– CIS 516 Fall Quarter 2007
2. What ManageEngine OpManager is? 
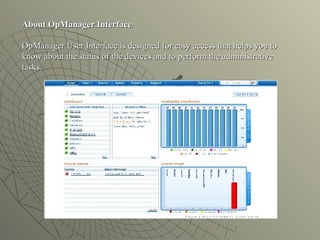
ManageEngine OpManager is a comprehensive Network, Systems, and Applications monitoring software that provides operators an integrated console for monitoring the performance of routers, servers, switches, and printers. OpManager offers integrated fault and performance management functionality. It provides a lot of out-of-the-box graphs and reports, which give a wealth of information to the operators about the health of their networks, servers and applications
3. About OpManager Interface OpManager User Interface is designed for easy access that helps you to know about the status of the devices and to perform the administrative tasks.
6. Networks View The Networks View map shows all the managed networks and the routers that inter-connect the different networks. The network icon with on it denotes that some or all devices in the network are being monitored. The network icon with on it denotes that no device is managed in the network. The green link denotes the status of the router interface that is connected to the linked network.
7. Alarms Following are the different views available in OpManager to know the devices under trouble: Devices to Watch Network Events Unsolicited Traps All Alarms Active Alarms
9. About Reports Intuitive dashboards and detailed reports helps you determine the performance of your network in very less time. The default reports available in OpManager include: Servers : Servers Health report shows a report of complete server health for top ten servers. Reports for Servers by resource utilization gives a detailed account of resource utilizations for the servers. The resources include CPU, Memory, Disk utilization, Interface traffic and utilization, all servers disk usage report and all servers availability reports. Routers : Routers Health report shows a report of complete router health for top ten routers. Reports for Servers by resource utilization gives a detailed account of resource utilizations for the servers. The resources include CPU, Memory, Interface traffic and utilization, and all routers availability report. Switches : Reports for switches include a full Switch health report, Port traffic, utilization and error reports. Services : Response time reports are available for HTTP, SMTP, MySQL , Telnet, and FTP Services. DomainControllers : The reports for DomainControllers include the availability report, CPU, Memory, and Disk usage reports. Besides this, the DomainController snapshot shows a special dashboard of performance of all DC resources. All Devices : CPU and memory utilization, interface traffic and utilization reports are available for all devices. Inventory : Inventory reports are available for servers, desktops, all devices, SNMP-enabled devices and non-SNMP devices.