Downloaded 131 times
![ManageEngine OpManager www.opmanager.com [email_address]](https://image.slidesharecdn.com/vmwaremonitoringmusthaves-100831033238-phpapp02/75/VMware-monitoring-must-haves-15-2048.jpg)


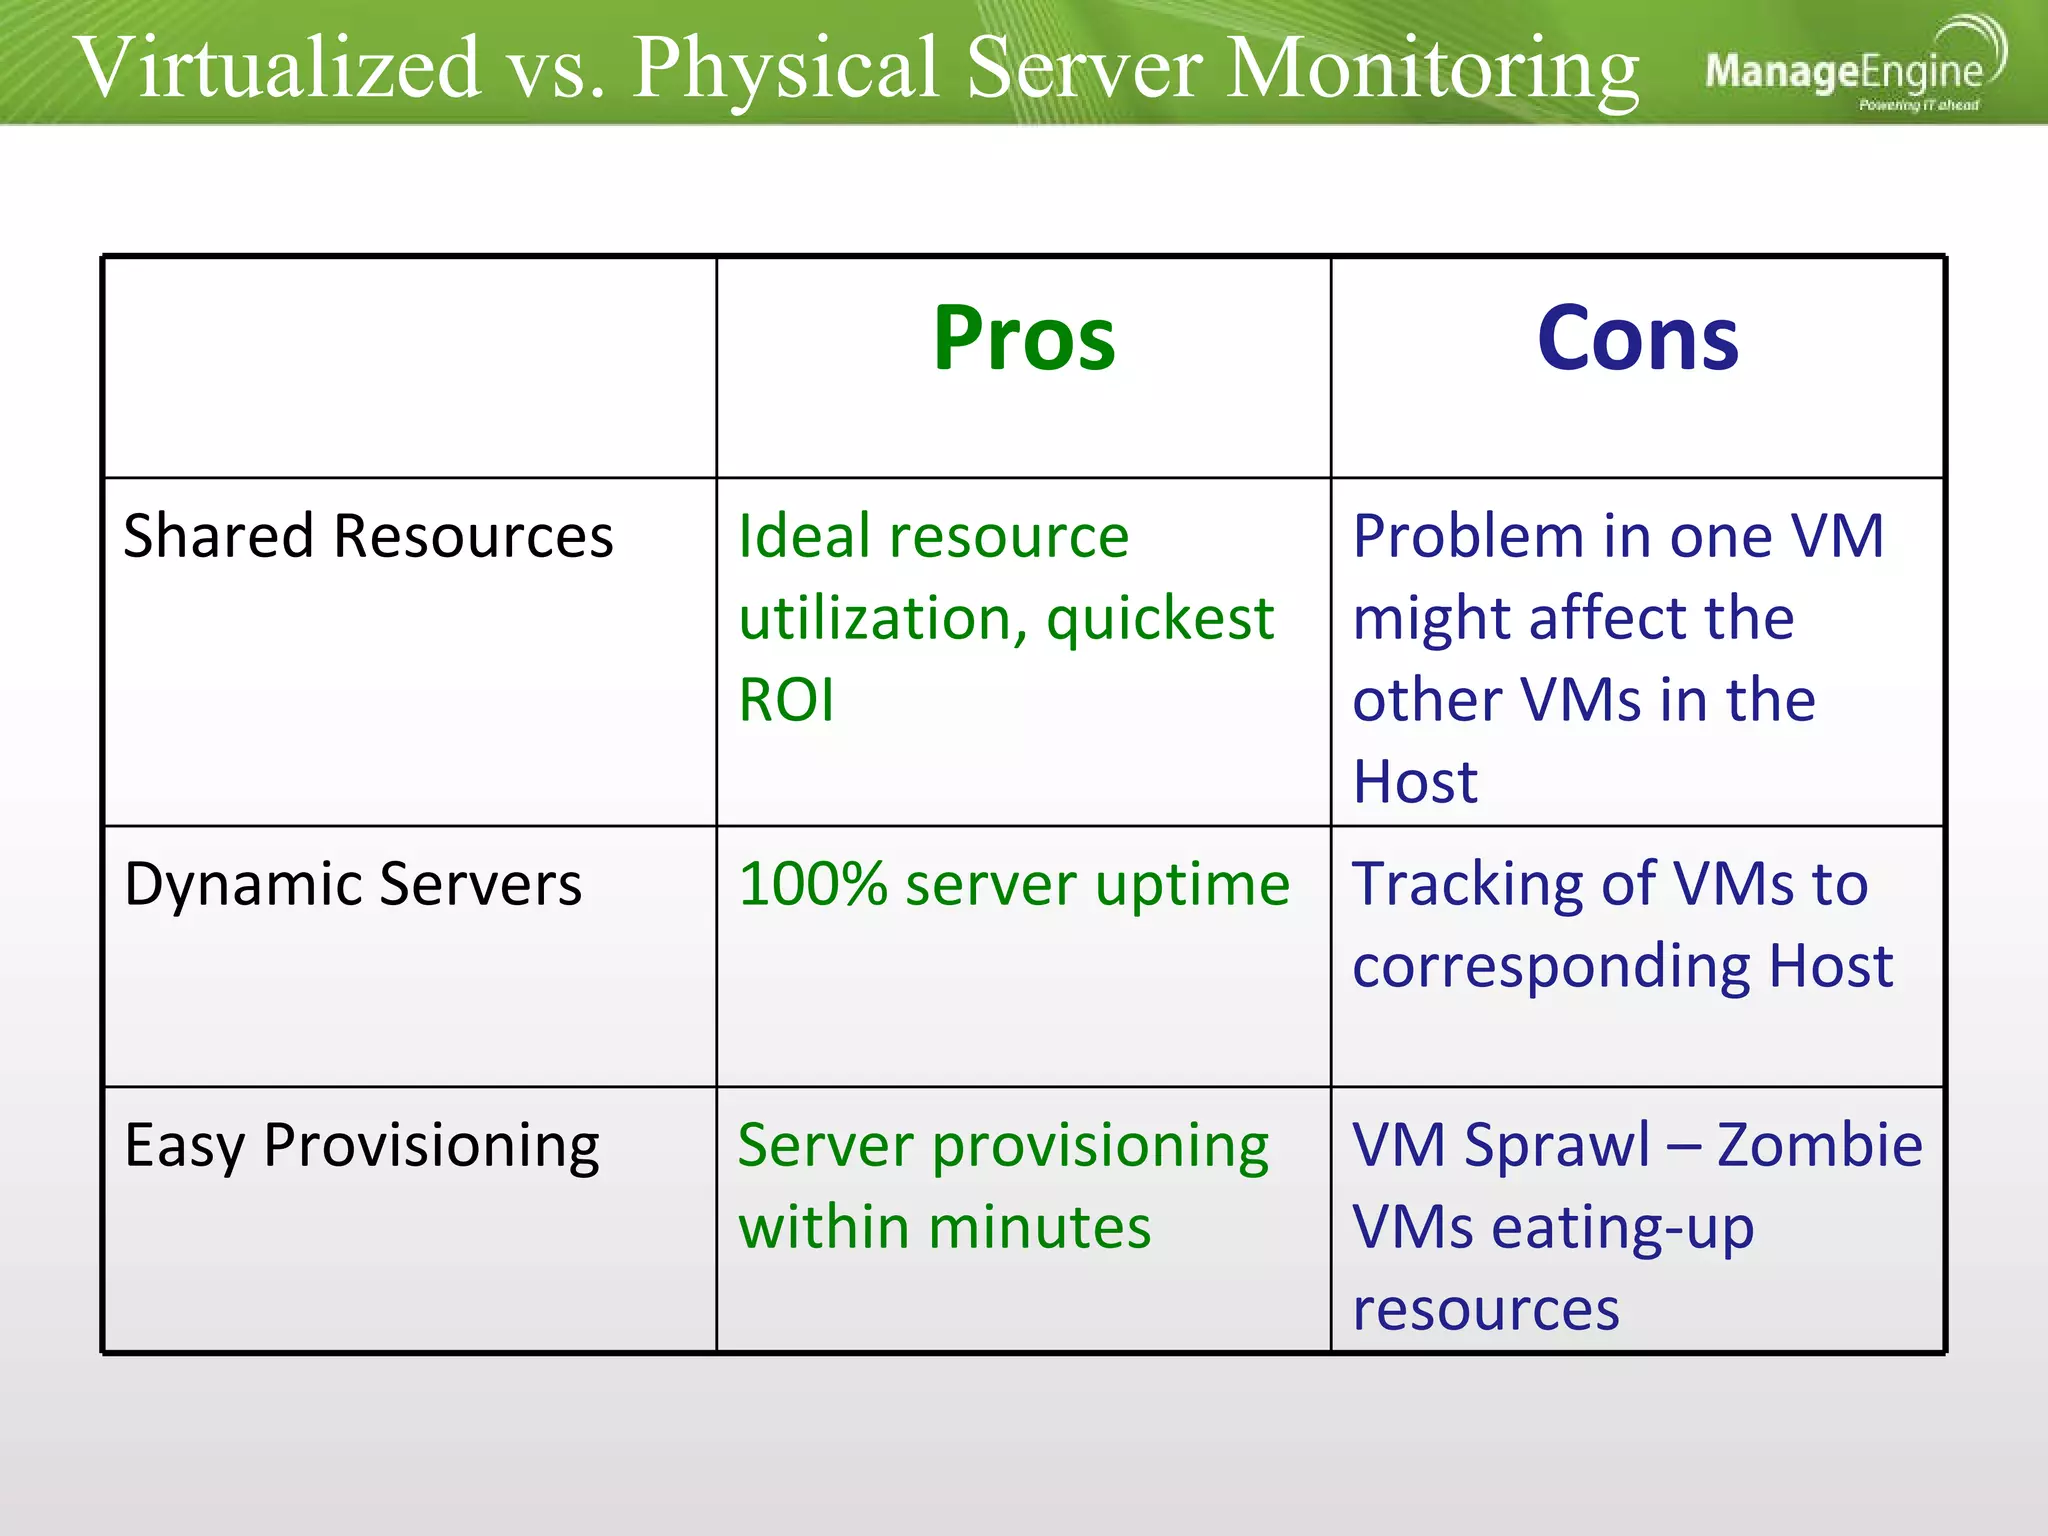
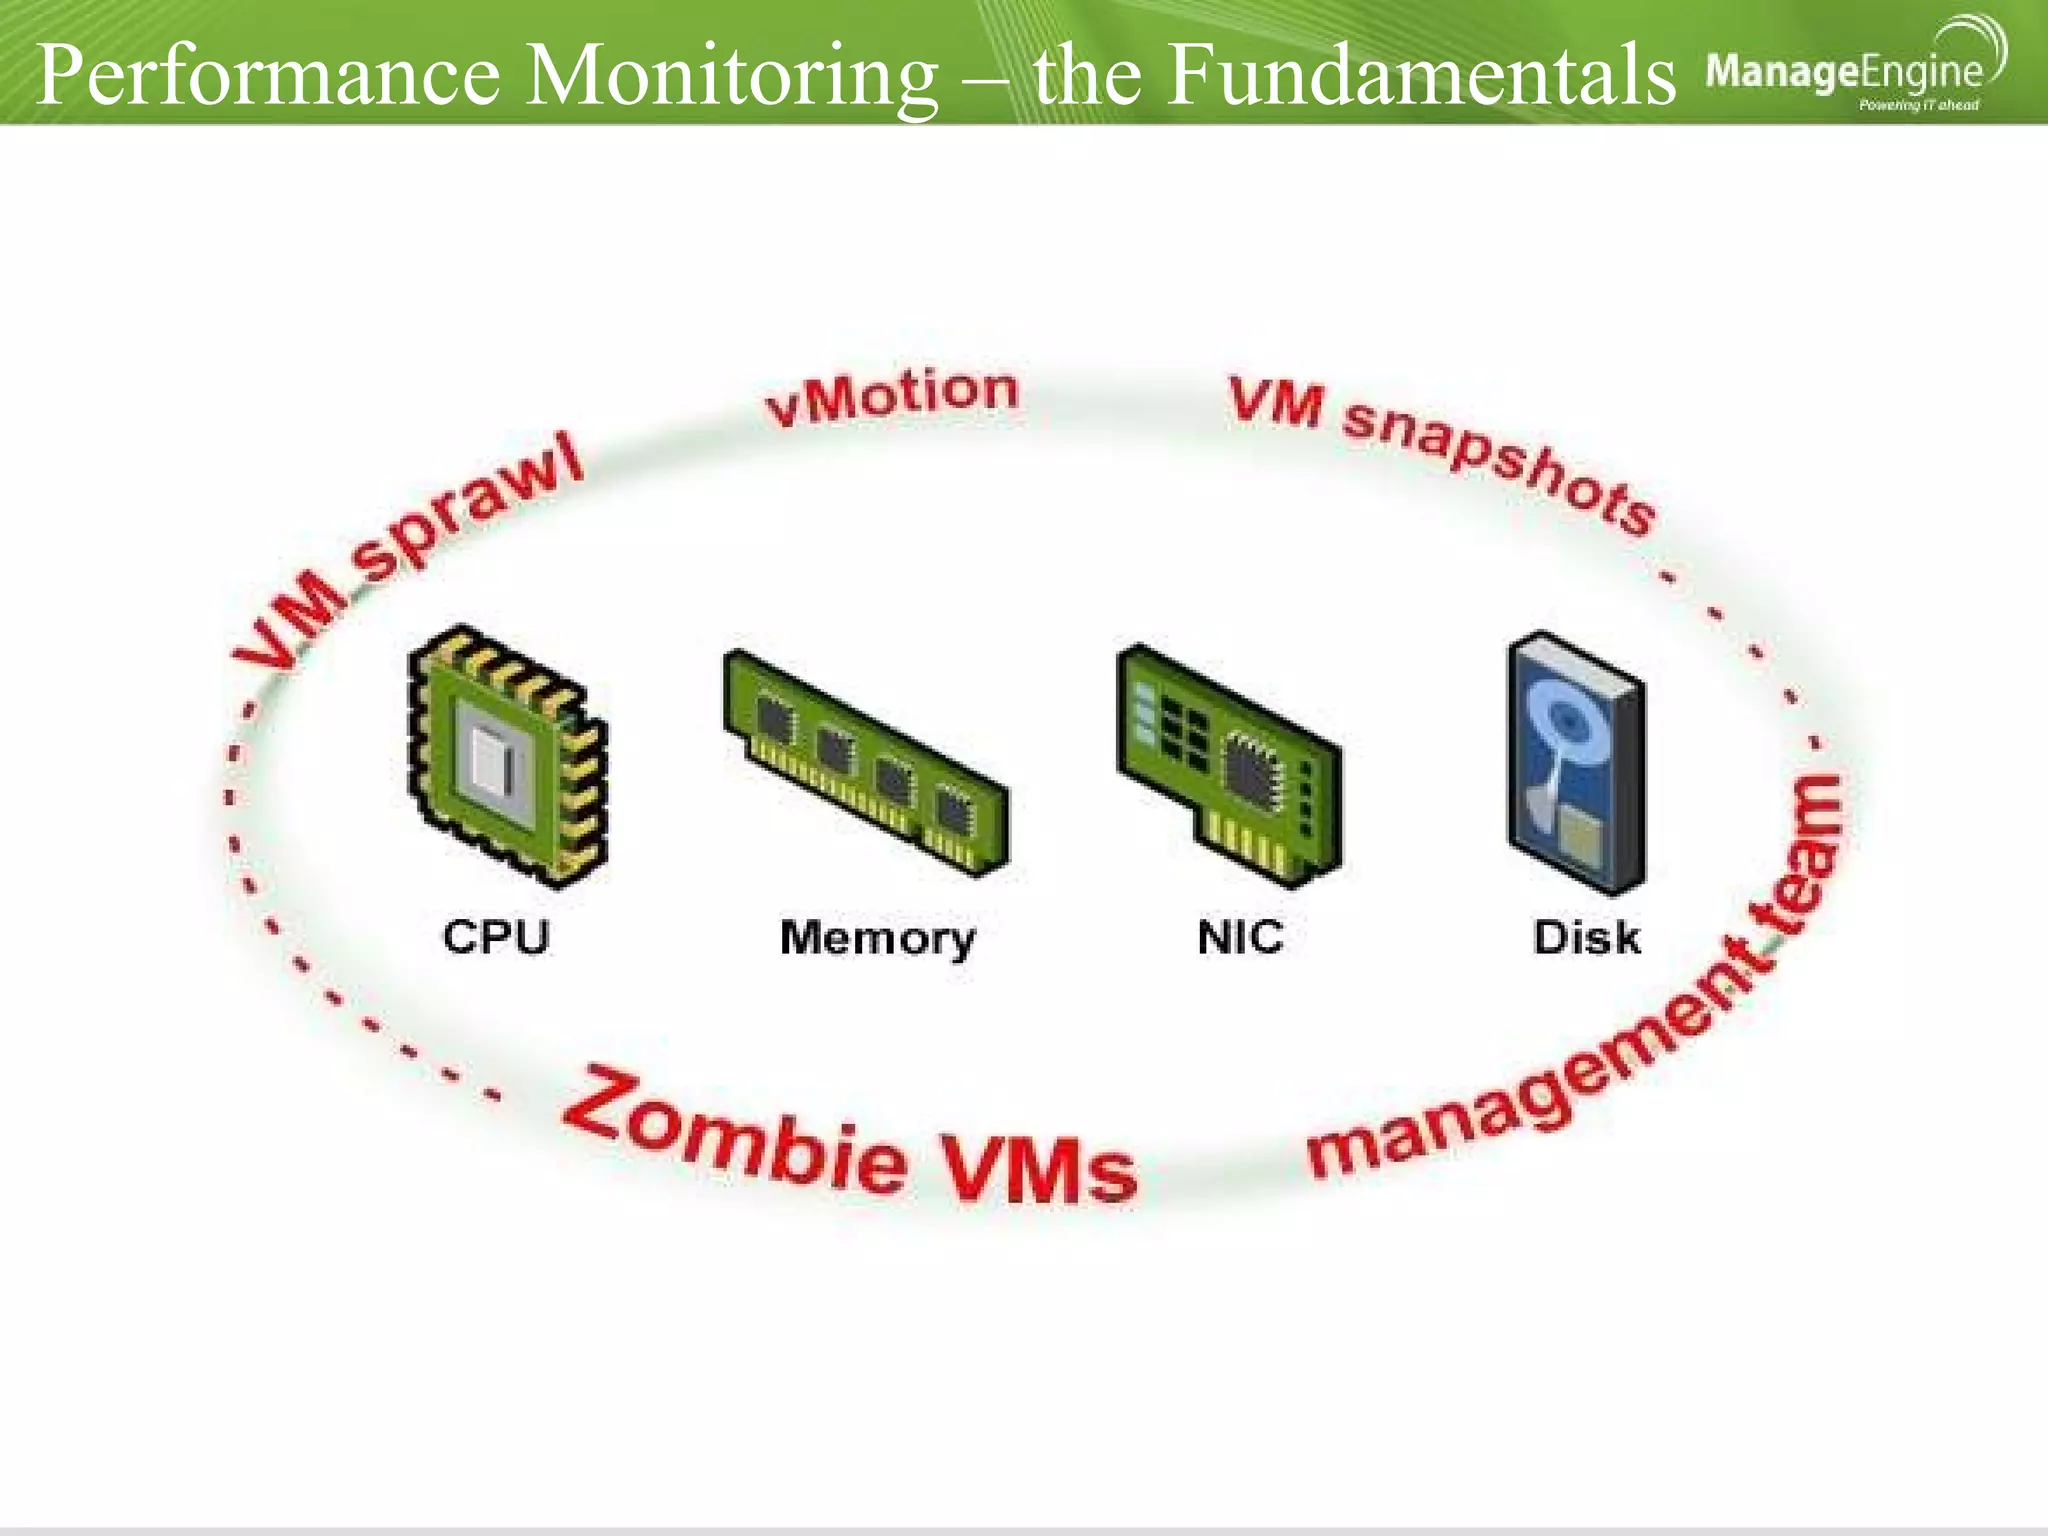
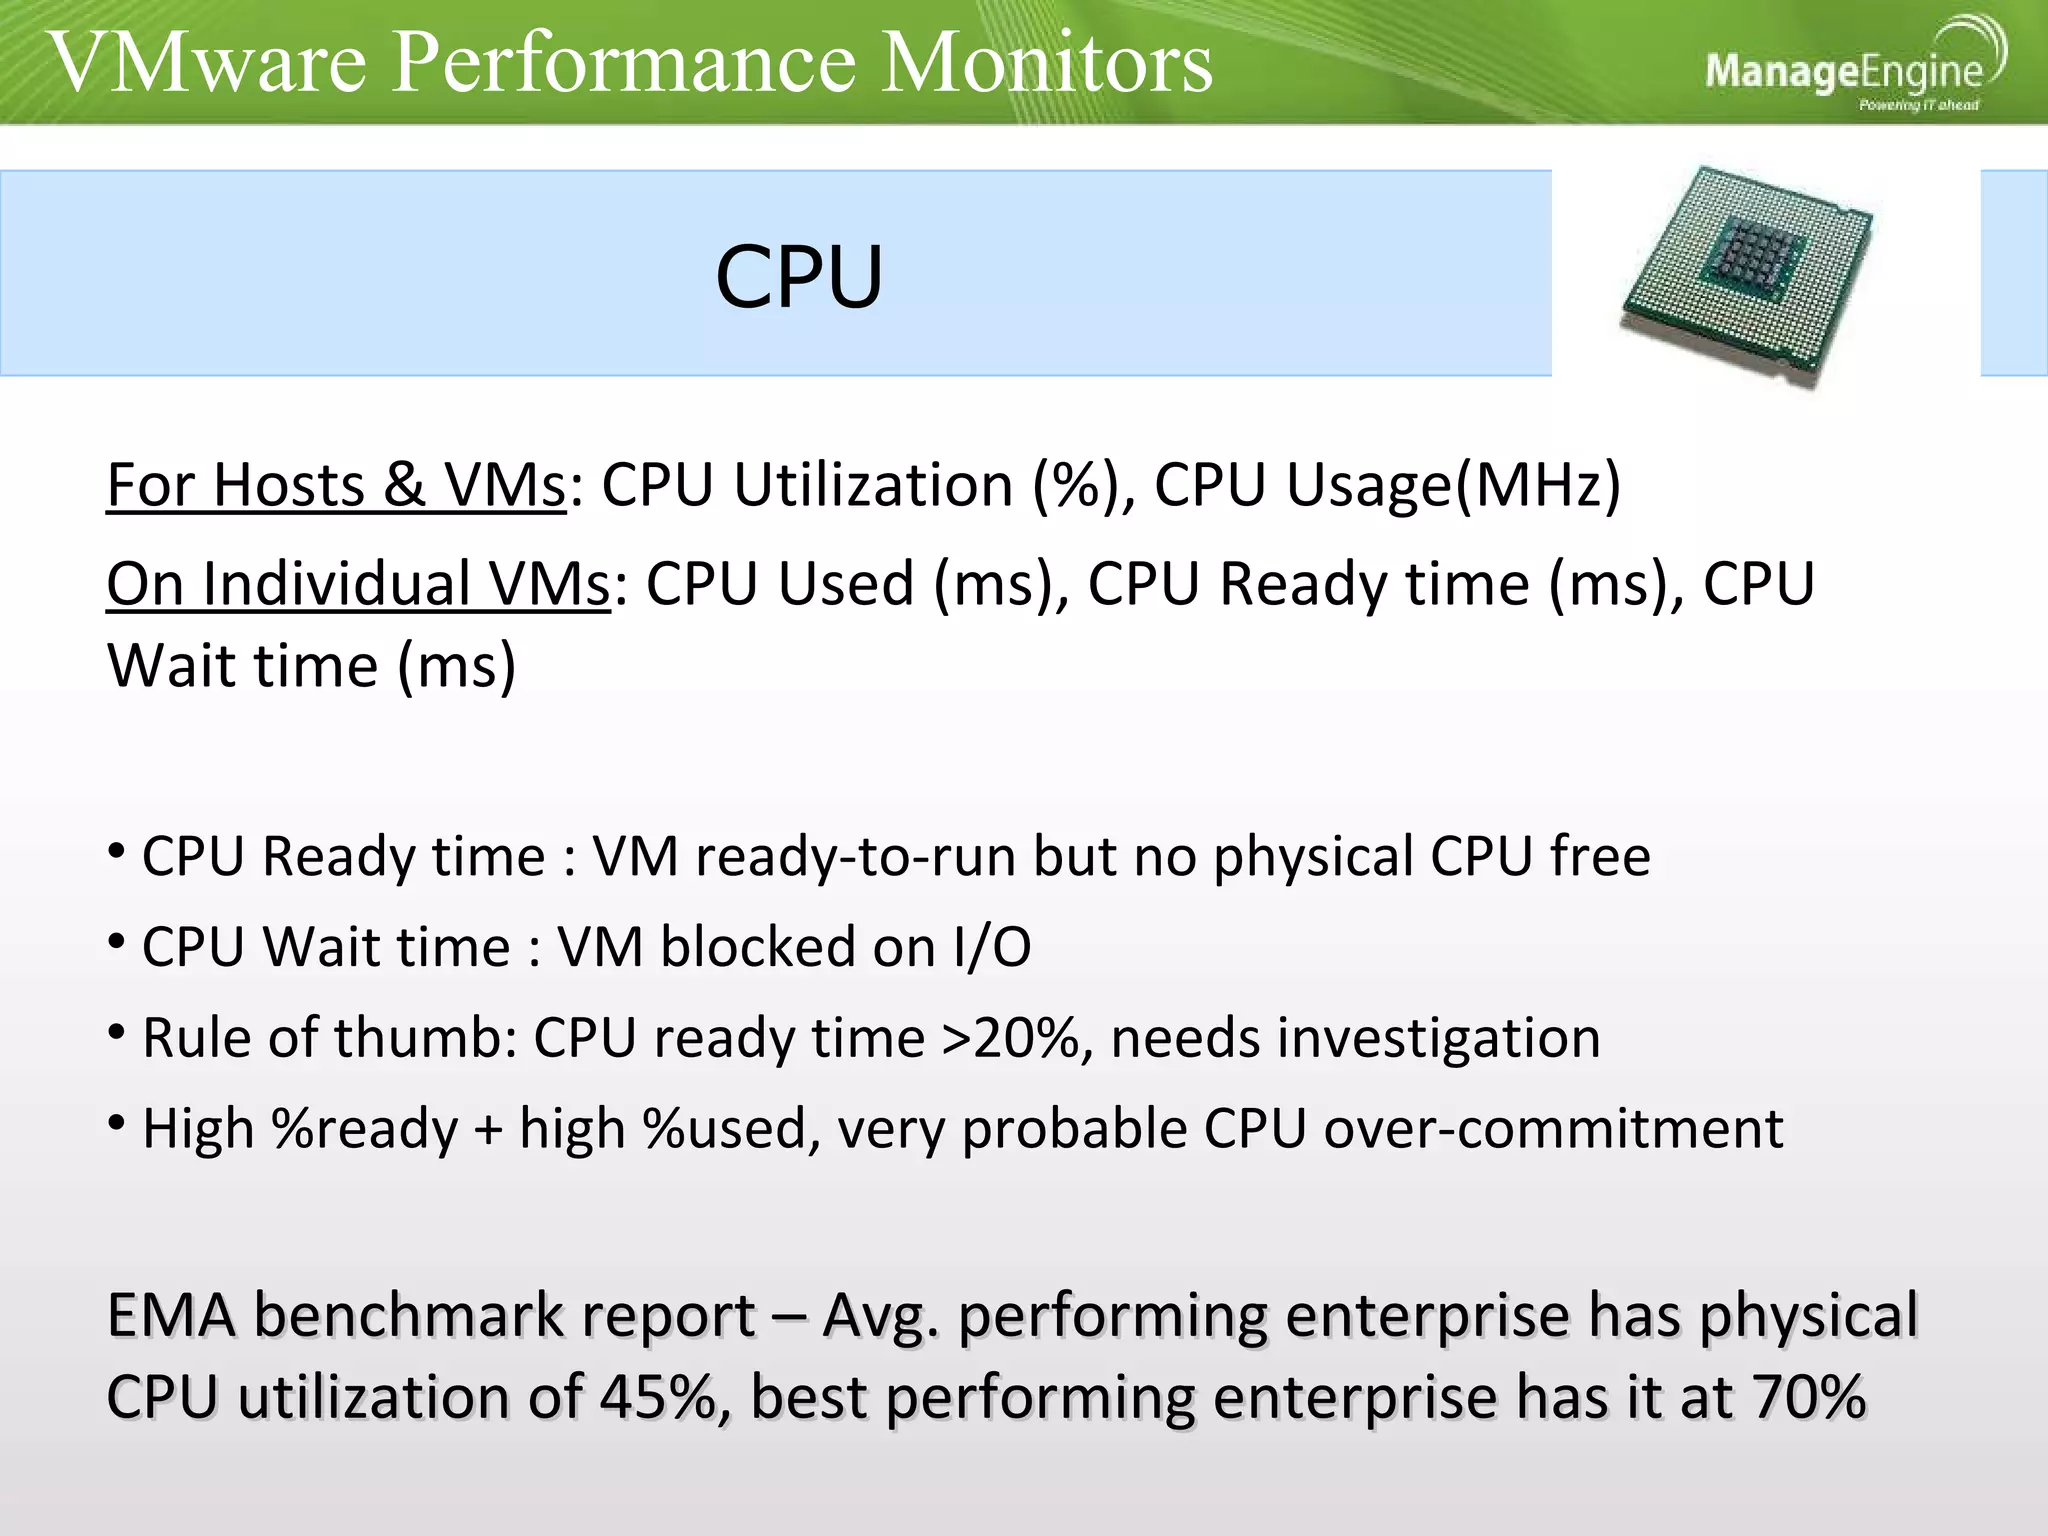
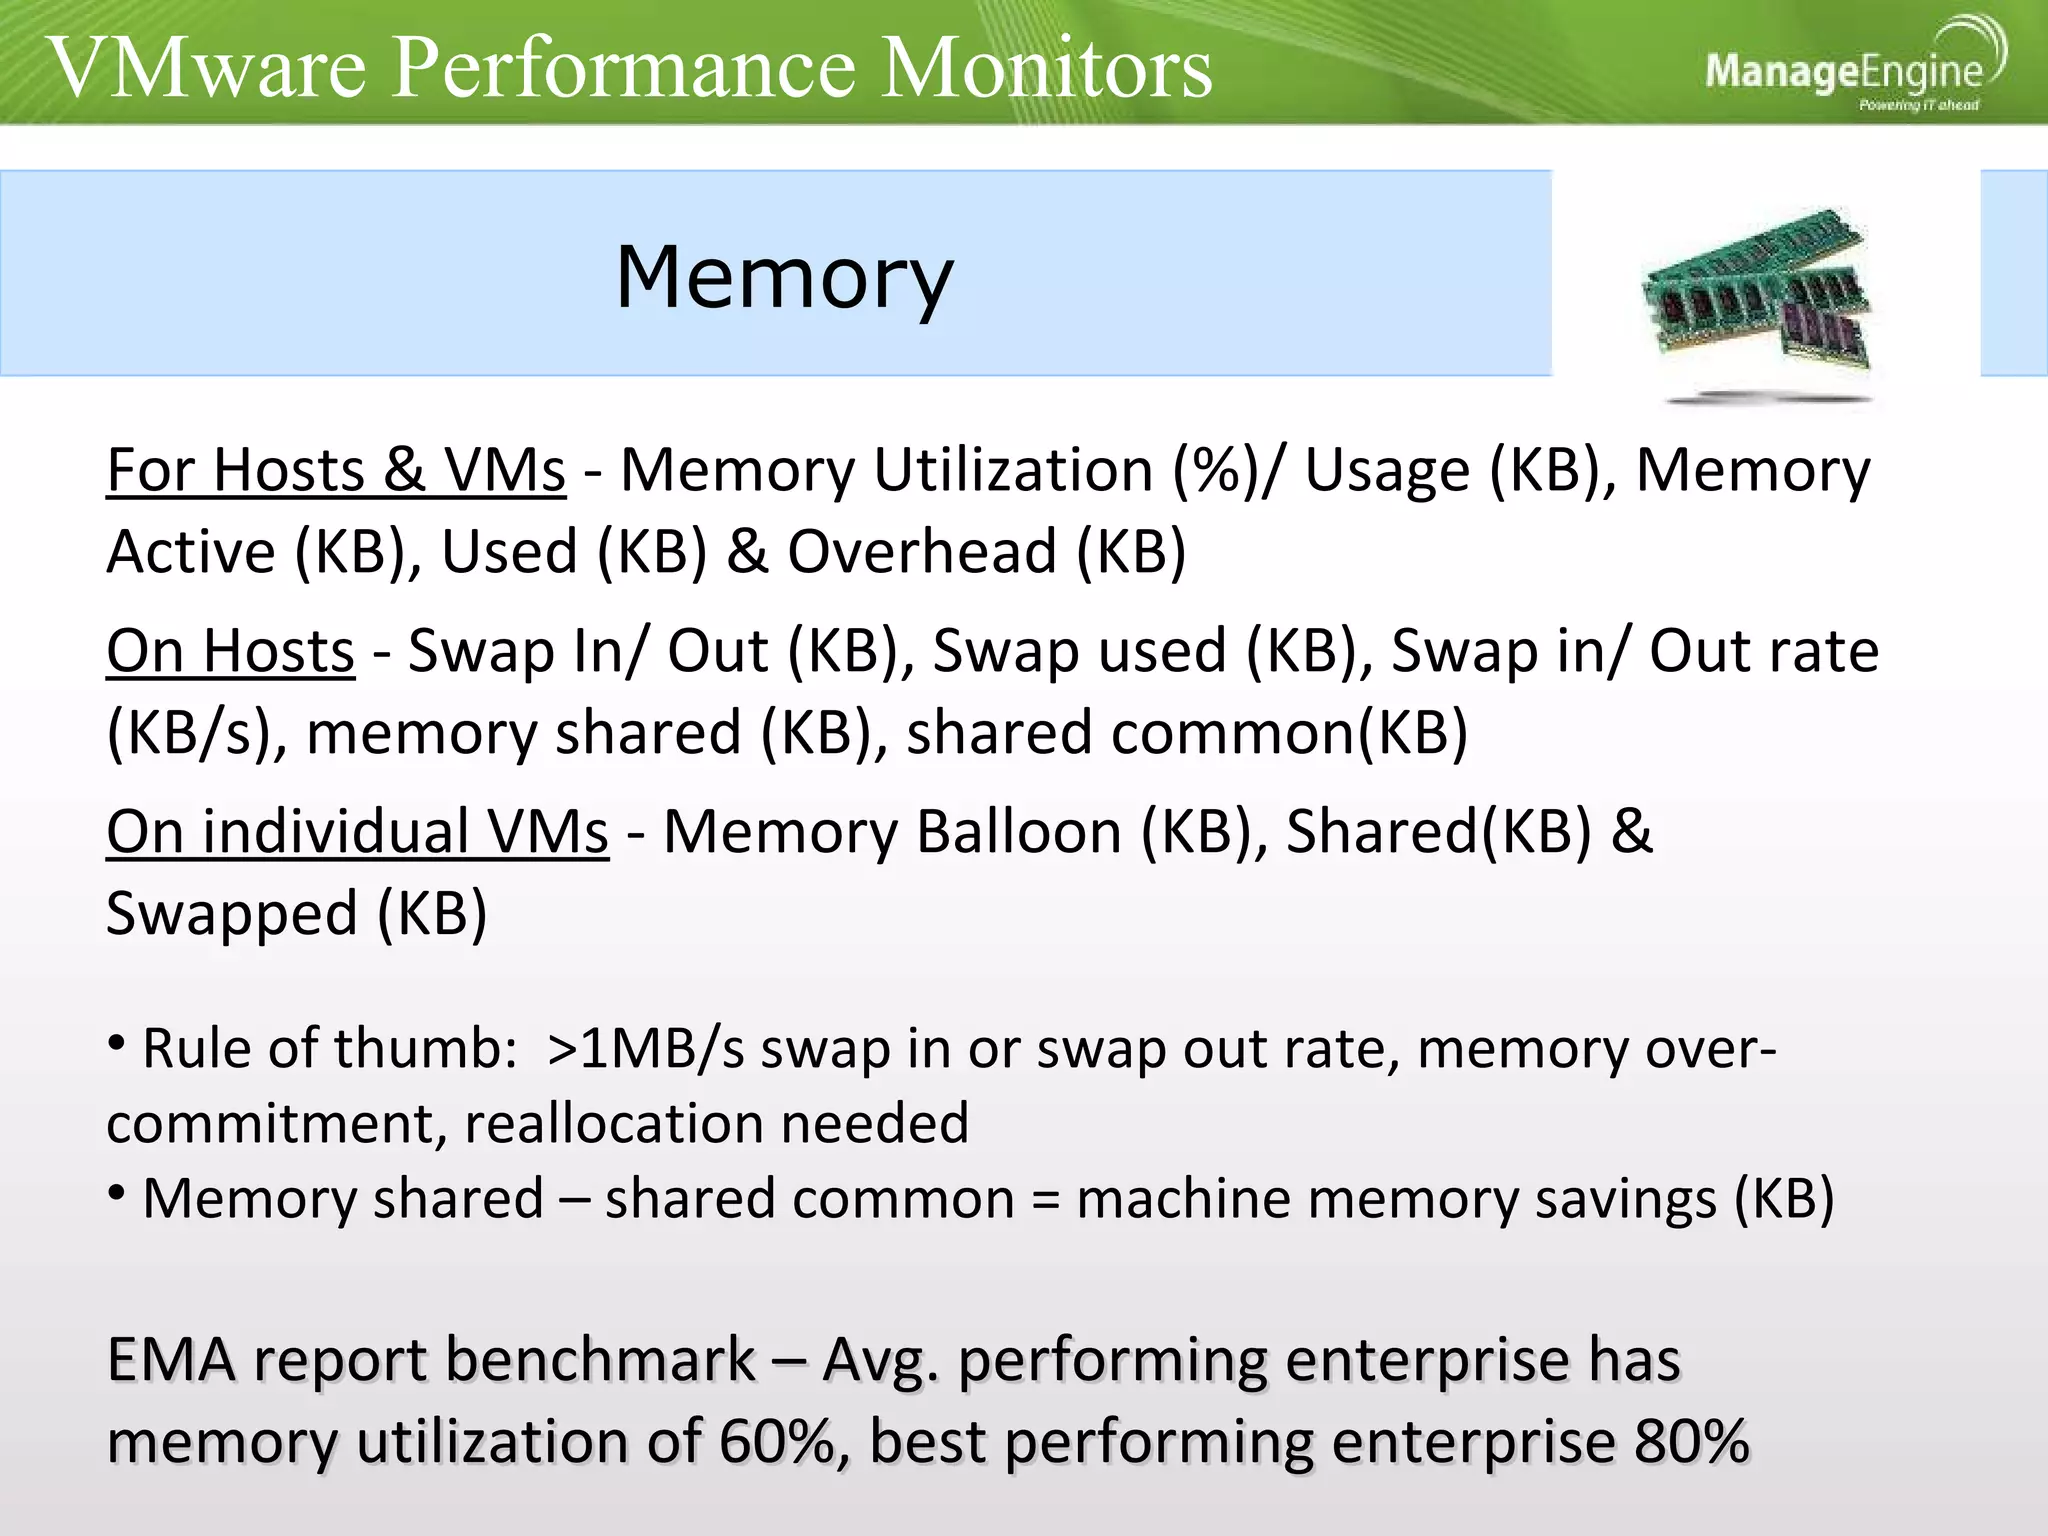
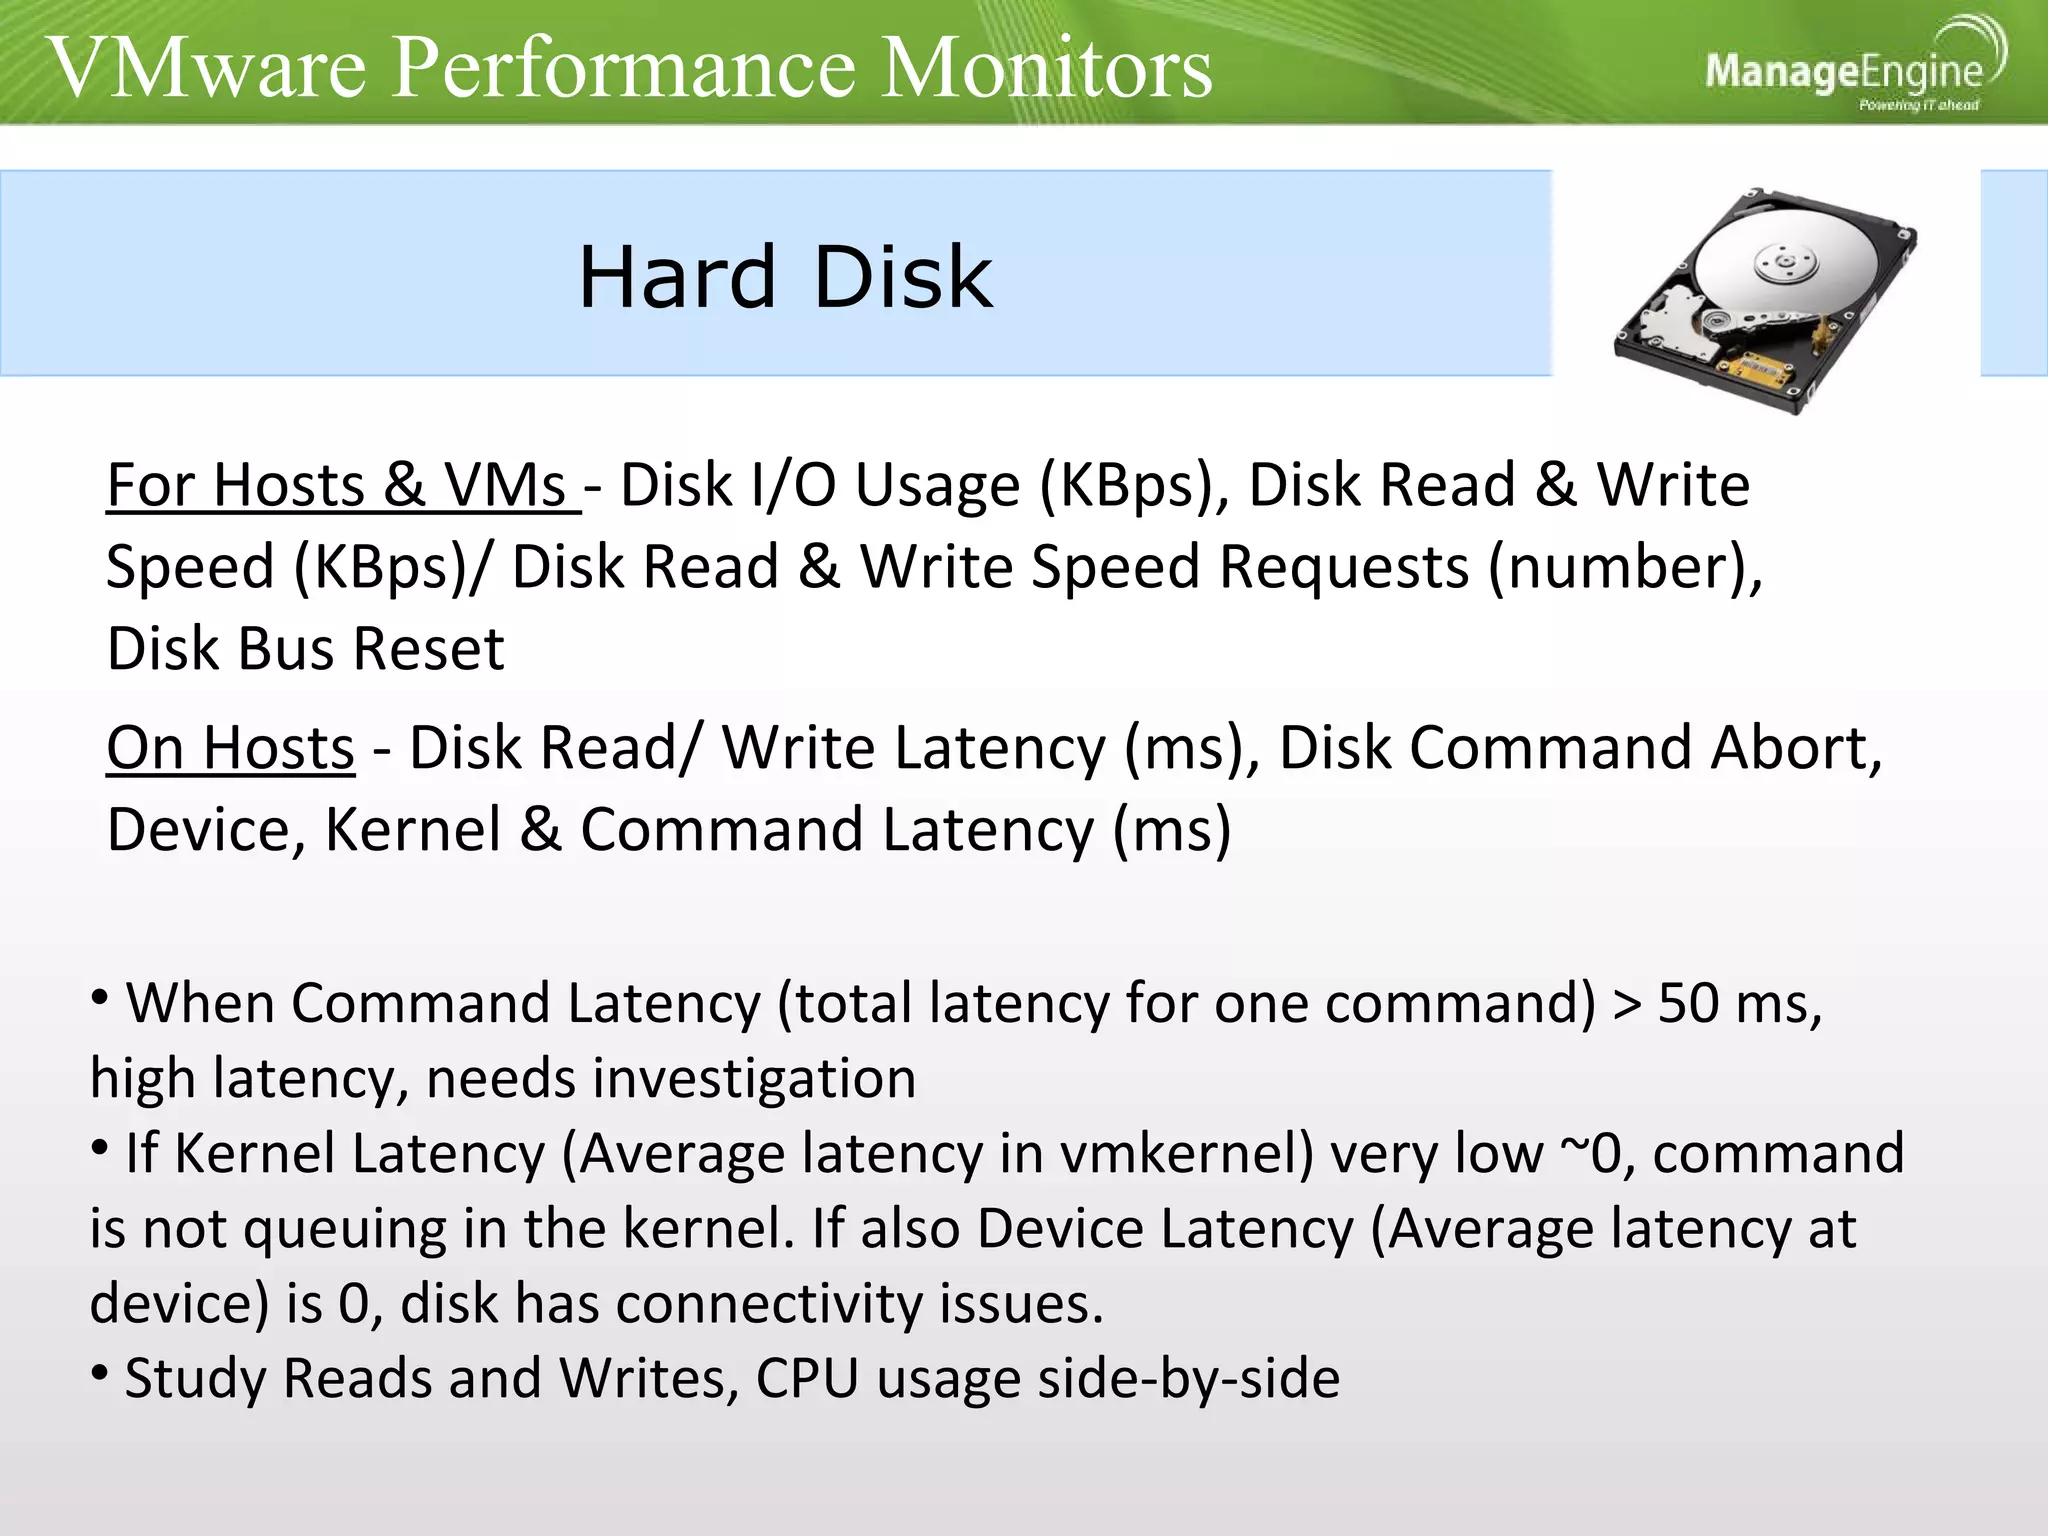
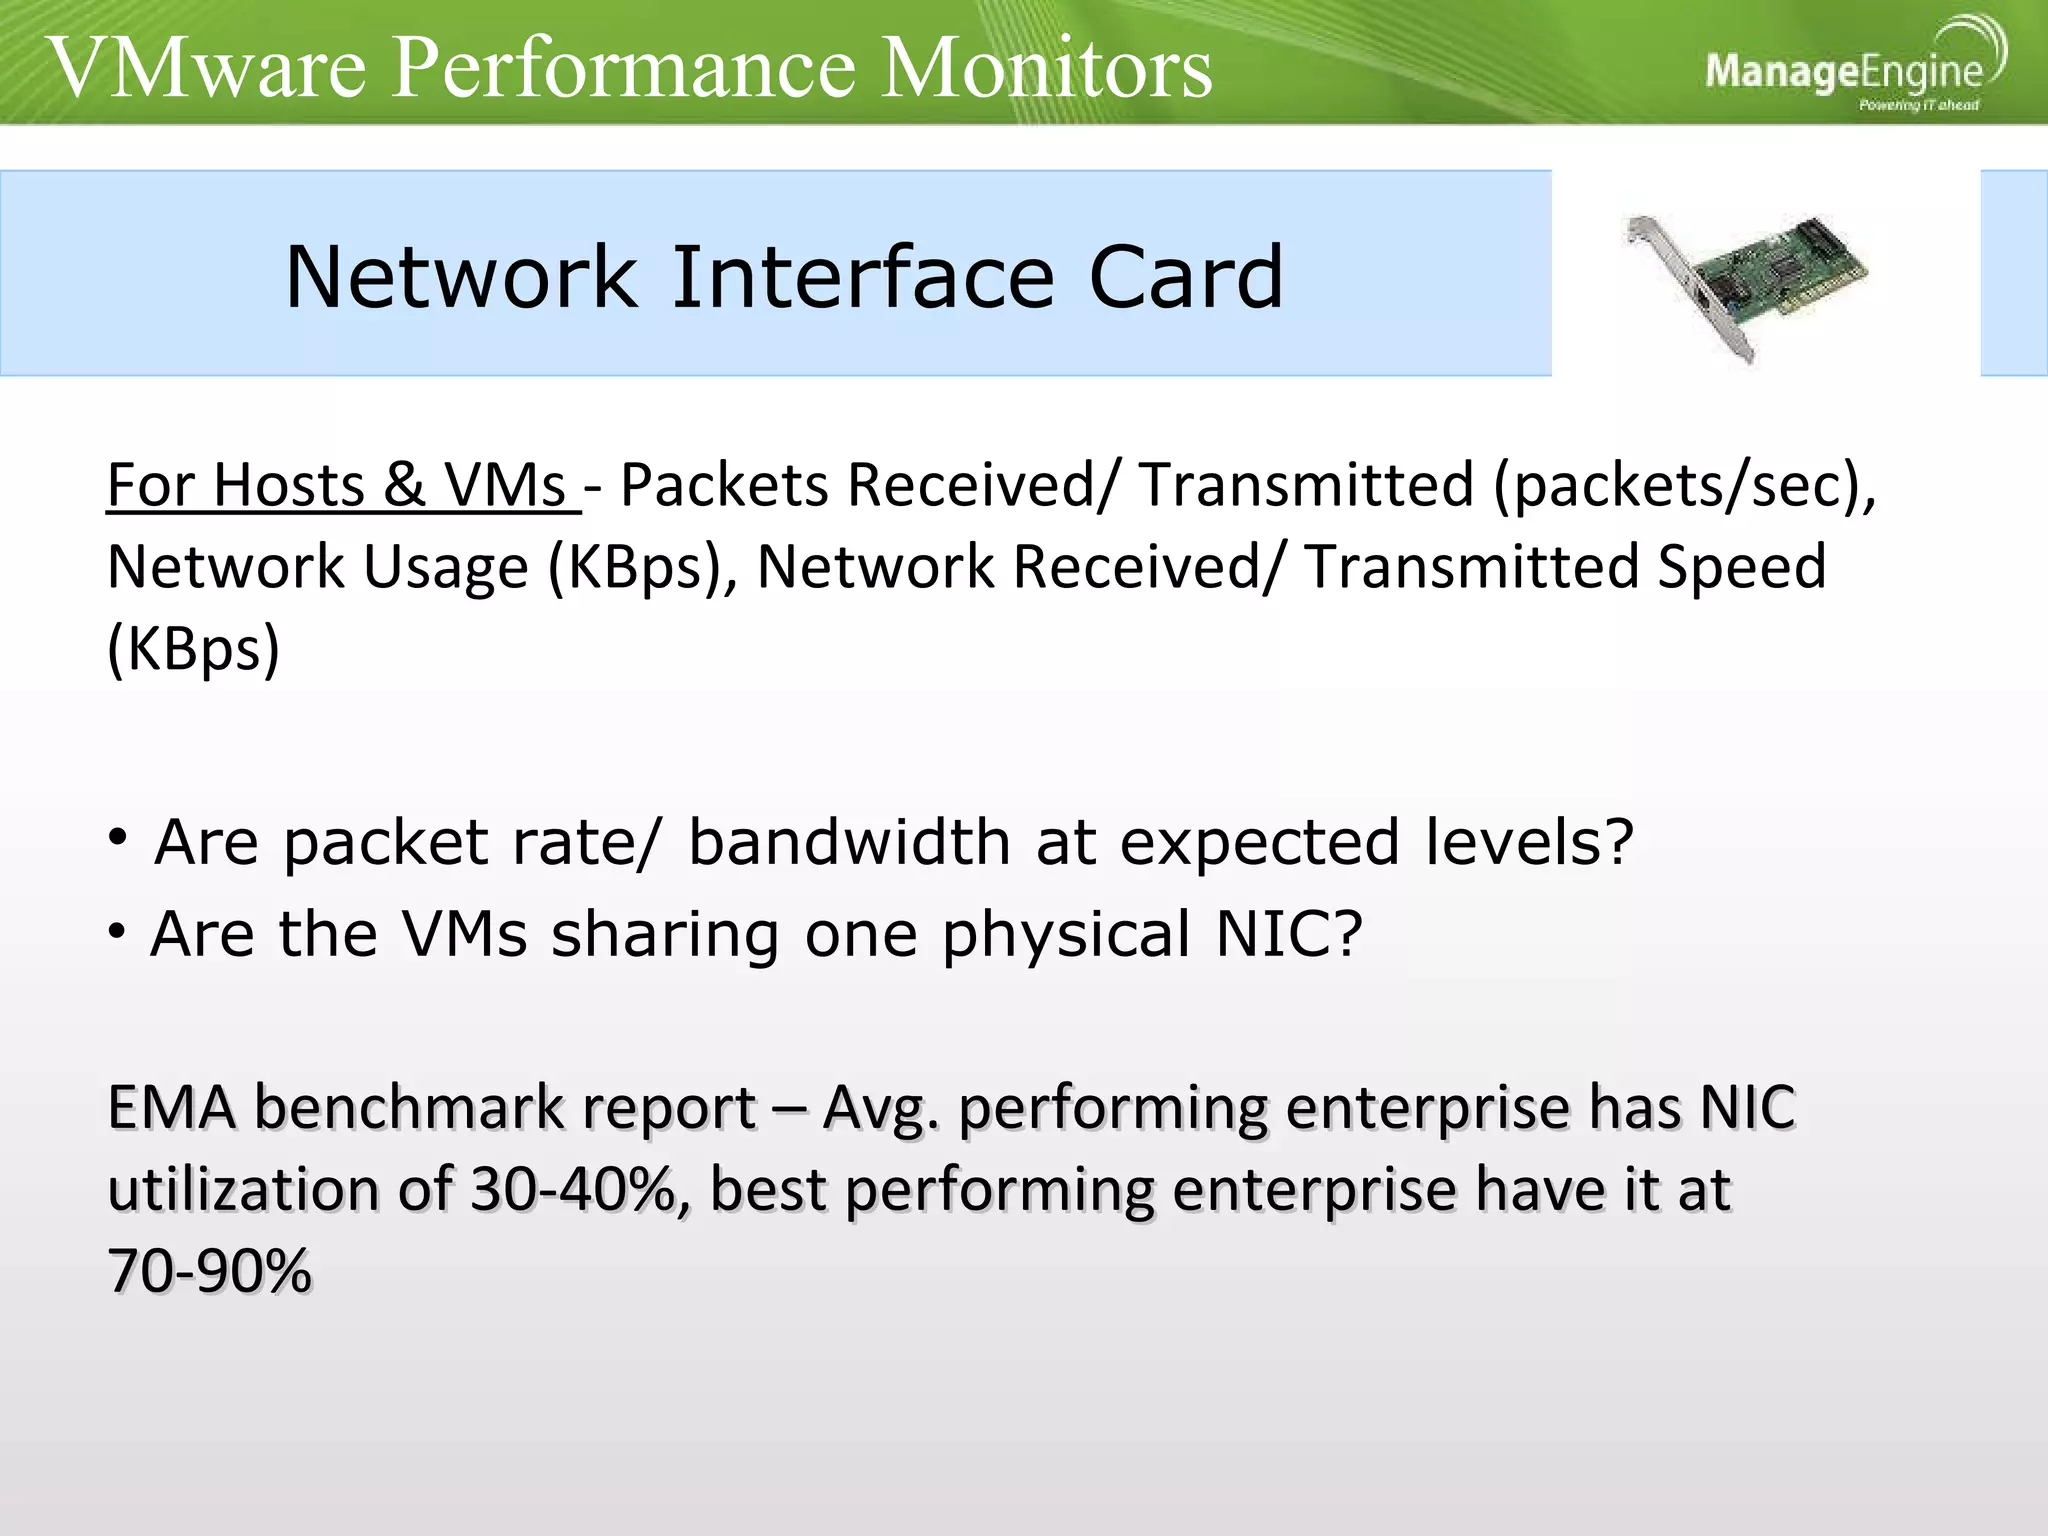
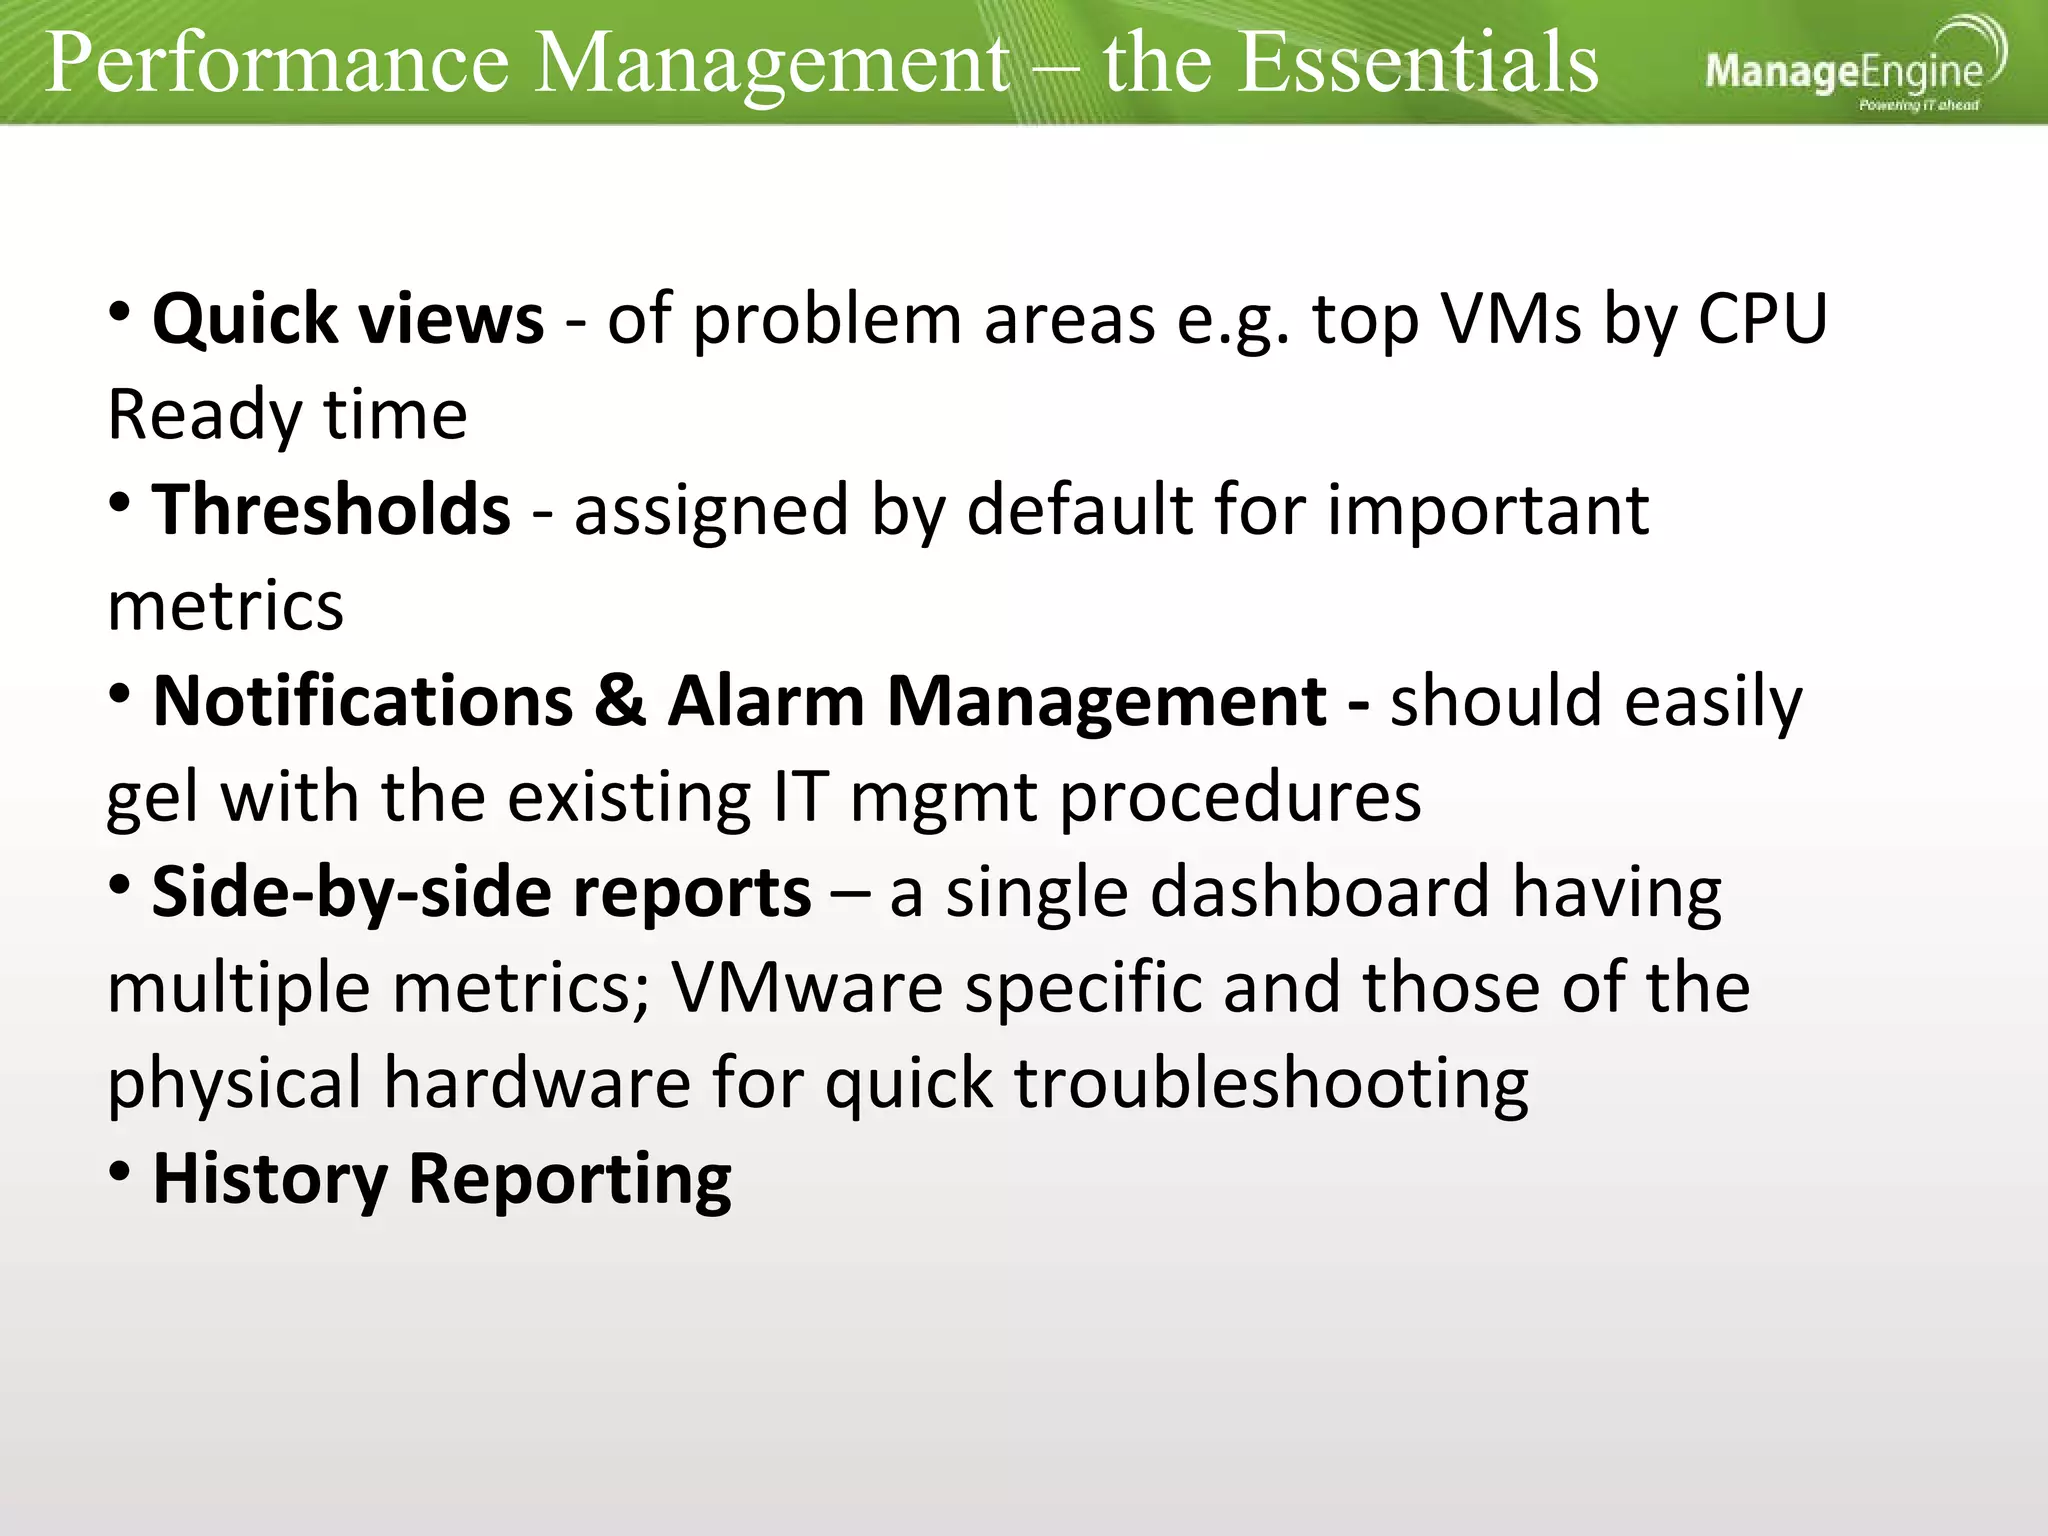
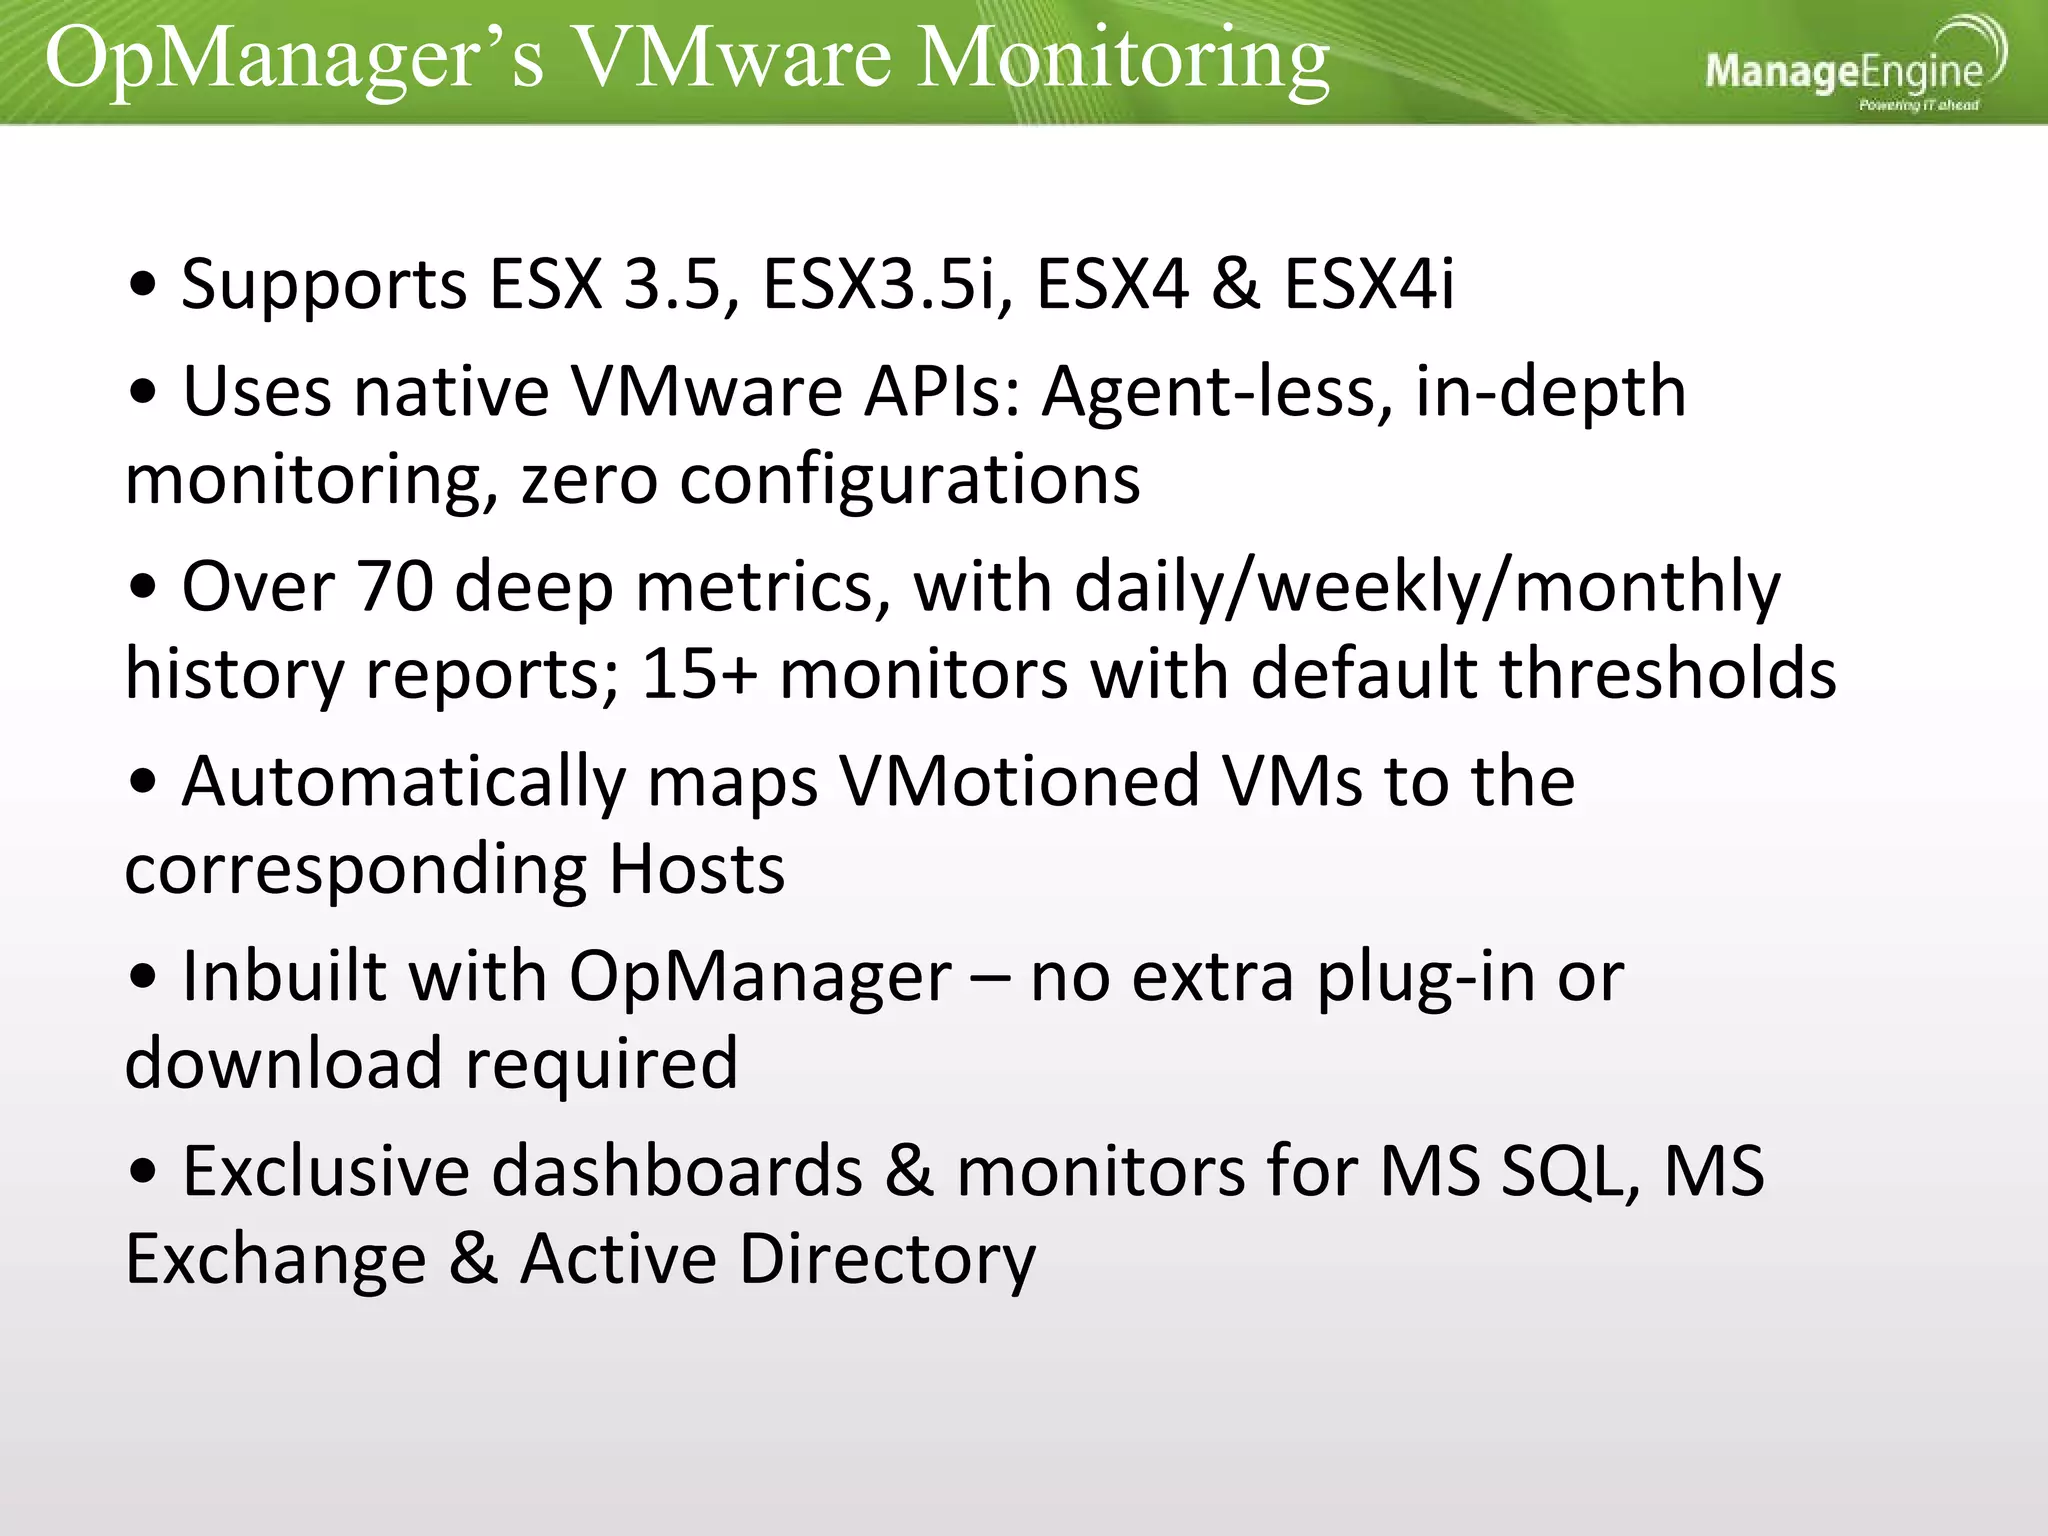
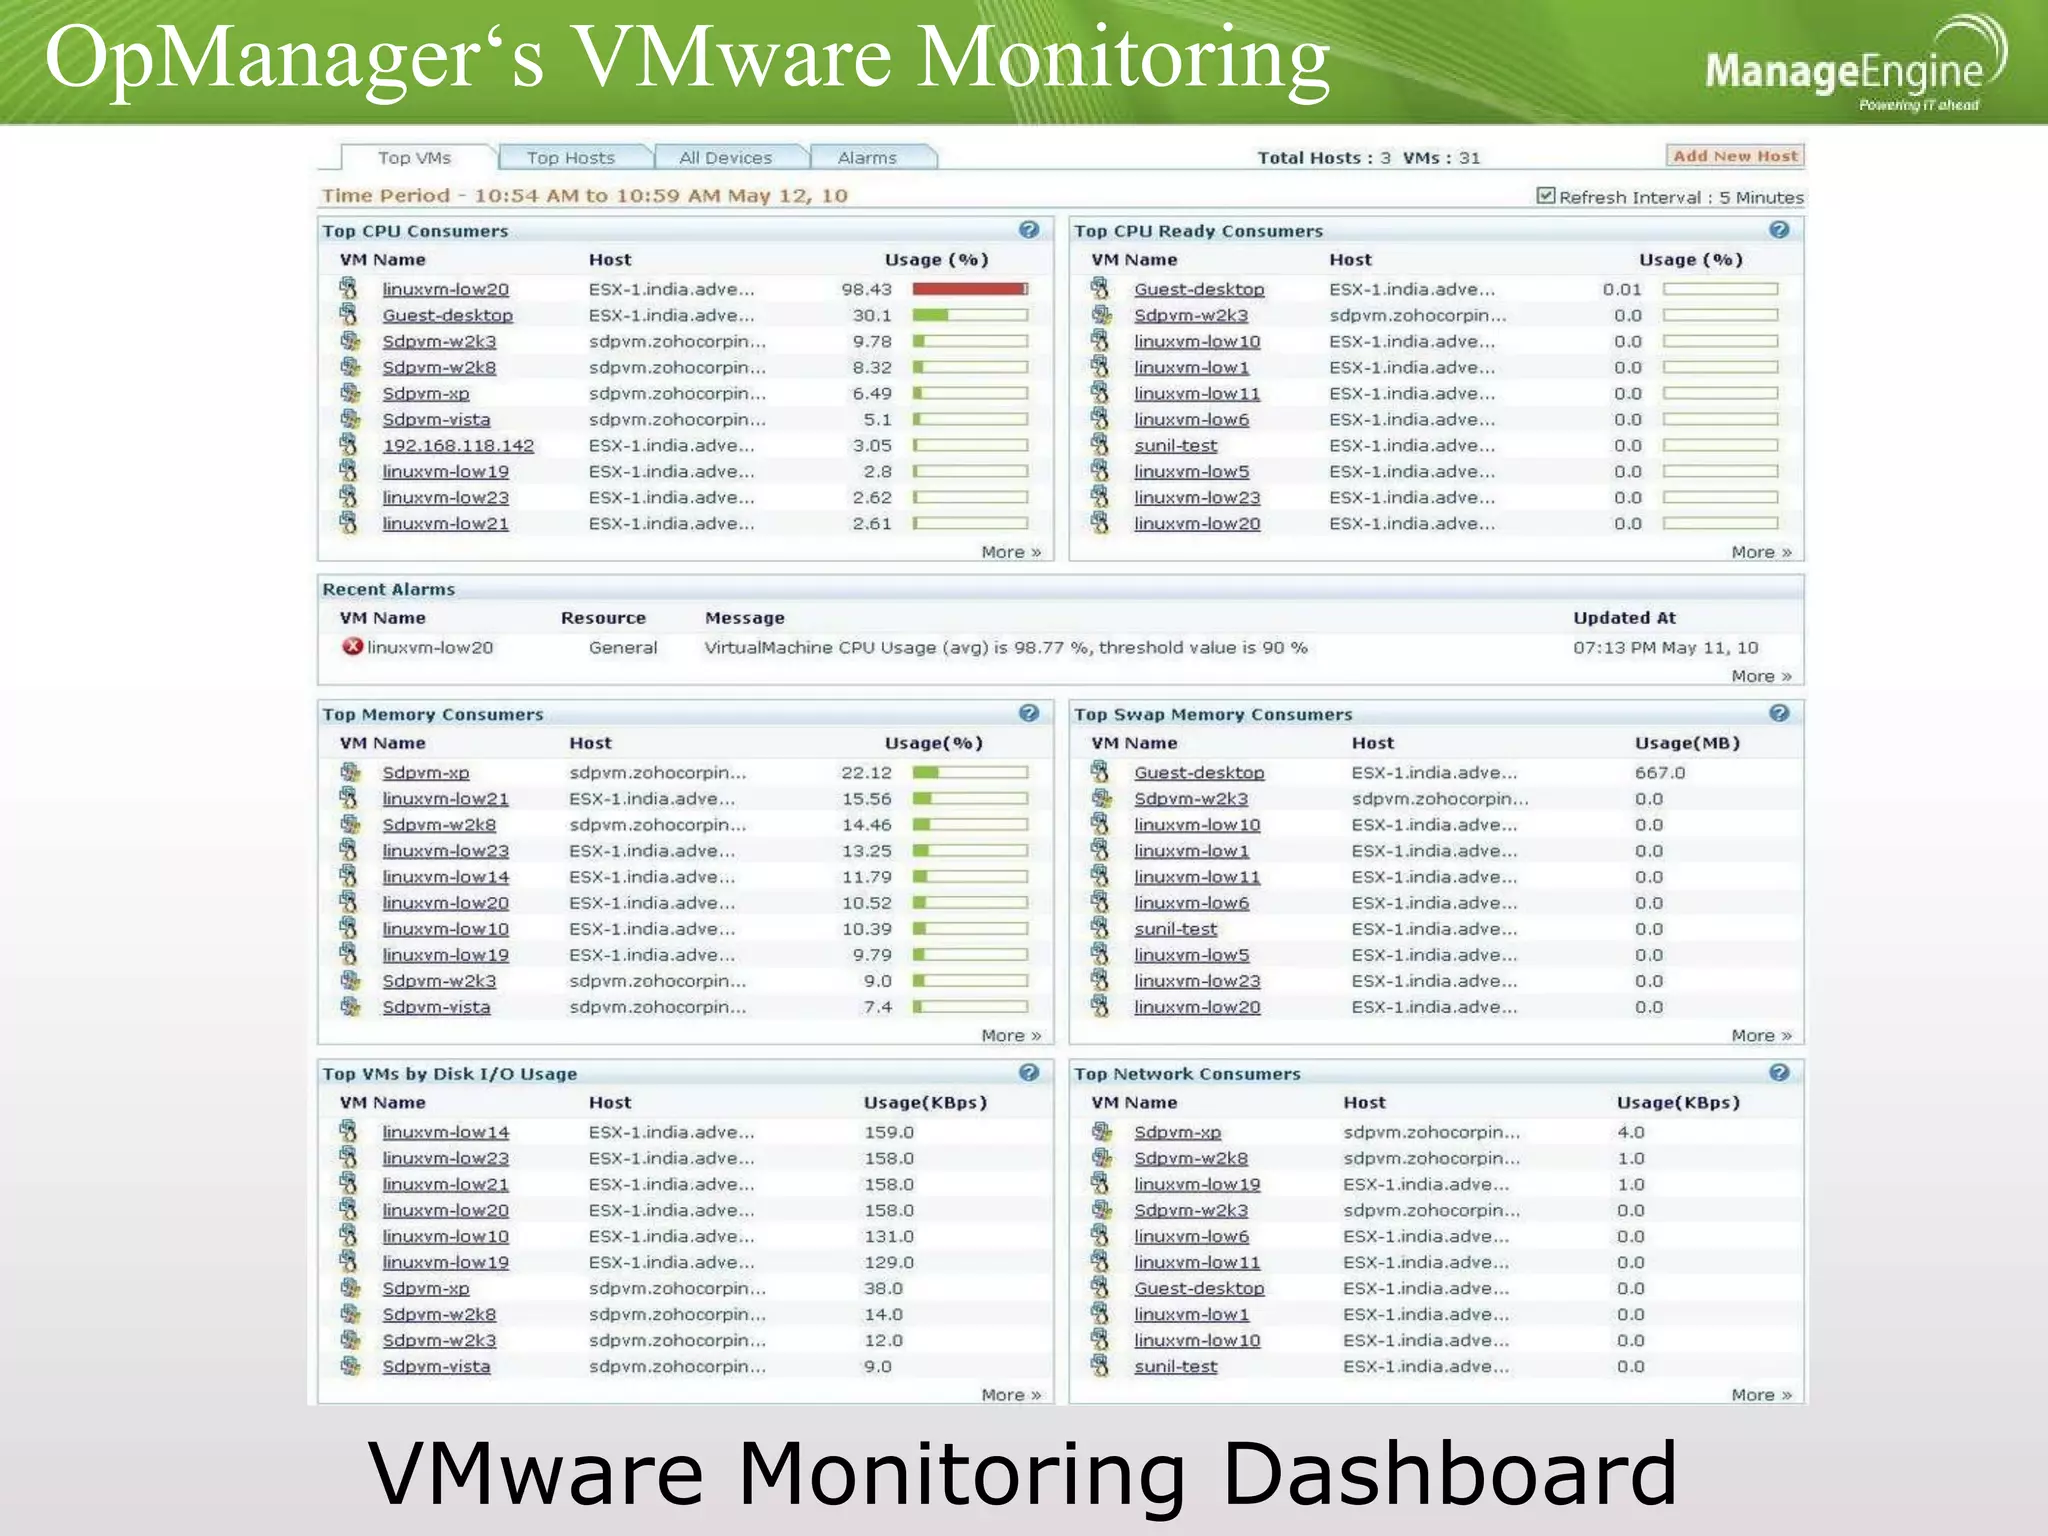
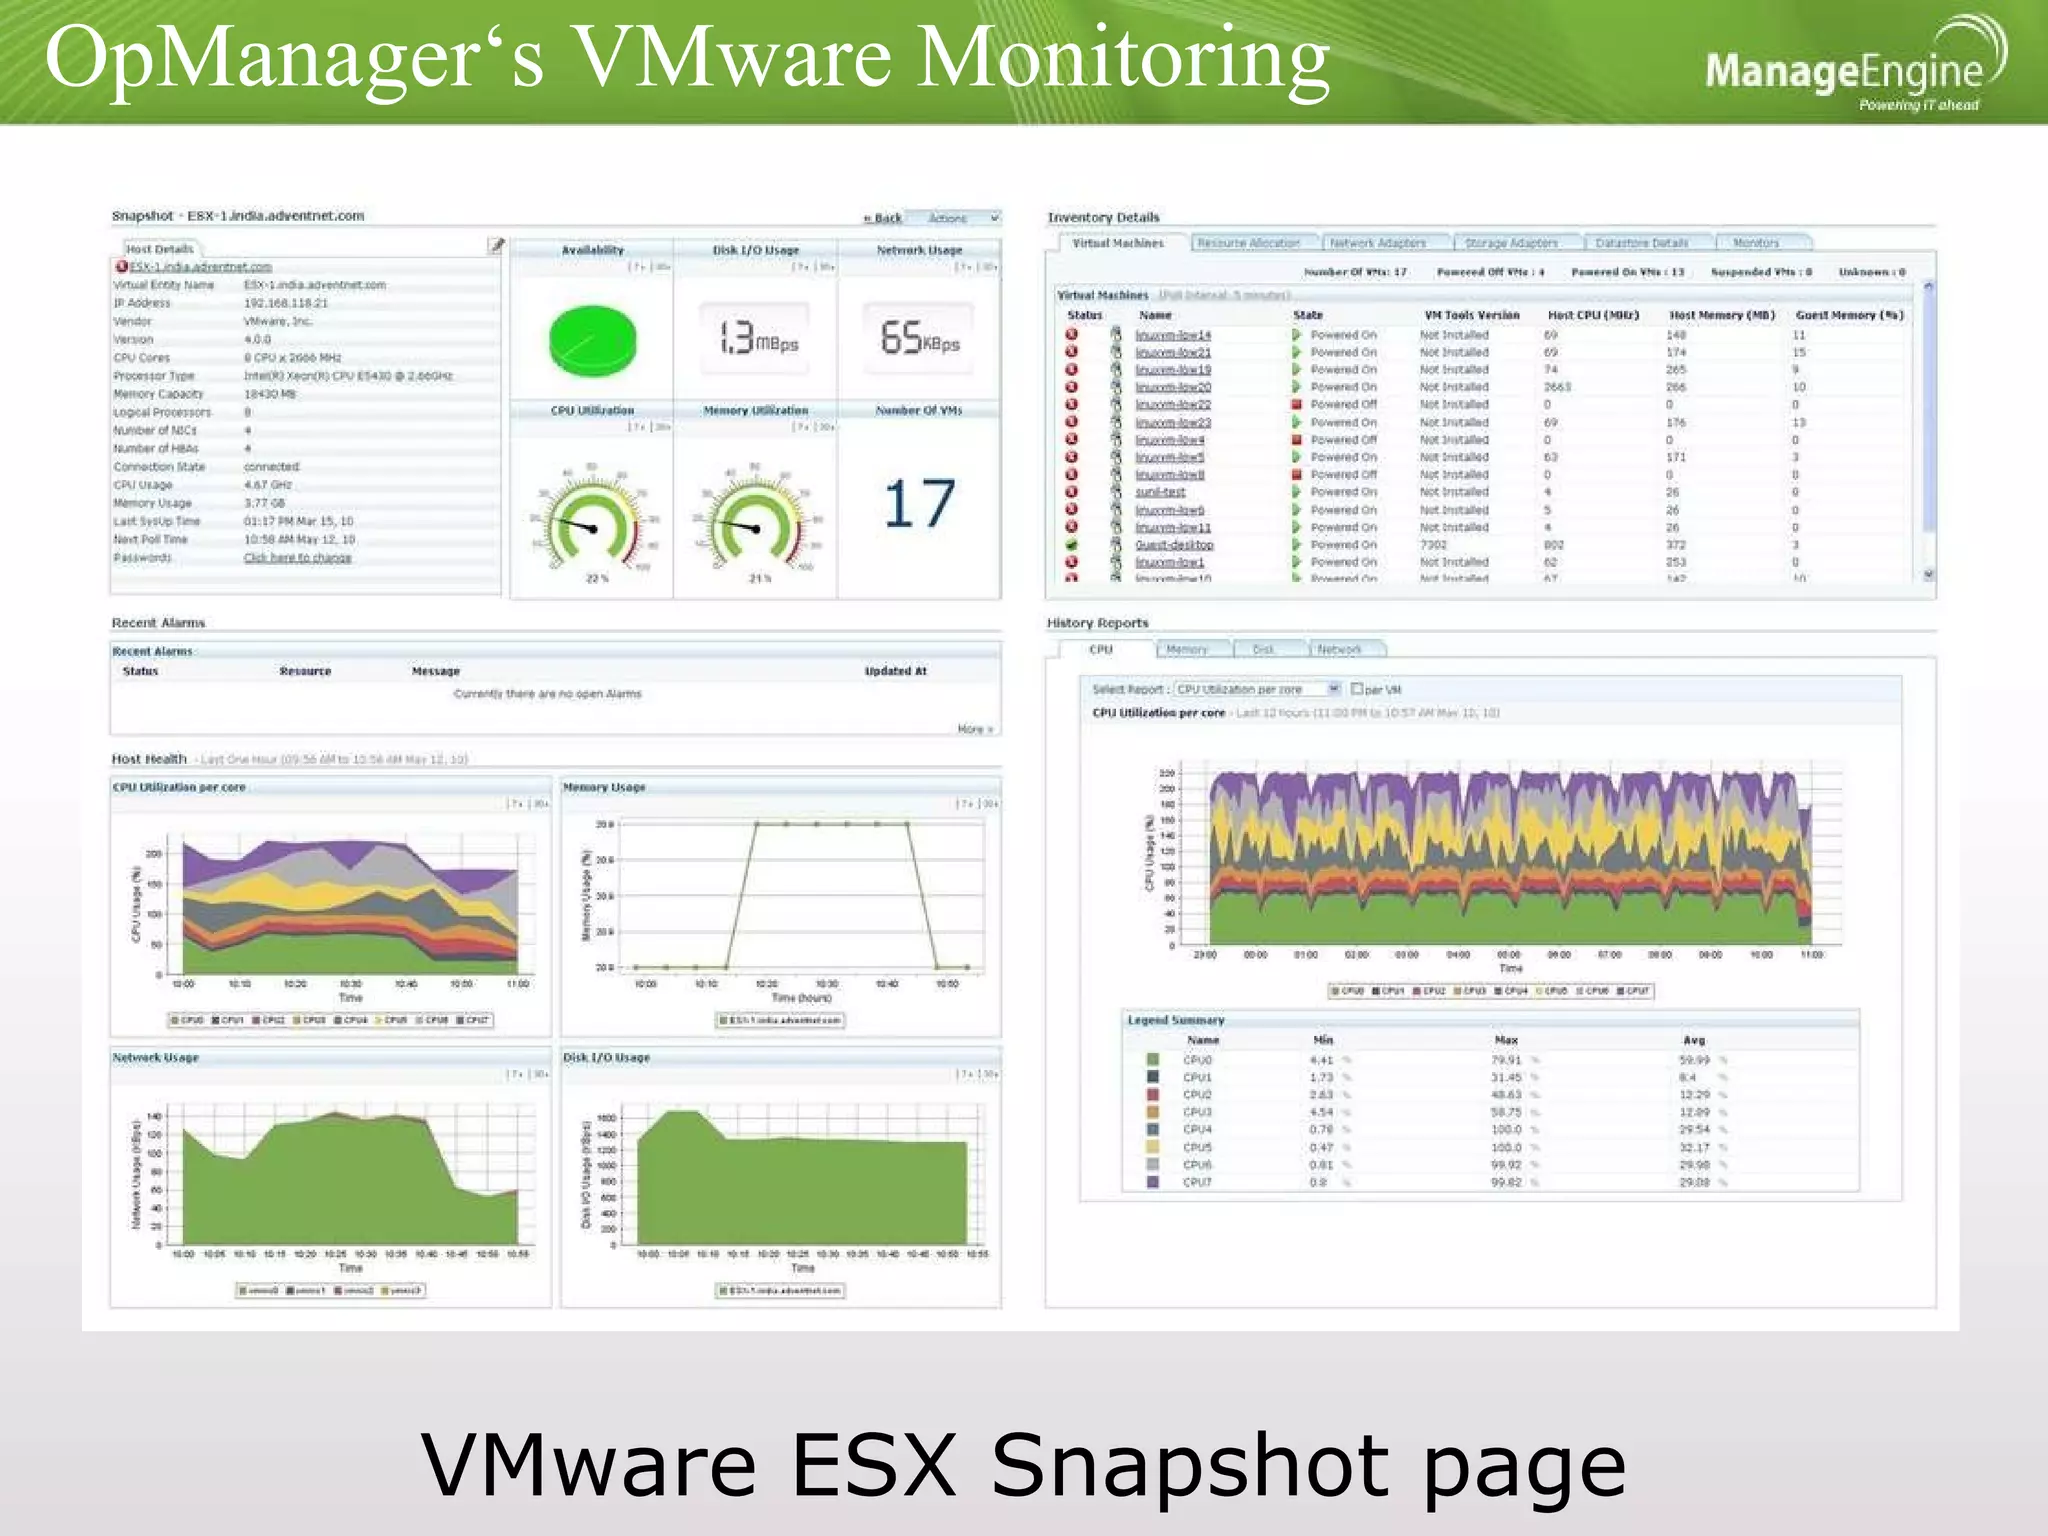
The document discusses VMware performance monitoring essentials, highlighting the benefits and challenges of monitoring virtualized versus physical servers. It emphasizes key performance metrics such as CPU, memory, disk, and network monitoring and provides benchmarks for average and best performing enterprises. Additionally, it outlines OpManager's comprehensive VMware monitoring features, including support for multiple ESX versions and detailed reporting capabilities.


![Vibe Coding vs. Spec-Driven Development [Free Meetup]](https://cdn.slidesharecdn.com/ss_thumbnails/vibecodingvsspecdrivendevelopment-251209105622-43f455e7-thumbnail.jpg?width=640&height=640&fit=bounds)


