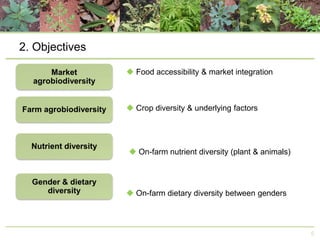
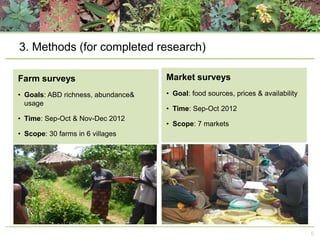
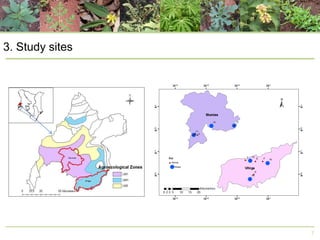
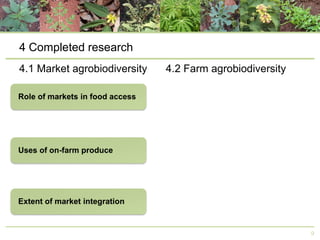
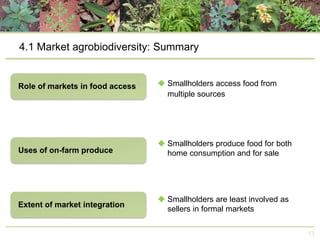
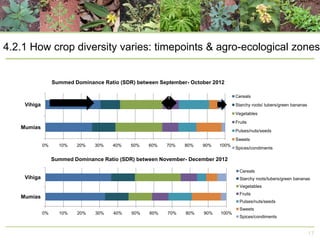
Variety for security: A case study of agricultural,
nutritional and dietary diversity among
smallholder farmers in Western Kenya

Mary Kanui
PhD Candidate
School of Geography & the Environment
University of Oxford

LCIRAH Seminar, 10th January 2014
Outline
1.
2.
3.
4.

Background
Objectives
Methods
Completed research: results
4.1 Market agrobiodiversity (3 points)
4.2 Farm agrobiodiversity (2 points)

5. Upcoming research: overview
5.1 On-farm nutrient diversity
5.2 Gender & dietary diversity

6. Conclusions & recommendations

2
1. Agrobiodiversity as a path to household food security?
• Food security: food availability, access, utilization

• Agrobiodiversity: components of biodiversity of relevance to food &
agriculture

• In Africa, up to 80% of agriculture practised by smallholder farmers

• To what extent does agrobiodiversity contribute to food, nutrition &
health?
3
1. Agrobiodiversity-Kenyan context
• Species numbers
– ~35,000 animal, plant and micro-organism species
– 3 sustaining species: maize, wheat, rice (Ekesa, 2009)

• High food shortfalls and malnutrition rate
– Yet local agrobiodiversity under-utilized as primary food security
resource (Frison et al., 2006)

• Western Kenya:
– High agrobiodiversity
– But 50% population below poverty line with high malnutrition and poor
health (Abukutsa-Onyango, 2002)

4
2. Objectives
 Food accessibility & market integration

 Crop diversity & underlying factors

 On-farm nutrient diversity (plant & animals)

 On-farm dietary diversity between genders

5
3. Methods (for completed research)
Farm surveys

Market surveys

• Goals: ABD richness, abundance&
usage

• Goal: food sources, prices & availability

• Time: Sep-Oct & Nov-Dec 2012

• Time: Sep-Oct 2012
• Scope: 7 markets

• Scope: 30 farms in 6 villages

6
3. Study sites

7
4 Completed research
4.1 Market agrobiodiversity

4.2 Farm agrobiodiversity

8
4 Completed research
4.1 Market agrobiodiversity

4.2 Farm agrobiodiversity

9
4.1.1 What is the role of markets in household food access?
Food sources in Mumias district
Food
group

Food sources in Vihiga district

Farm

Market

(%)

Total

Farm

Market

(%)

Family &
friends
(%)

Total

(%)

Family &
friends
(%)

(%)

(%)

39

53

8

100

47

52

1

100

52

23

11

86*

60

9

24

93*

65

25

9

99*

71

22

7

100

33

36

16

85*

47

12

40

99*

76

17

4

97*

81

9

9

99*

13

37

1

51*

28

15

13

56*

75

5

20

100

23

36

17

76*

17

16

0

33*

17

15

11

43*

(%)

10
4.1.2 What are the uses of on-farm produce?
On-farm food use in Mumias district
Food group

On-farm food use in Vihiga district

Home
consumption

Informal
market

Home
consumption

Informal
market

(%)

(%)

(%)

(%)

78

5

17

100

87

77

2

13

92

76

5

15

83

0

73

Formal
market
(%)

Total

Formal
market
(%)

Total

0

0

87

67

0

3

70

96

81

1

3

85

12

95

68

1

3

72

9

9

91

77

4

3

84

30

0

25

55

27

0

23

50

0

0

83

83

50

0

0

50

89

0

11

100

33

0

67

100

(%)

(%)

11
4.1.3 What is the extent of smallholder market integration?
• Out of the interviewed market traders:
– 15%: own production
– 10%: primary middlemen
– 75%: secondary middlemen

12
4.1 Market agrobiodiversity: Summary
 Smallholders access food from
multiple sources

 Smallholders produce food for both
home consumption and for sale

 Smallholders are least involved as
sellers in formal markets
13
4 Completed research
4.1 Market agrobiodiversity

4.2 Farm agrobiodiversity

14
4 Completed research
4.1 Market agrobiodiversity

4.2 Farm agrobiodiversity

15
4.2.1 Farm agrobiodiversity: most common plant species

Brassica
oleracea

Vigna
unguiculata

Zea mays

Vegetables

Sorghum
bicolor

Cereals

Saccharum
officinarum L.

Persea
americana

Sweets

Ipomoea
batatas
Starchy roots

Musa
sapientum

Fruits

Capsicum
annum
Spices

Phaseolus
vulgaris
Pulses

Arachis
hypogaea
16
4.2.1 How crop diversity varies: timepoints & agro-ecological zones

Summed Dominance Ratio (SDR) between September- October 2012
Cereals

Vihiga

Starchy roots/ tubers/green bananas
Vegetables
Fruits

Mumias

Pulses/nuts/seeds

Sweets
0%

10%

20%

30%

40%

50%

60%

70%

80%

90%

100%

Spices/condiments

Summed Dominance Ratio (SDR) between November- December 2012
Cereals

Vihiga

Starchy roots/tubers/green bananas
Vegetables
Fruits

Mumias

Pulses/nuts/seeds
0%

10%

20%

30%

40%

50%

60%

70%

80%

90%

100%

Sweets
Spices/condiments

17
4.2.2 Factors influencing species richness
• Stepwise multiple regression analysis
• Positively influenced:
– Age of household heads

• Negatively influenced:
– Migration of either husband or wife

Independent variables significant at p<0.05 , with standardized beta coefficient (with non-standardized beta coefficient in
brackets) as:1 0.513(0.354), 2 -0.422 (-5.415)

18
4.2 Farm agrobiodiversity: Summary

 Importance of some food groups varies with agro-ecological zones

 Species richness is influenced by socioeconomic factors

19
5 Upcoming research
5.1 On-farm nutrient diversity

5.2 Gender & dietary diversity

20
5 Upcoming research
5.1 On-farm nutrient diversity

5.2 Gender & dietary diversity

21
5.1 On-farm nutrient diversity
• Species richness explains taxonomic identity, not functional identity
•

Nutritional functional diversity metrics:
– Summarize nutritional diversity of cropping systems

• Previous studies:
– Presence/absence-based functional diversity metric (Remans et al., 2011, DeClerck
et al., 2011)

• Gap on abundance-based functional diversity metric
– Modified Functional Attribute Diversity (MFAD) metric (Schmera et al., 2009)
– To fill gap: available data on crop abundance, livestock diversity and uses,
income ranges
22
5.1 On-farm nutritional diversity: key questions

 What nutrients are available and what are missing for smallholders
to meet a balanced diet?

 Using market price as proxy for food accessibility, how does food
accessibility compare to income levels?

23
5 Upcoming research
5.1 On-farm nutrient diversity

5.2 Gender & dietary diversity

24
5 Upcoming research
5.1 On-farm nutrient diversity

5.2 Gender & dietary diversity

25
5.2 Gender and dietary diversity
• Households with higher incomes can compensate for reduced onfarm agrobiodiversity....
....but depends on who controls the income

• Subsistence-oriented crops viewed as women’s ‘domestic’ domain

• On-farm cultivation of nutritious foods....
.... doesn’t translate to equal food access for all household members

26
5.2 Gender & dietary diversity: key questions

 How does on-farm crop diversity vary between female and male
headed households?

 Is there a relationship between agricultural and dietary diversity
among these households?

27
6. Conclusions & recommendations
• Diversified food products are required to achieve dietary diversity,
food and nutrition security.

• Smallholder farmers utilize multiple channels to attain household
food security.

• Different food procurement channels need equal consideration in
extension, research and development.

28
Acknowledgements
• Supervisors:

• Sources of funding:
– Tuition funding at Oxford: Rhodes Trust
– Project funding at Bioversity (for completed research):GIZ-BMZ

• Smallholder farmers & market traders
• Local administration & contact persons

29
Thank you
mary.kanui@ouce.ox.ac.uk
30

Variety for Security: agricultural and nutritional diversity in Western Kenya

  • 1.
    Variety for security:A case study of agricultural, nutritional and dietary diversity among smallholder farmers in Western Kenya Mary Kanui PhD Candidate School of Geography & the Environment University of Oxford LCIRAH Seminar, 10th January 2014
  • 2.
    Outline 1. 2. 3. 4. Background Objectives Methods Completed research: results 4.1Market agrobiodiversity (3 points) 4.2 Farm agrobiodiversity (2 points) 5. Upcoming research: overview 5.1 On-farm nutrient diversity 5.2 Gender & dietary diversity 6. Conclusions & recommendations 2
  • 3.
    1. Agrobiodiversity asa path to household food security? • Food security: food availability, access, utilization • Agrobiodiversity: components of biodiversity of relevance to food & agriculture • In Africa, up to 80% of agriculture practised by smallholder farmers • To what extent does agrobiodiversity contribute to food, nutrition & health? 3
  • 4.
    1. Agrobiodiversity-Kenyan context •Species numbers – ~35,000 animal, plant and micro-organism species – 3 sustaining species: maize, wheat, rice (Ekesa, 2009) • High food shortfalls and malnutrition rate – Yet local agrobiodiversity under-utilized as primary food security resource (Frison et al., 2006) • Western Kenya: – High agrobiodiversity – But 50% population below poverty line with high malnutrition and poor health (Abukutsa-Onyango, 2002) 4
  • 5.
    2. Objectives  Foodaccessibility & market integration  Crop diversity & underlying factors  On-farm nutrient diversity (plant & animals)  On-farm dietary diversity between genders 5
  • 6.
    3. Methods (forcompleted research) Farm surveys Market surveys • Goals: ABD richness, abundance& usage • Goal: food sources, prices & availability • Time: Sep-Oct & Nov-Dec 2012 • Time: Sep-Oct 2012 • Scope: 7 markets • Scope: 30 farms in 6 villages 6
  • 7.
  • 8.
    4 Completed research 4.1Market agrobiodiversity 4.2 Farm agrobiodiversity 8
  • 9.
    4 Completed research 4.1Market agrobiodiversity 4.2 Farm agrobiodiversity 9
  • 10.
    4.1.1 What isthe role of markets in household food access? Food sources in Mumias district Food group Food sources in Vihiga district Farm Market (%) Total Farm Market (%) Family & friends (%) Total (%) Family & friends (%) (%) (%) 39 53 8 100 47 52 1 100 52 23 11 86* 60 9 24 93* 65 25 9 99* 71 22 7 100 33 36 16 85* 47 12 40 99* 76 17 4 97* 81 9 9 99* 13 37 1 51* 28 15 13 56* 75 5 20 100 23 36 17 76* 17 16 0 33* 17 15 11 43* (%) 10
  • 11.
    4.1.2 What arethe uses of on-farm produce? On-farm food use in Mumias district Food group On-farm food use in Vihiga district Home consumption Informal market Home consumption Informal market (%) (%) (%) (%) 78 5 17 100 87 77 2 13 92 76 5 15 83 0 73 Formal market (%) Total Formal market (%) Total 0 0 87 67 0 3 70 96 81 1 3 85 12 95 68 1 3 72 9 9 91 77 4 3 84 30 0 25 55 27 0 23 50 0 0 83 83 50 0 0 50 89 0 11 100 33 0 67 100 (%) (%) 11
  • 12.
    4.1.3 What isthe extent of smallholder market integration? • Out of the interviewed market traders: – 15%: own production – 10%: primary middlemen – 75%: secondary middlemen 12
  • 13.
    4.1 Market agrobiodiversity:Summary  Smallholders access food from multiple sources  Smallholders produce food for both home consumption and for sale  Smallholders are least involved as sellers in formal markets 13
  • 14.
    4 Completed research 4.1Market agrobiodiversity 4.2 Farm agrobiodiversity 14
  • 15.
    4 Completed research 4.1Market agrobiodiversity 4.2 Farm agrobiodiversity 15
  • 16.
    4.2.1 Farm agrobiodiversity:most common plant species Brassica oleracea Vigna unguiculata Zea mays Vegetables Sorghum bicolor Cereals Saccharum officinarum L. Persea americana Sweets Ipomoea batatas Starchy roots Musa sapientum Fruits Capsicum annum Spices Phaseolus vulgaris Pulses Arachis hypogaea 16
  • 17.
    4.2.1 How cropdiversity varies: timepoints & agro-ecological zones Summed Dominance Ratio (SDR) between September- October 2012 Cereals Vihiga Starchy roots/ tubers/green bananas Vegetables Fruits Mumias Pulses/nuts/seeds Sweets 0% 10% 20% 30% 40% 50% 60% 70% 80% 90% 100% Spices/condiments Summed Dominance Ratio (SDR) between November- December 2012 Cereals Vihiga Starchy roots/tubers/green bananas Vegetables Fruits Mumias Pulses/nuts/seeds 0% 10% 20% 30% 40% 50% 60% 70% 80% 90% 100% Sweets Spices/condiments 17
  • 18.
    4.2.2 Factors influencingspecies richness • Stepwise multiple regression analysis • Positively influenced: – Age of household heads • Negatively influenced: – Migration of either husband or wife Independent variables significant at p<0.05 , with standardized beta coefficient (with non-standardized beta coefficient in brackets) as:1 0.513(0.354), 2 -0.422 (-5.415) 18
  • 19.
    4.2 Farm agrobiodiversity:Summary  Importance of some food groups varies with agro-ecological zones  Species richness is influenced by socioeconomic factors 19
  • 20.
    5 Upcoming research 5.1On-farm nutrient diversity 5.2 Gender & dietary diversity 20
  • 21.
    5 Upcoming research 5.1On-farm nutrient diversity 5.2 Gender & dietary diversity 21
  • 22.
    5.1 On-farm nutrientdiversity • Species richness explains taxonomic identity, not functional identity • Nutritional functional diversity metrics: – Summarize nutritional diversity of cropping systems • Previous studies: – Presence/absence-based functional diversity metric (Remans et al., 2011, DeClerck et al., 2011) • Gap on abundance-based functional diversity metric – Modified Functional Attribute Diversity (MFAD) metric (Schmera et al., 2009) – To fill gap: available data on crop abundance, livestock diversity and uses, income ranges 22
  • 23.
    5.1 On-farm nutritionaldiversity: key questions  What nutrients are available and what are missing for smallholders to meet a balanced diet?  Using market price as proxy for food accessibility, how does food accessibility compare to income levels? 23
  • 24.
    5 Upcoming research 5.1On-farm nutrient diversity 5.2 Gender & dietary diversity 24
  • 25.
    5 Upcoming research 5.1On-farm nutrient diversity 5.2 Gender & dietary diversity 25
  • 26.
    5.2 Gender anddietary diversity • Households with higher incomes can compensate for reduced onfarm agrobiodiversity.... ....but depends on who controls the income • Subsistence-oriented crops viewed as women’s ‘domestic’ domain • On-farm cultivation of nutritious foods.... .... doesn’t translate to equal food access for all household members 26
  • 27.
    5.2 Gender &dietary diversity: key questions  How does on-farm crop diversity vary between female and male headed households?  Is there a relationship between agricultural and dietary diversity among these households? 27
  • 28.
    6. Conclusions &recommendations • Diversified food products are required to achieve dietary diversity, food and nutrition security. • Smallholder farmers utilize multiple channels to attain household food security. • Different food procurement channels need equal consideration in extension, research and development. 28
  • 29.
    Acknowledgements • Supervisors: • Sourcesof funding: – Tuition funding at Oxford: Rhodes Trust – Project funding at Bioversity (for completed research):GIZ-BMZ • Smallholder farmers & market traders • Local administration & contact persons 29
  • 30.