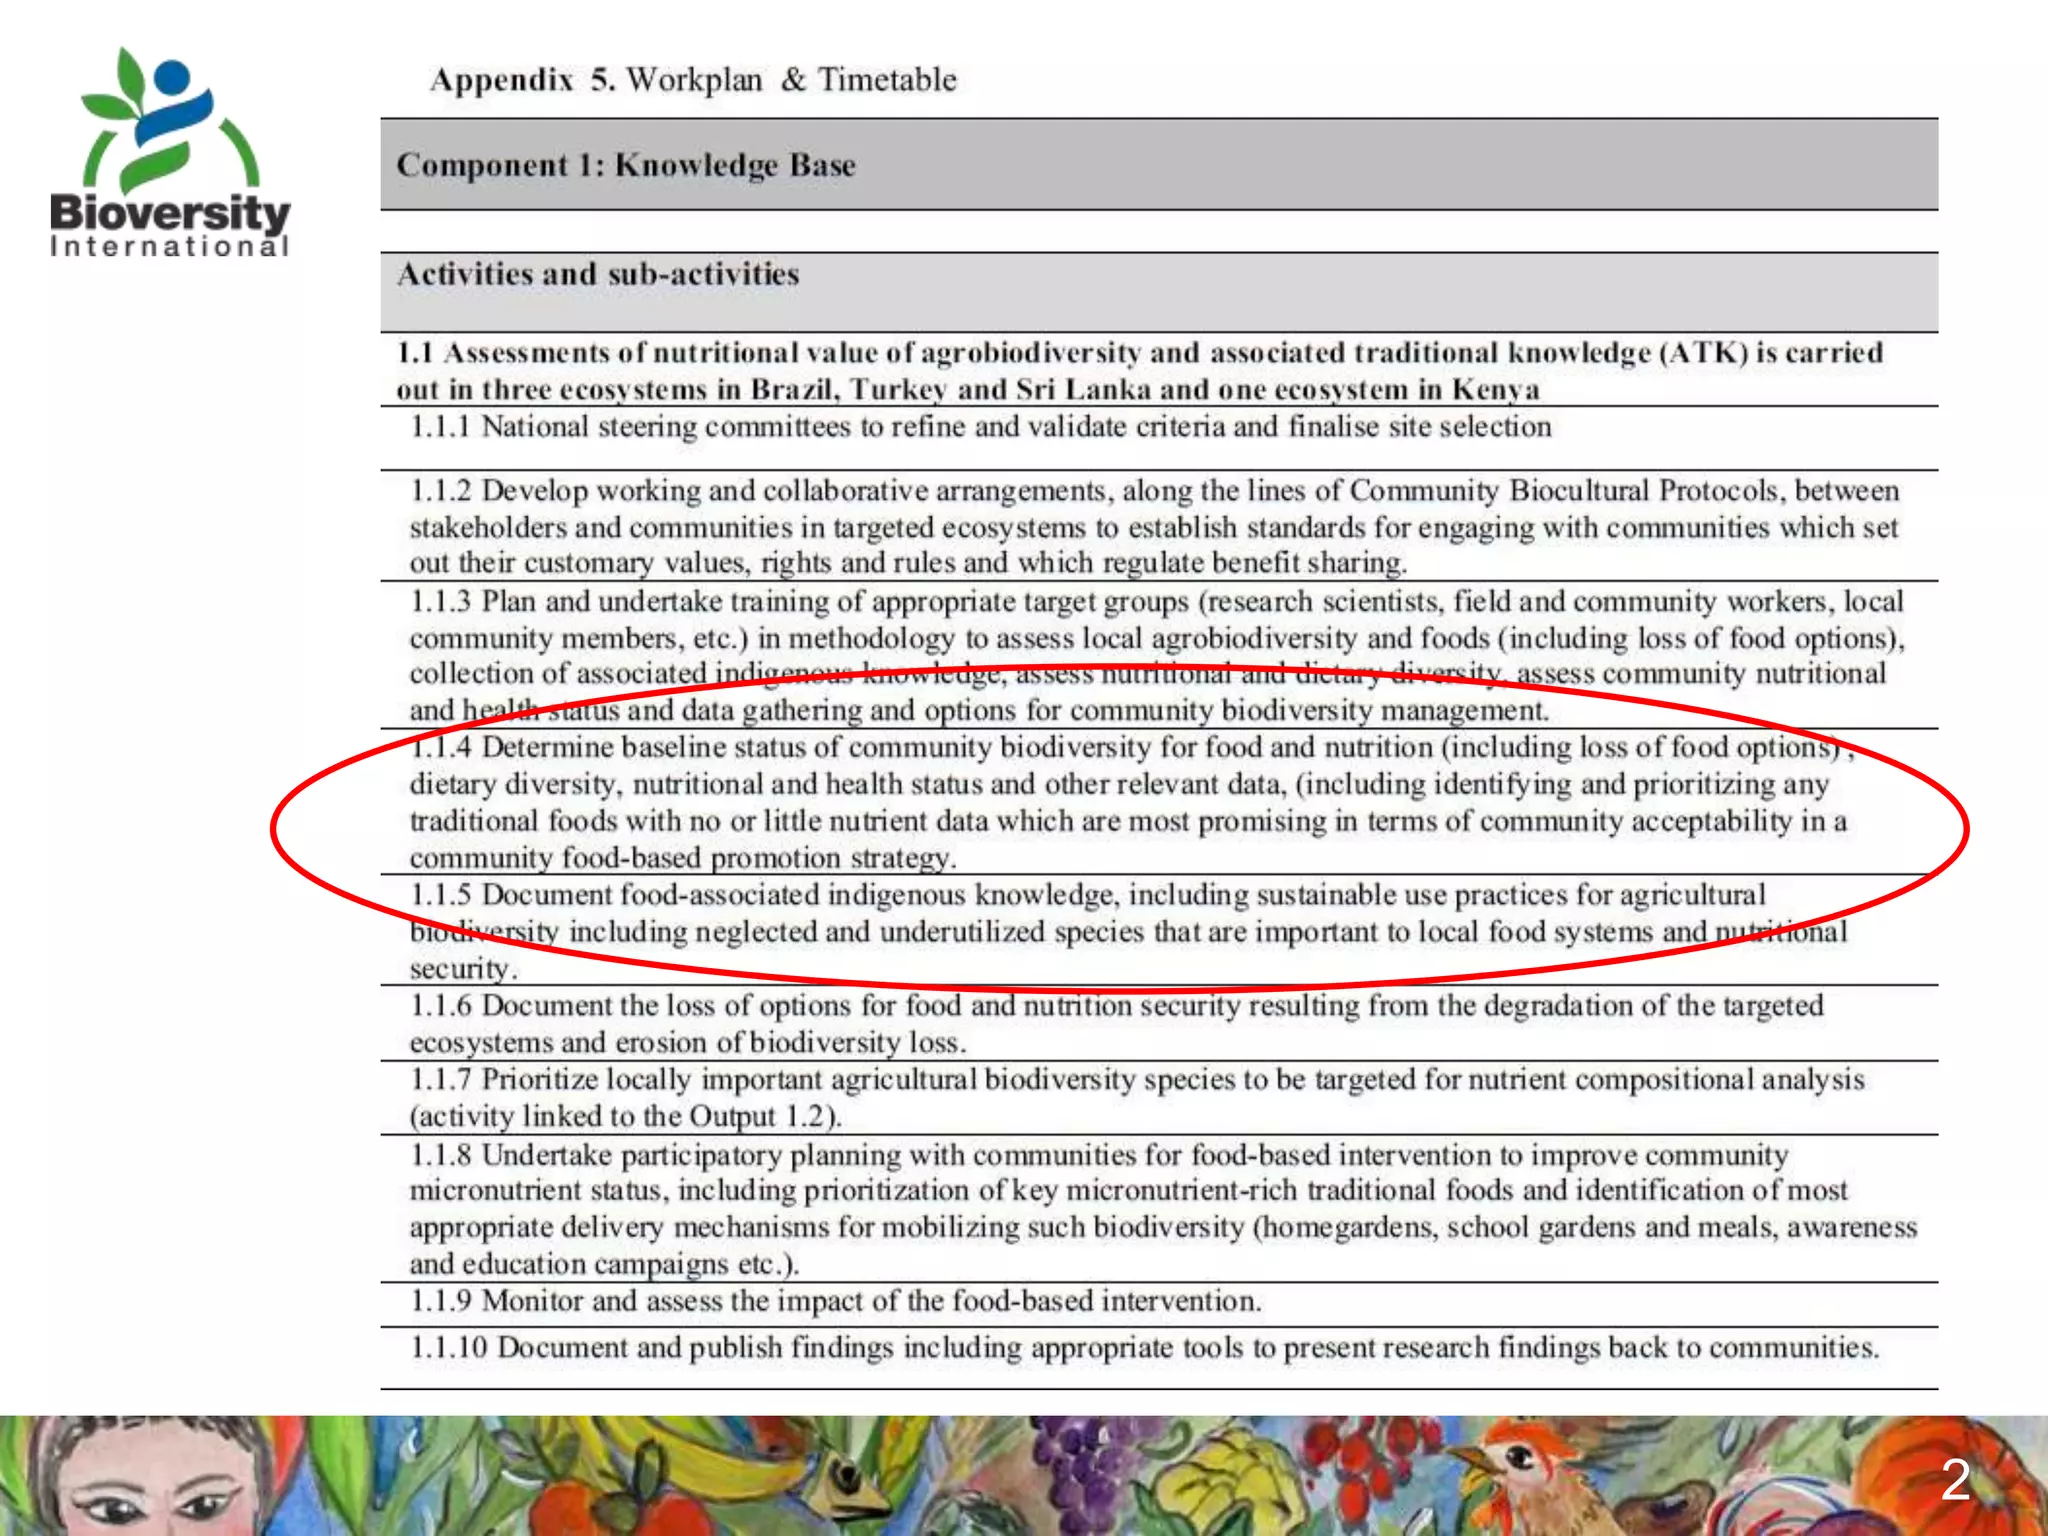
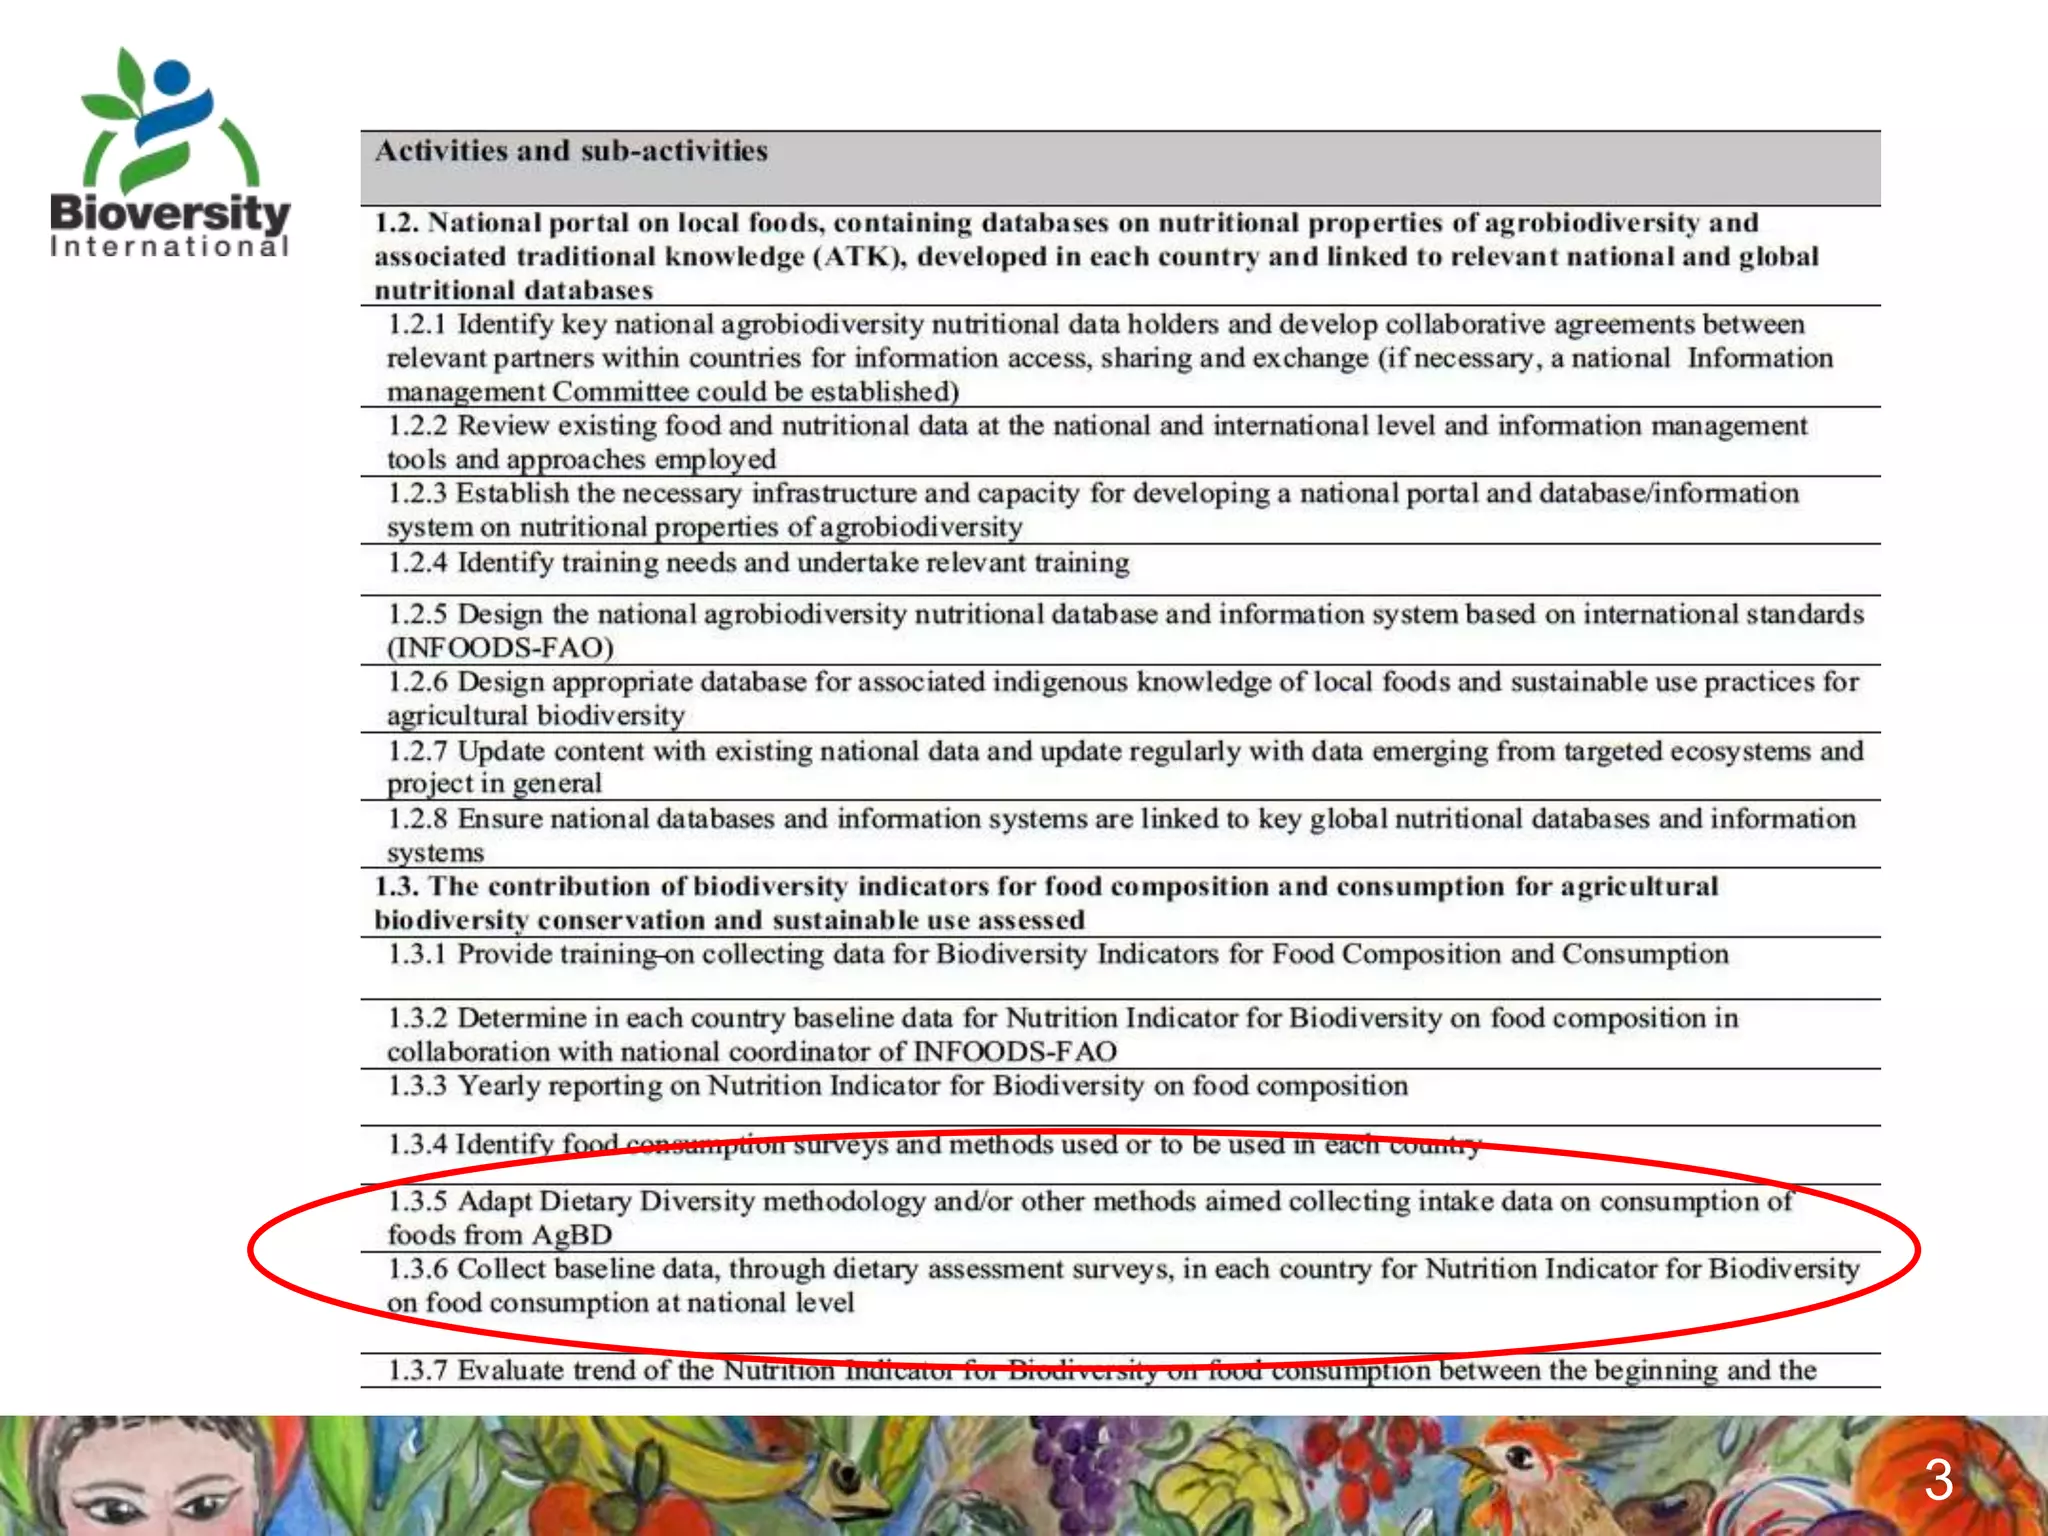
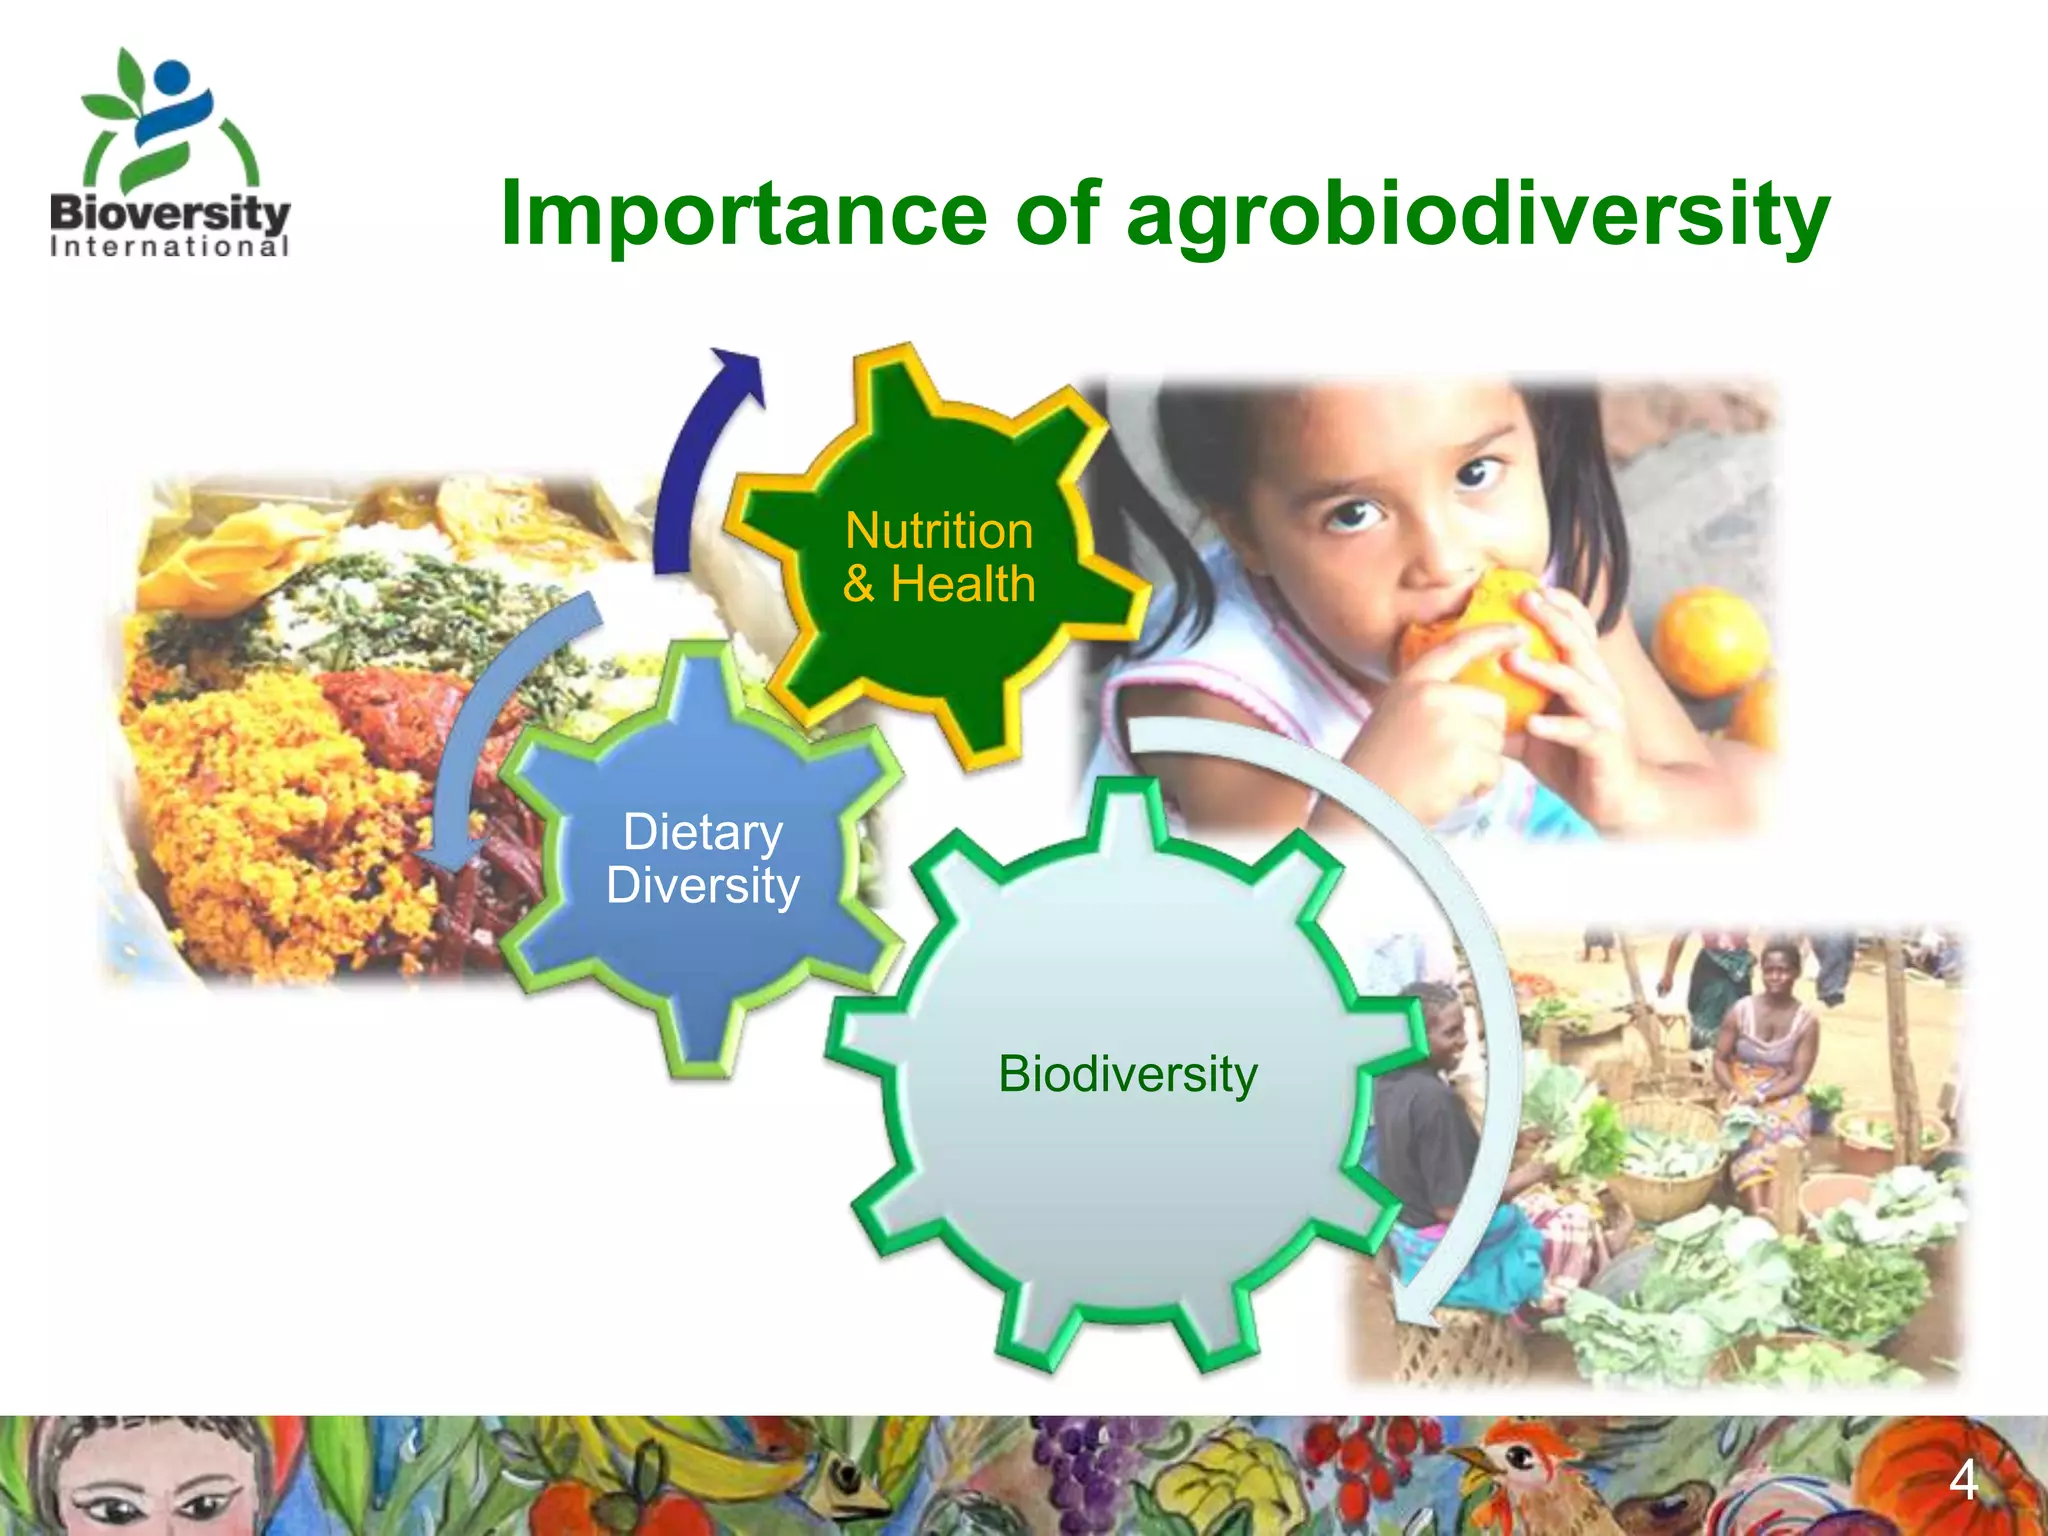
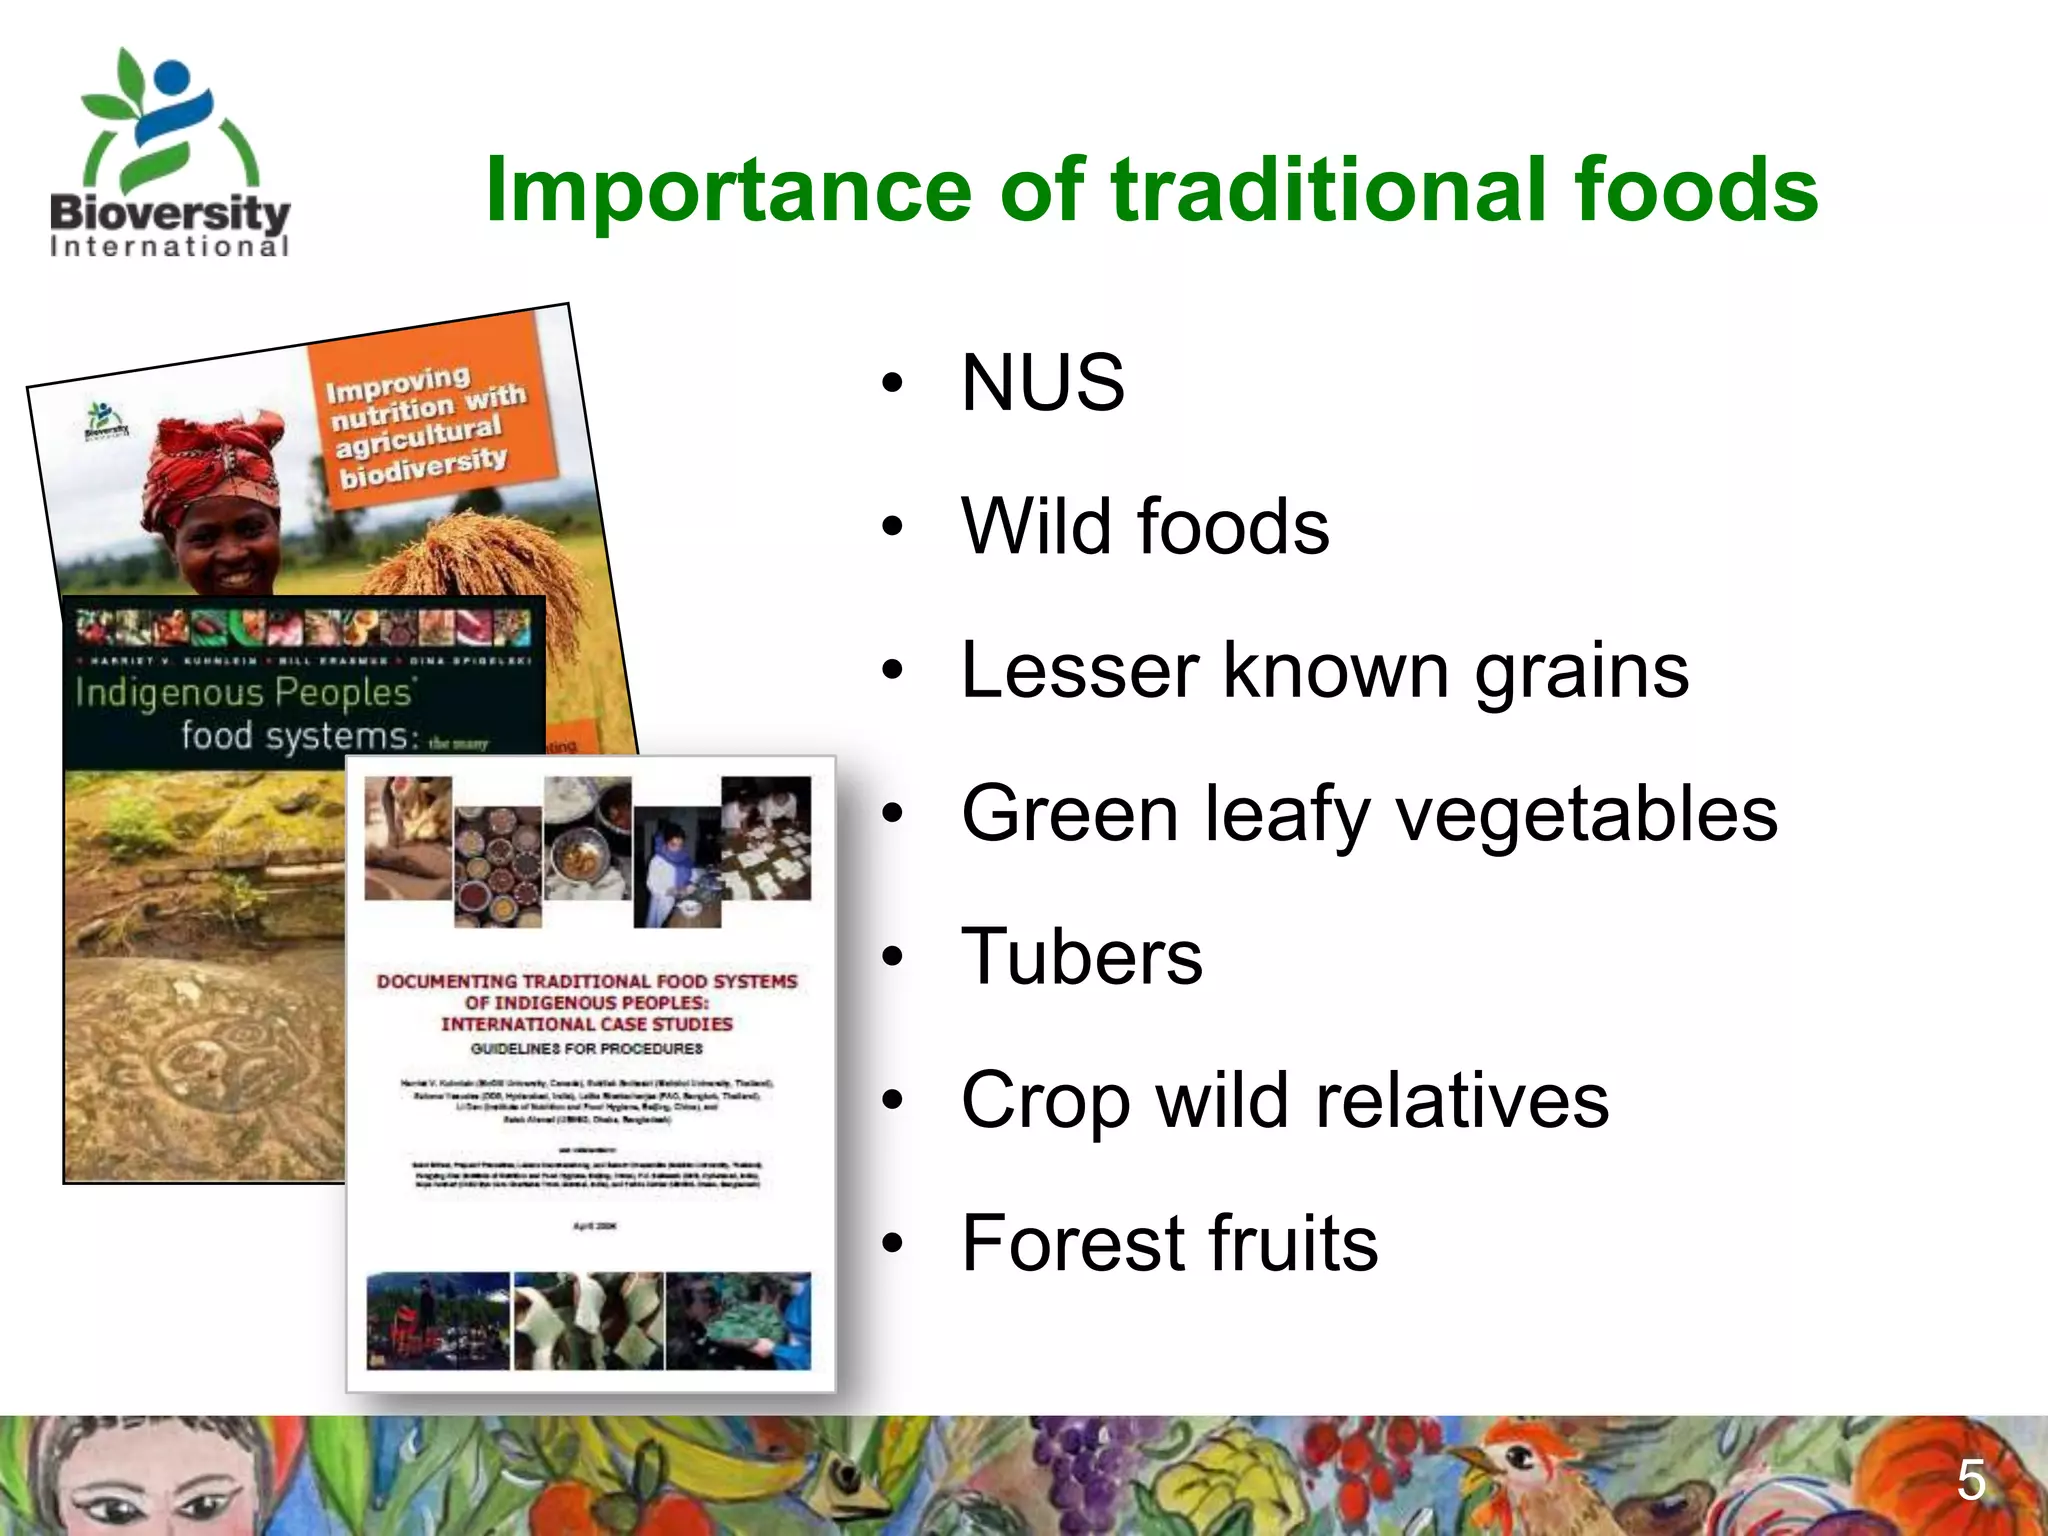
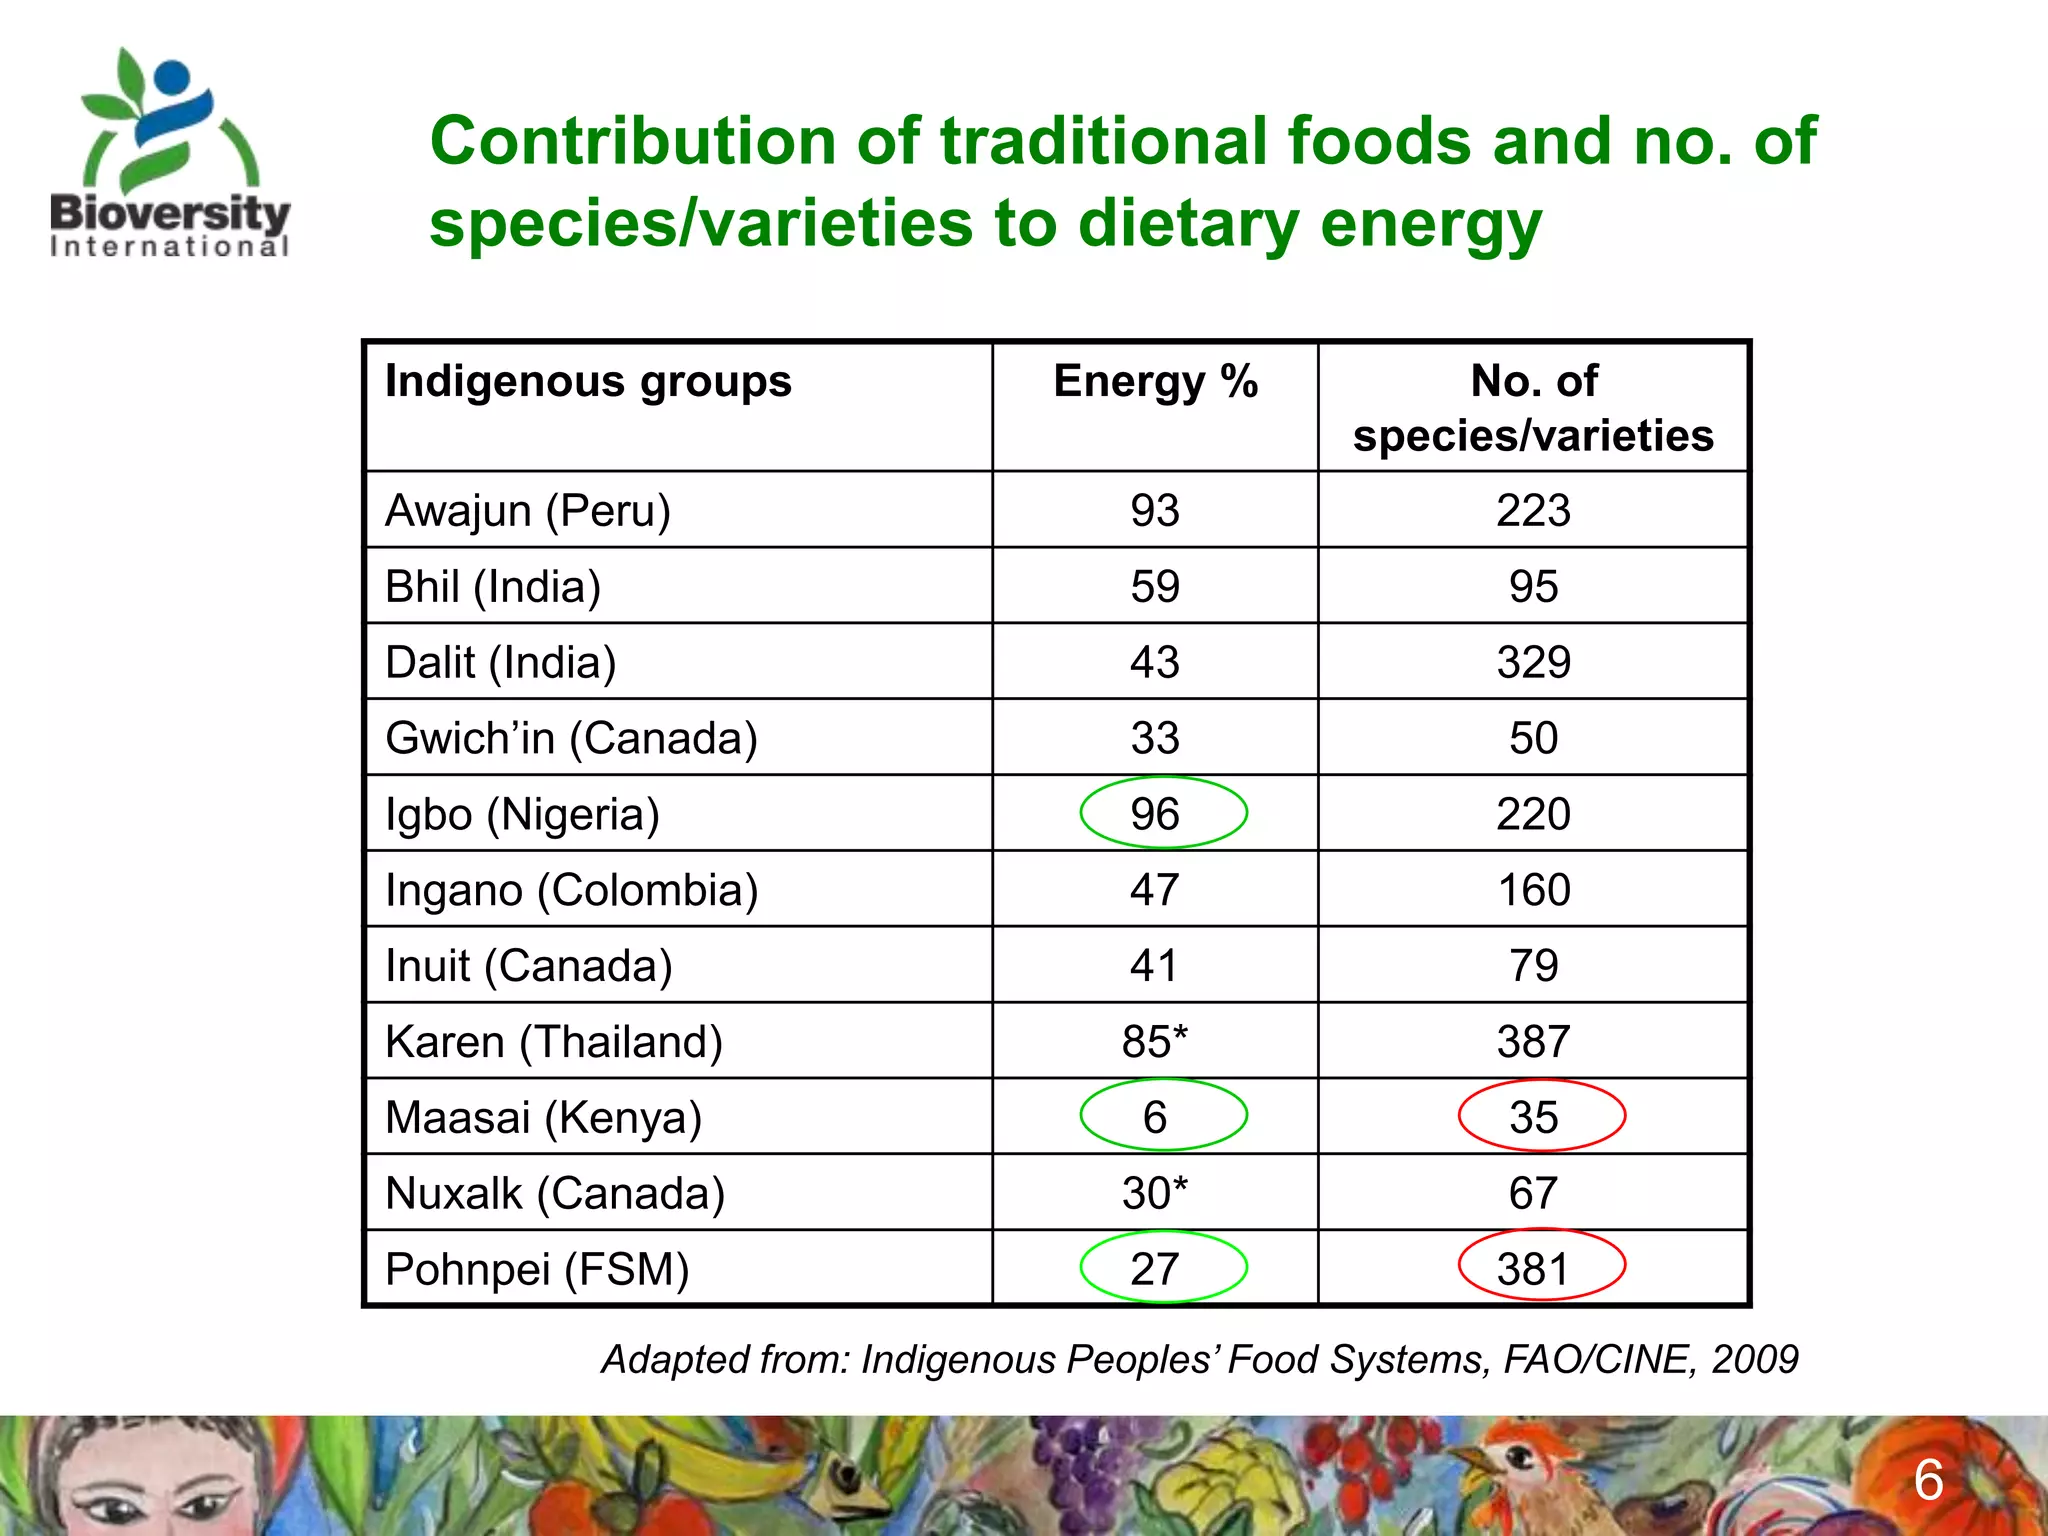
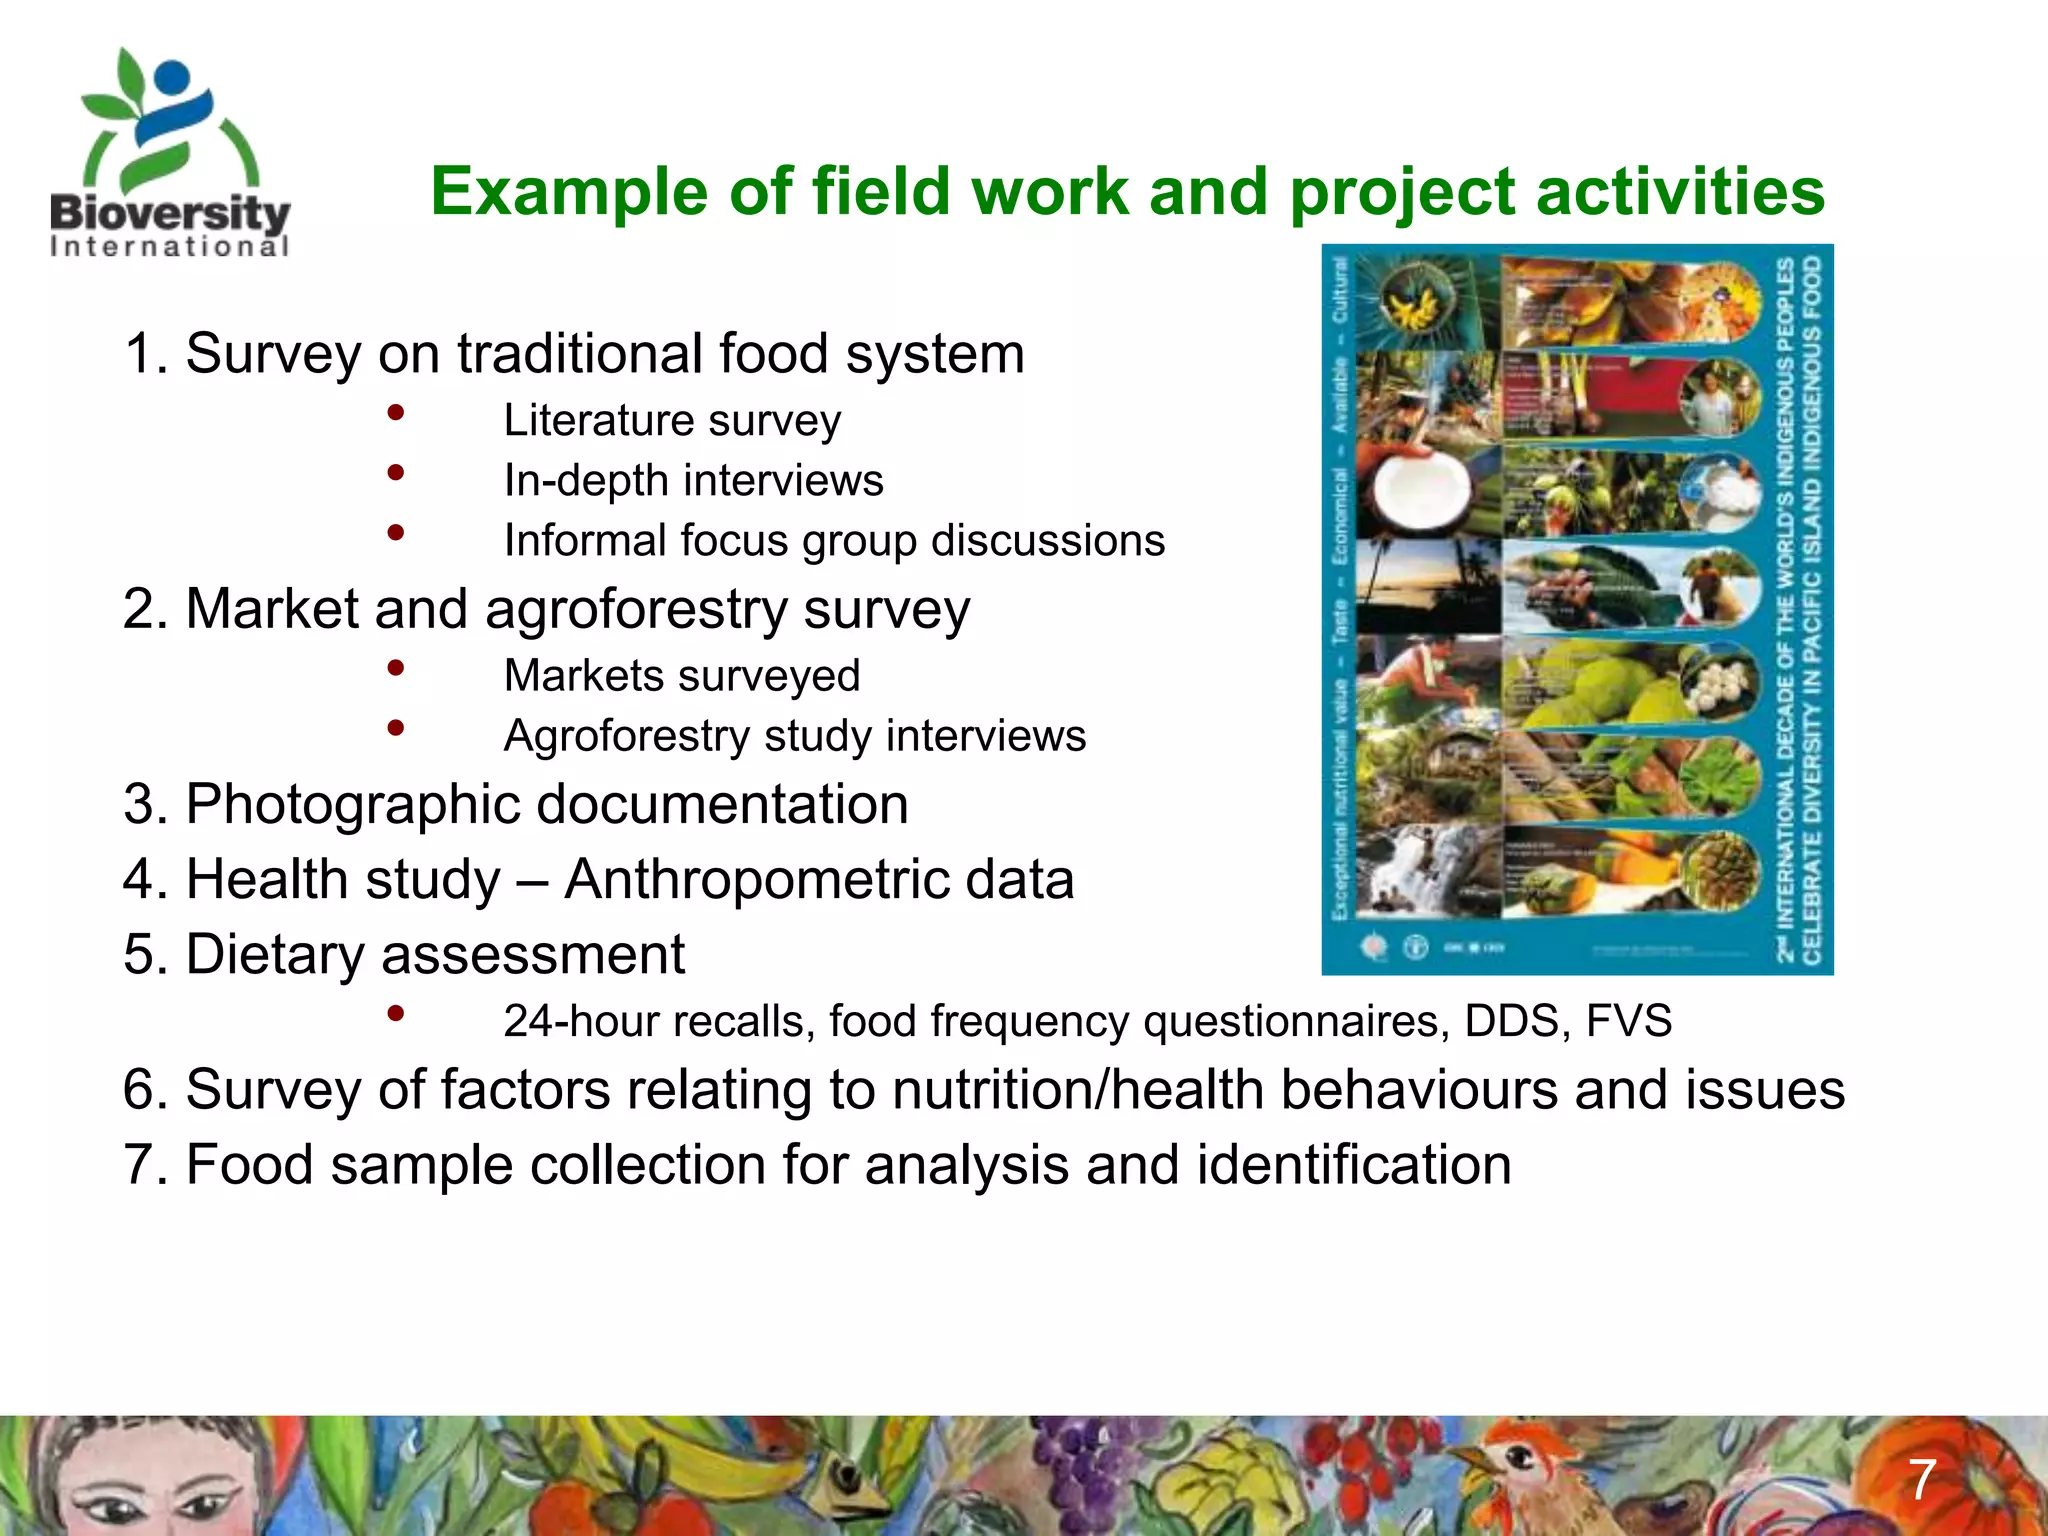
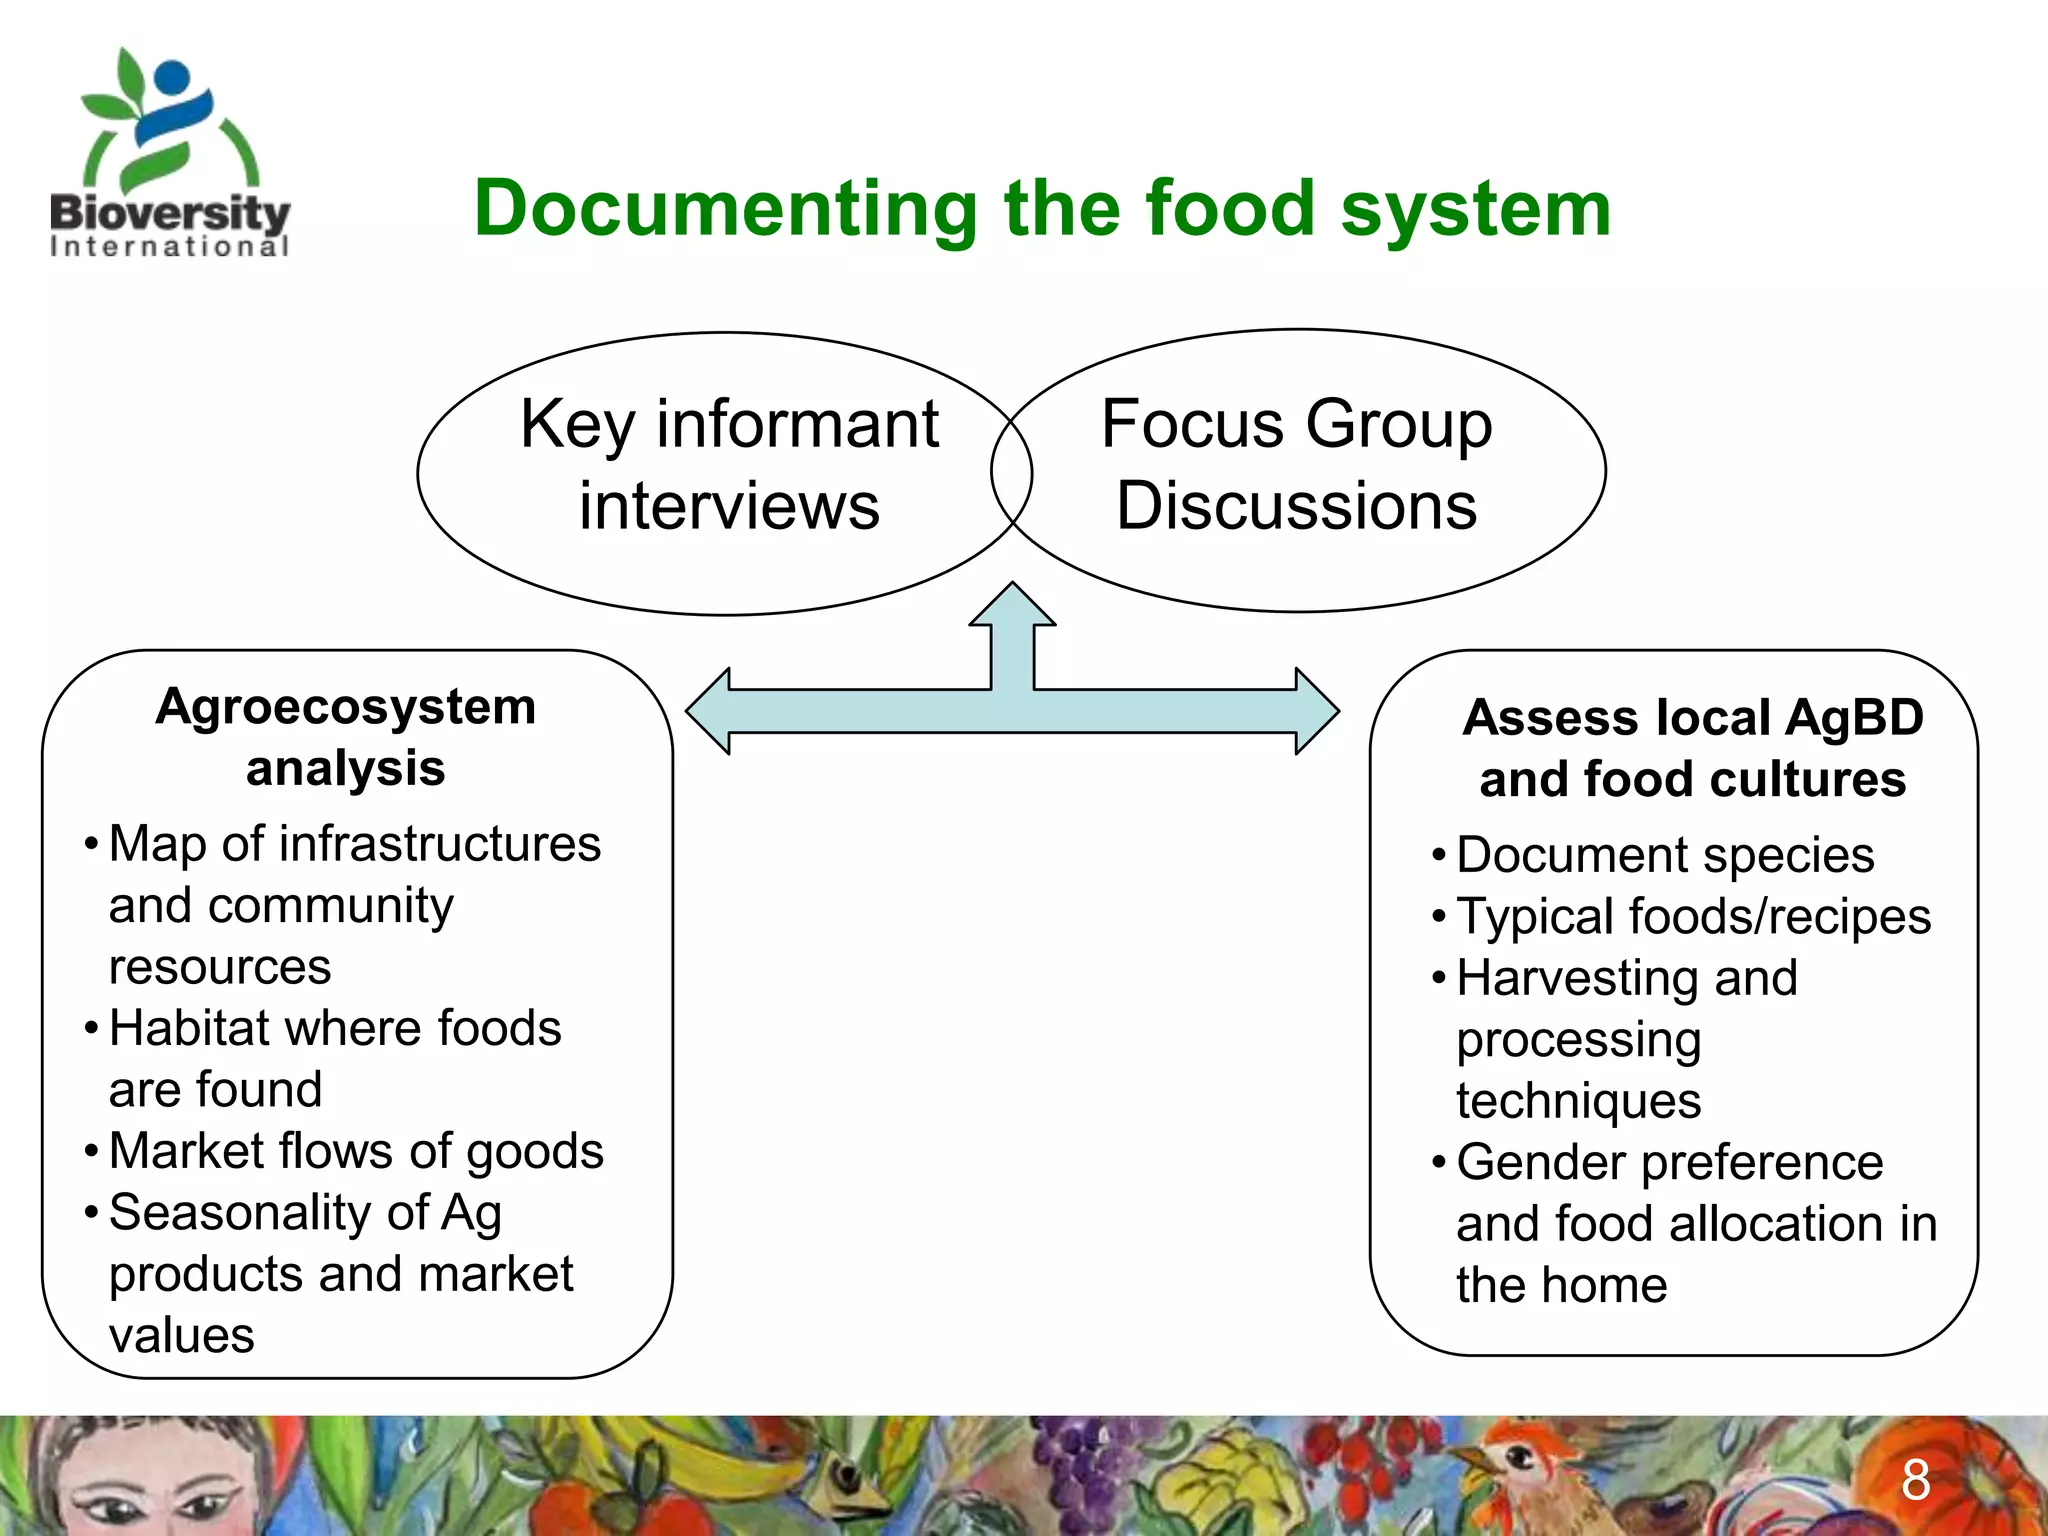
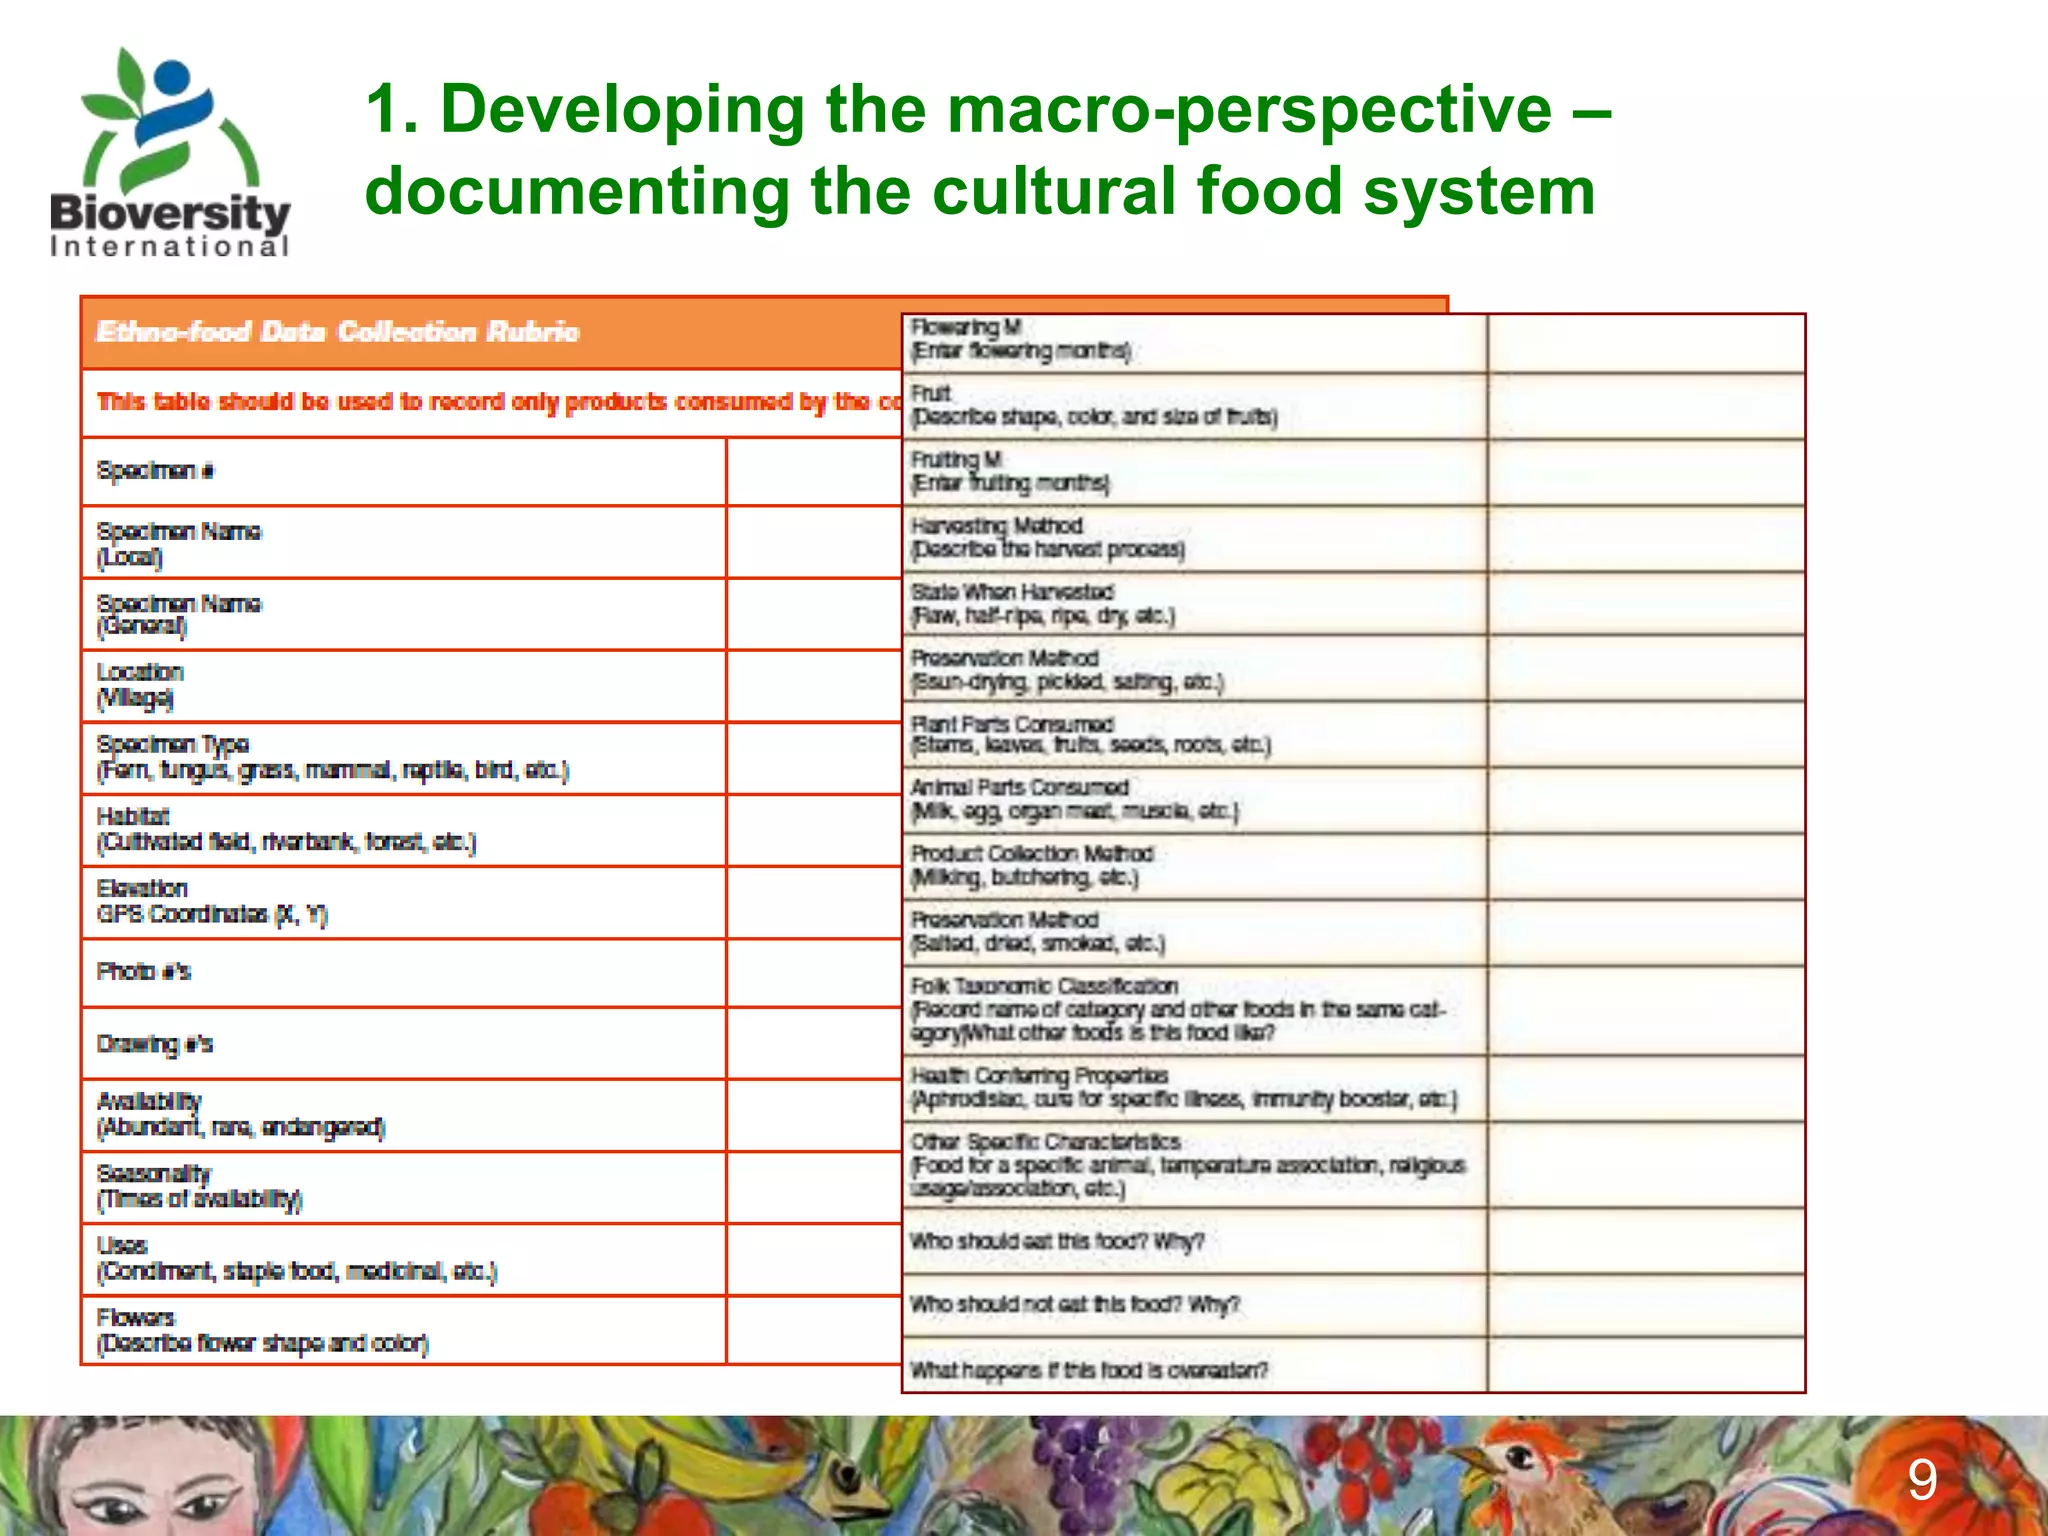
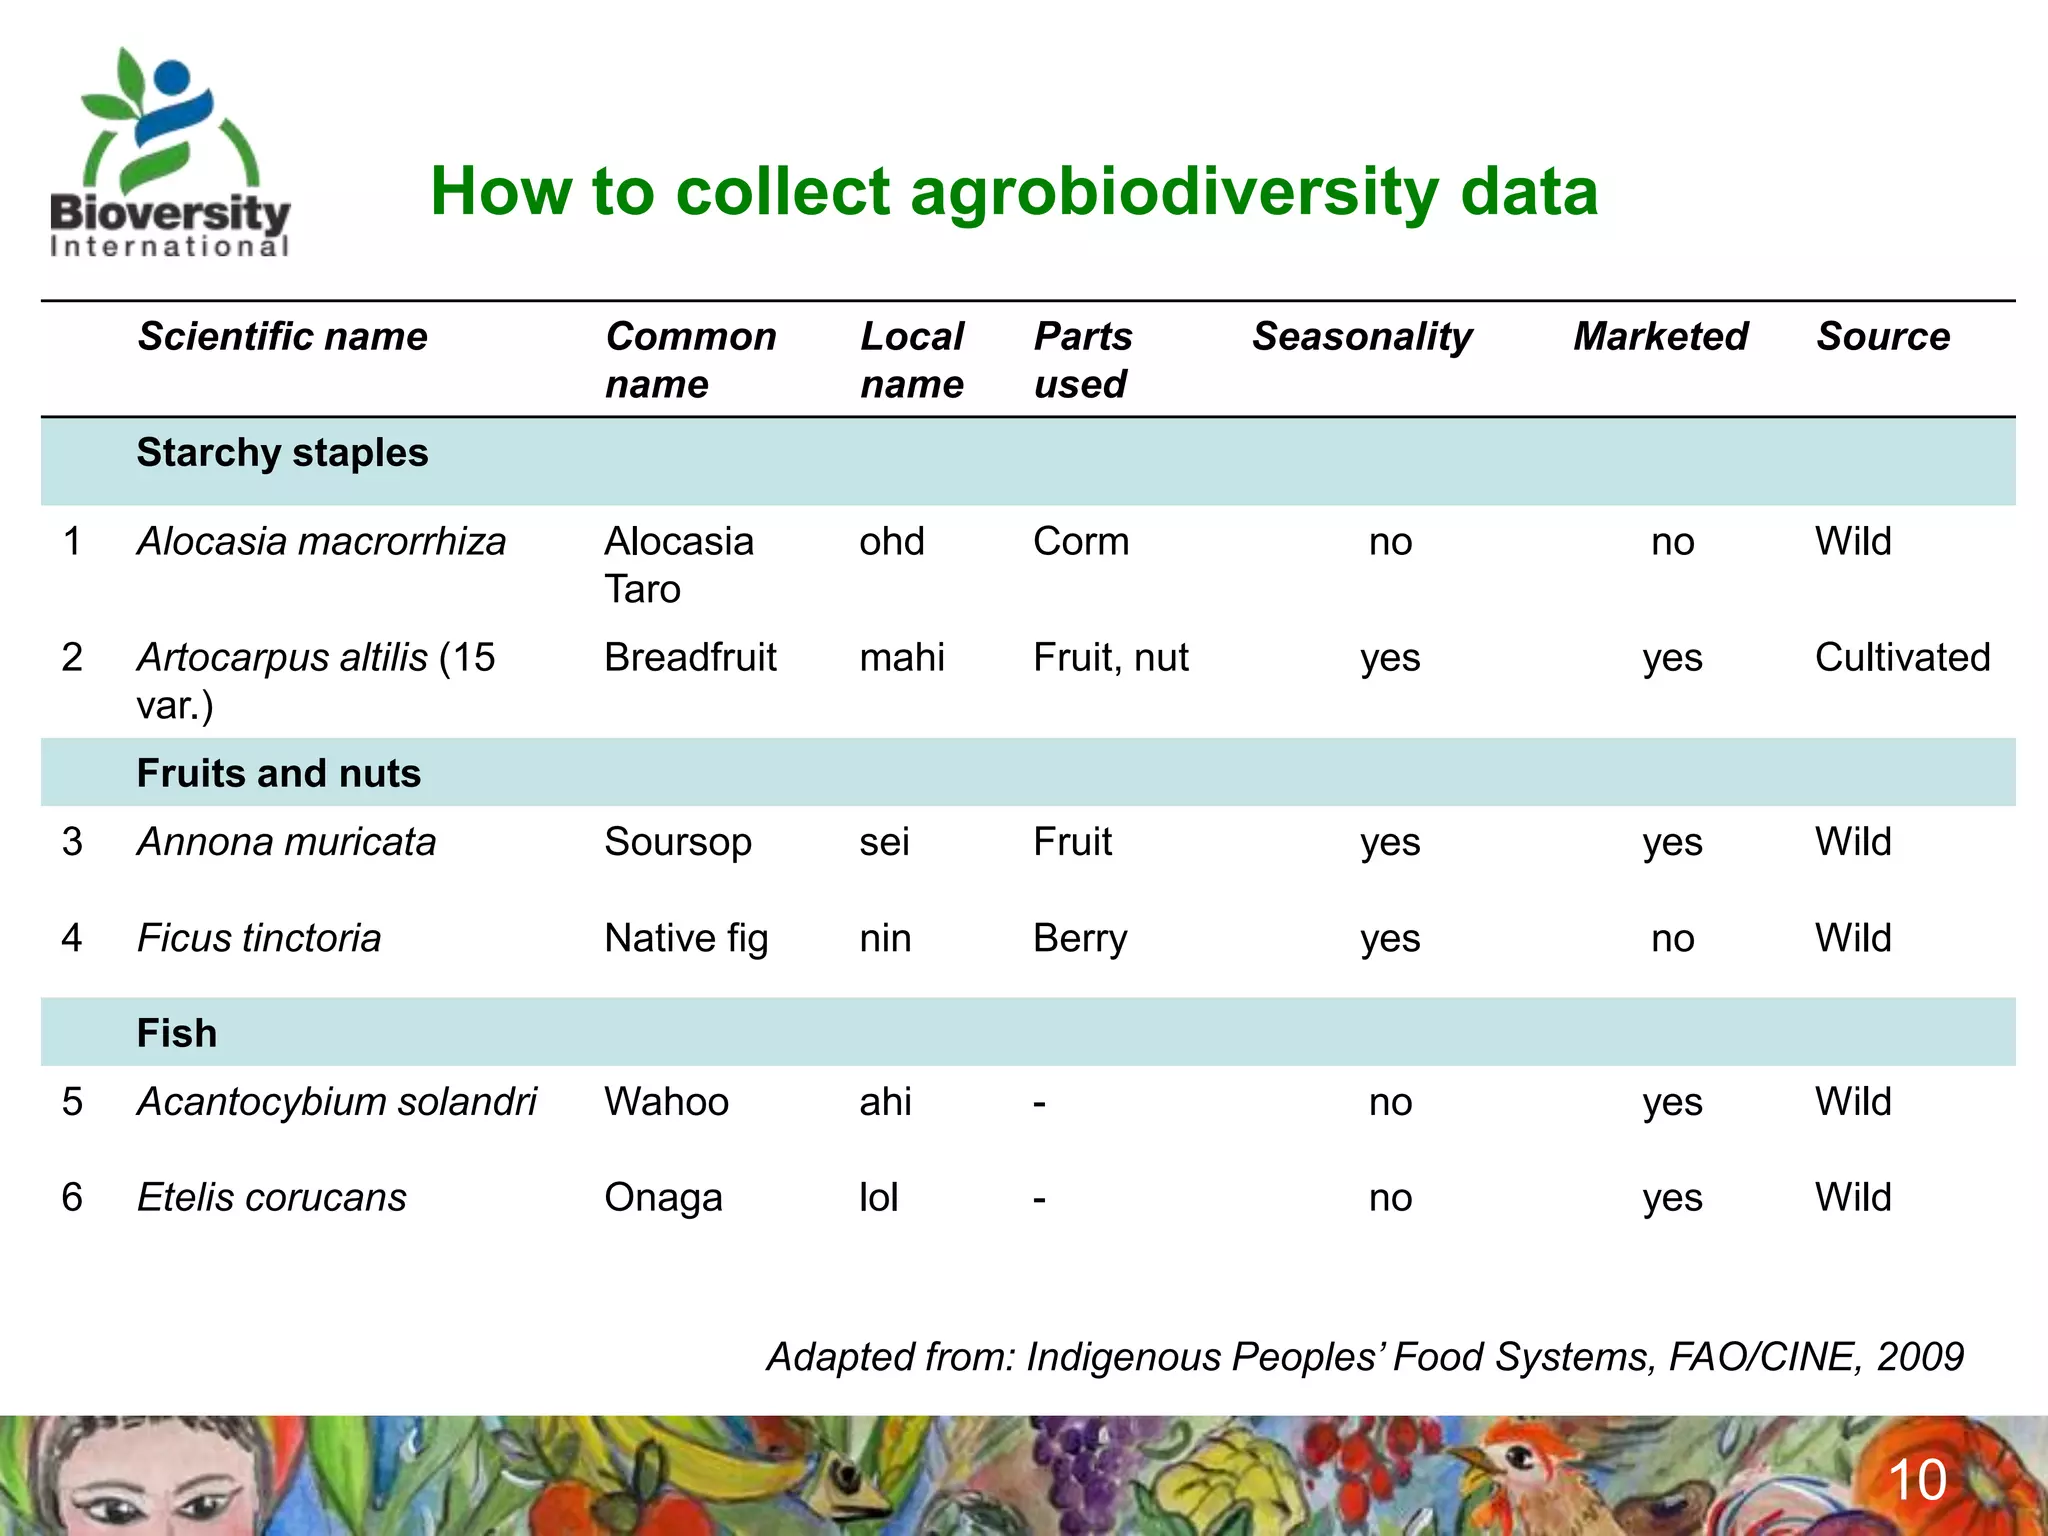
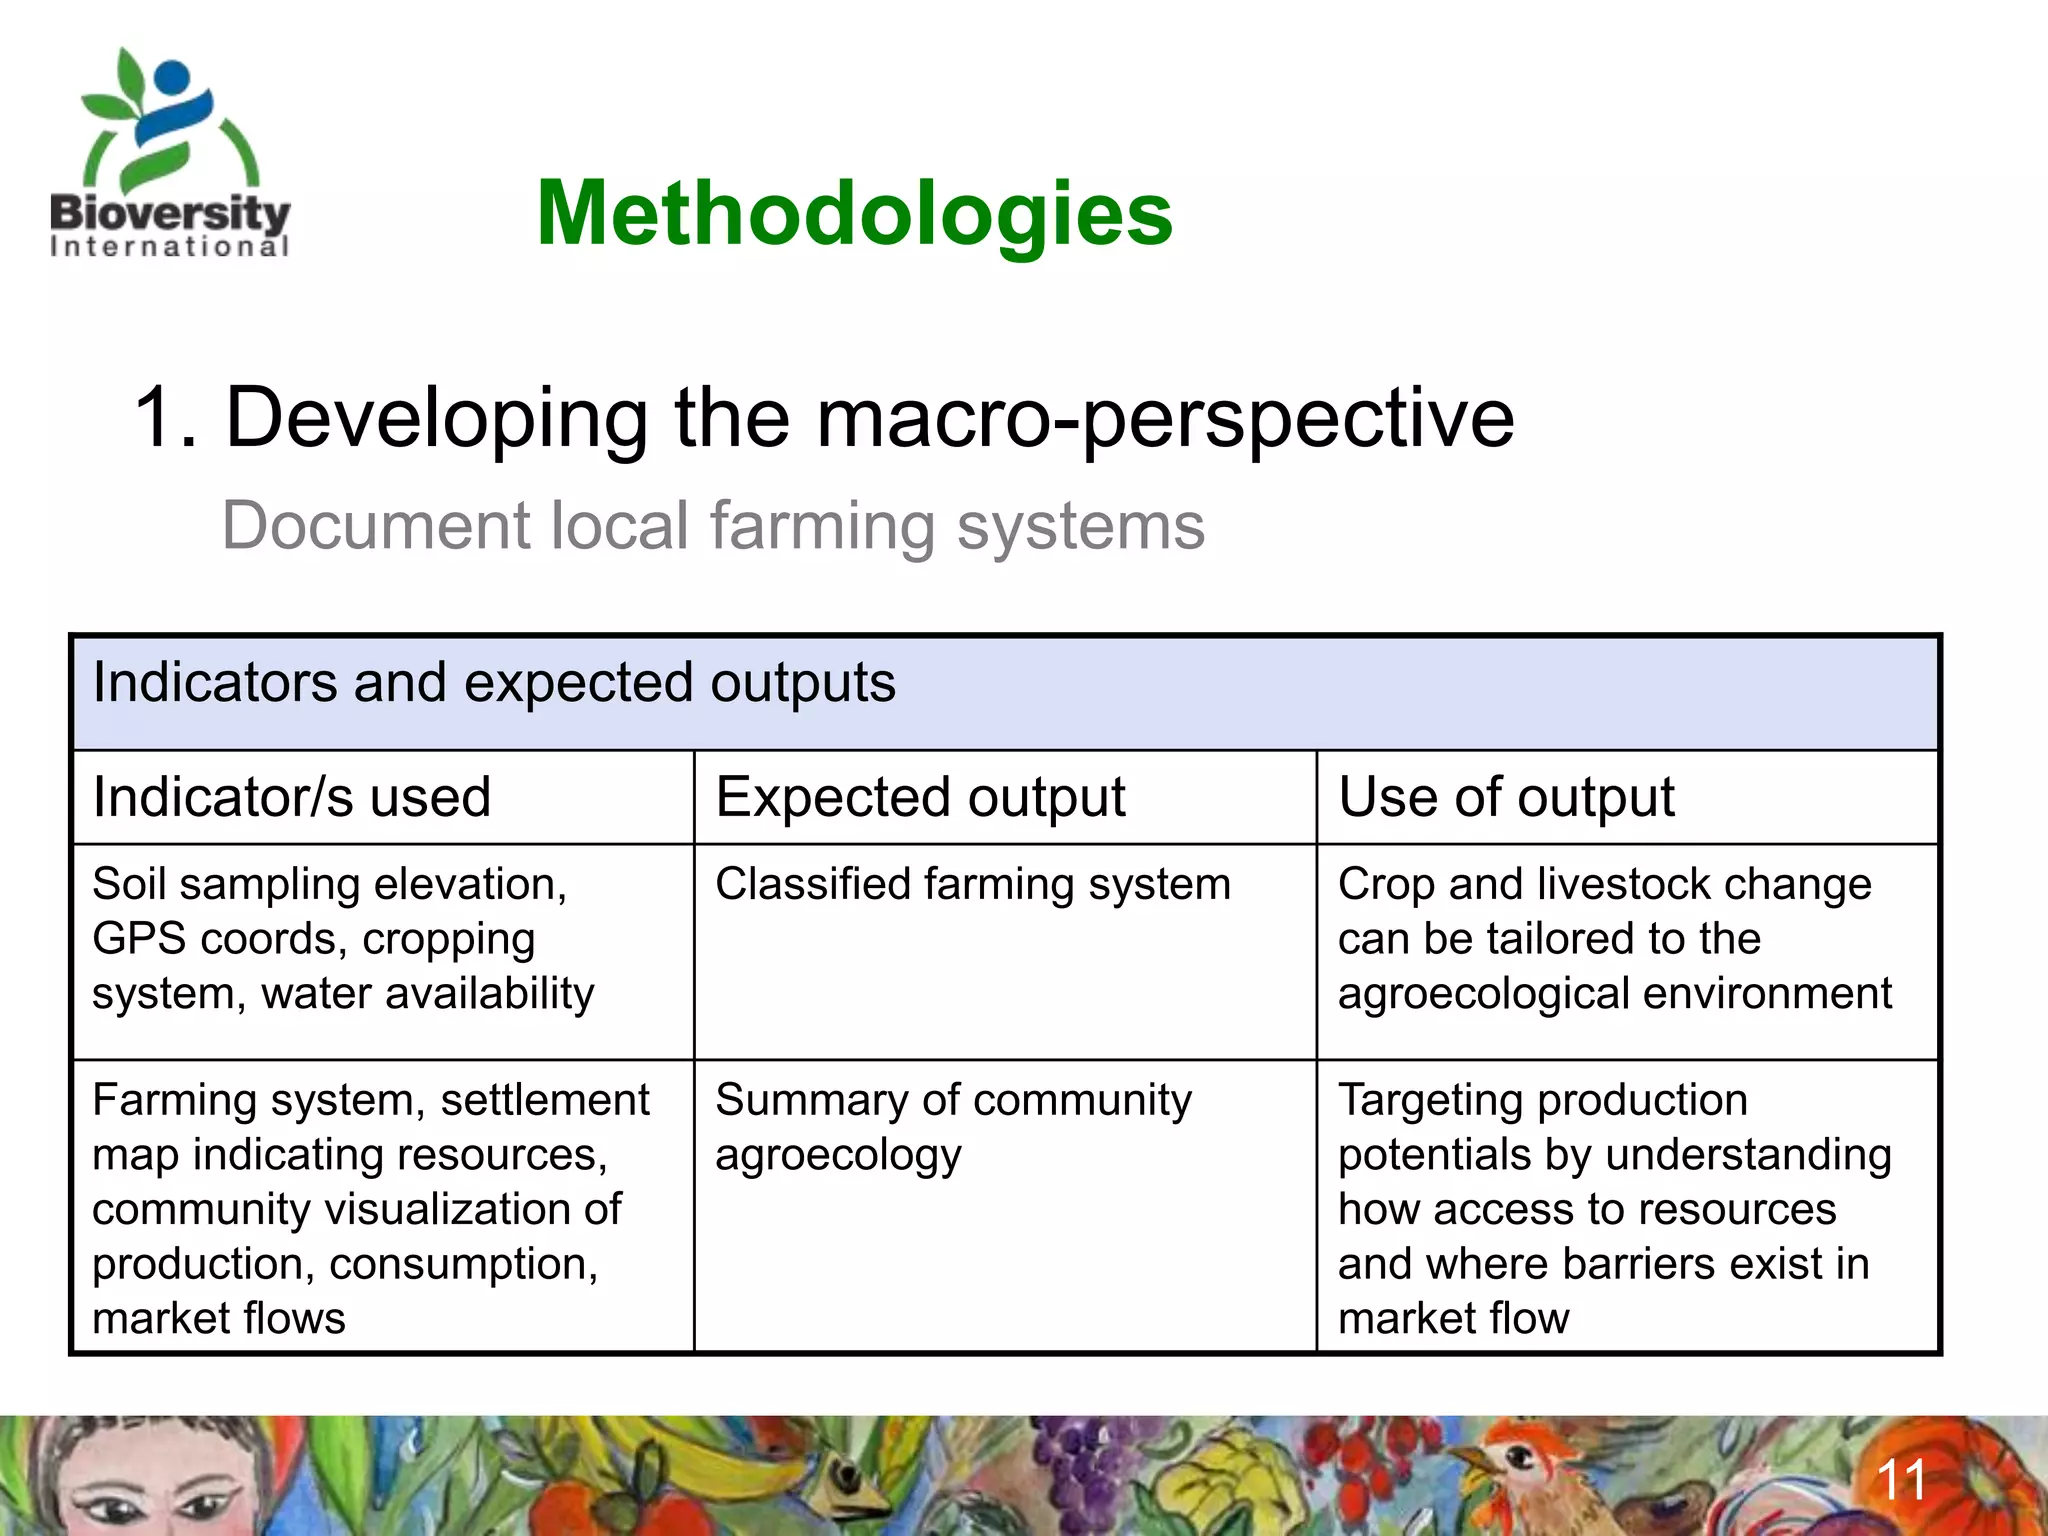
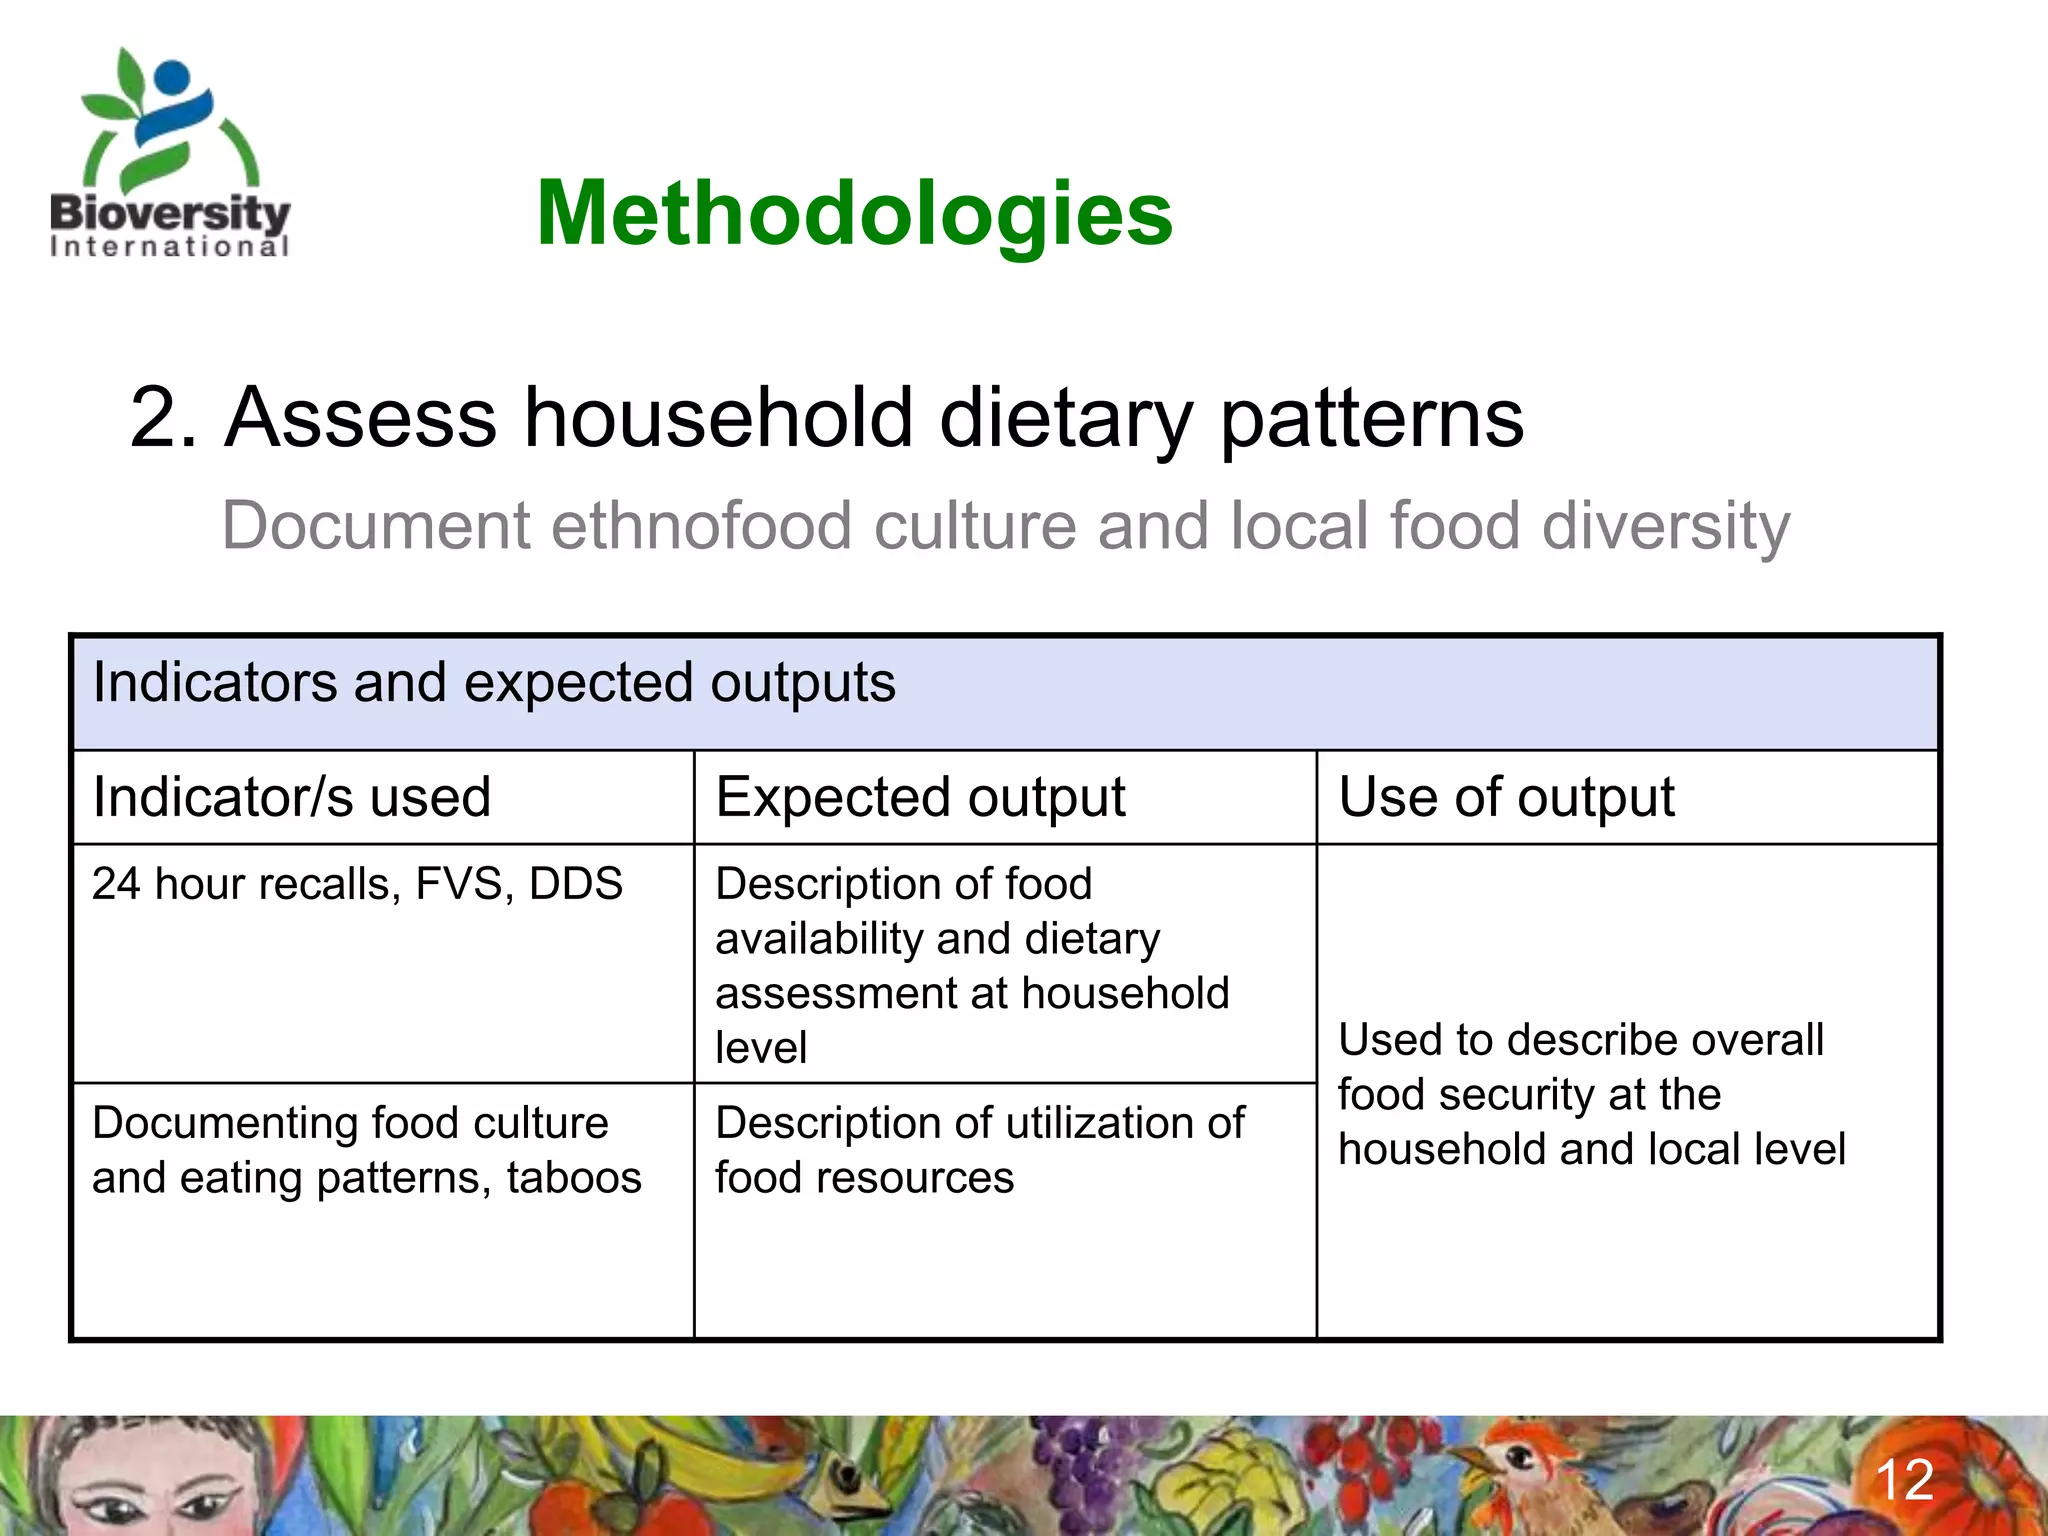
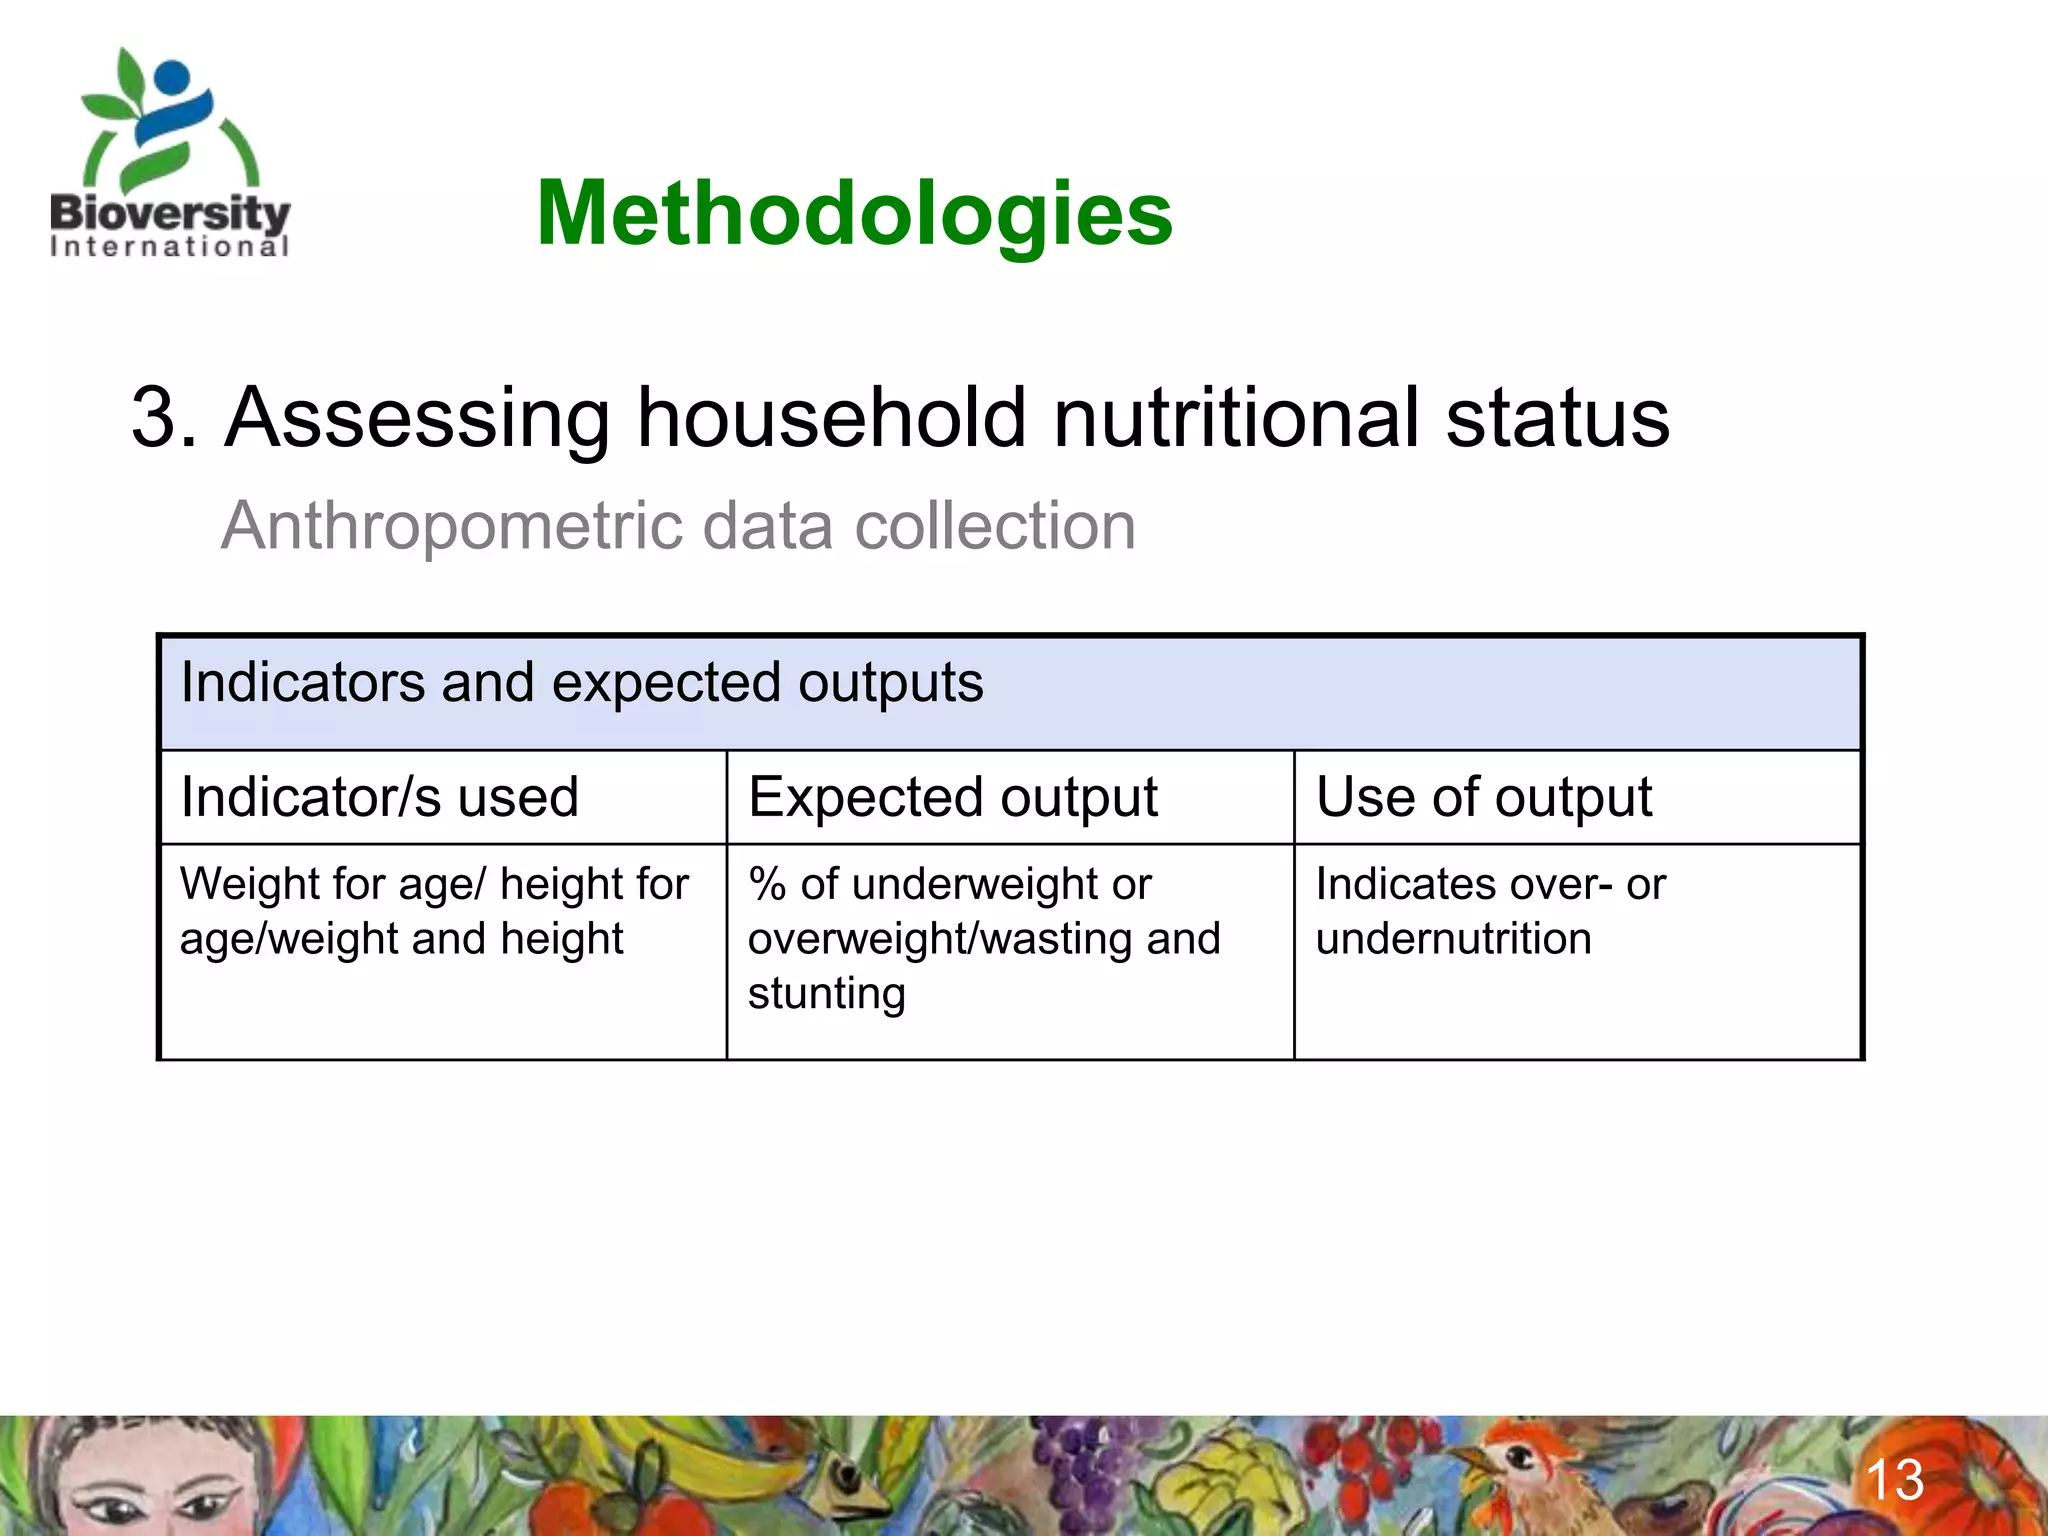
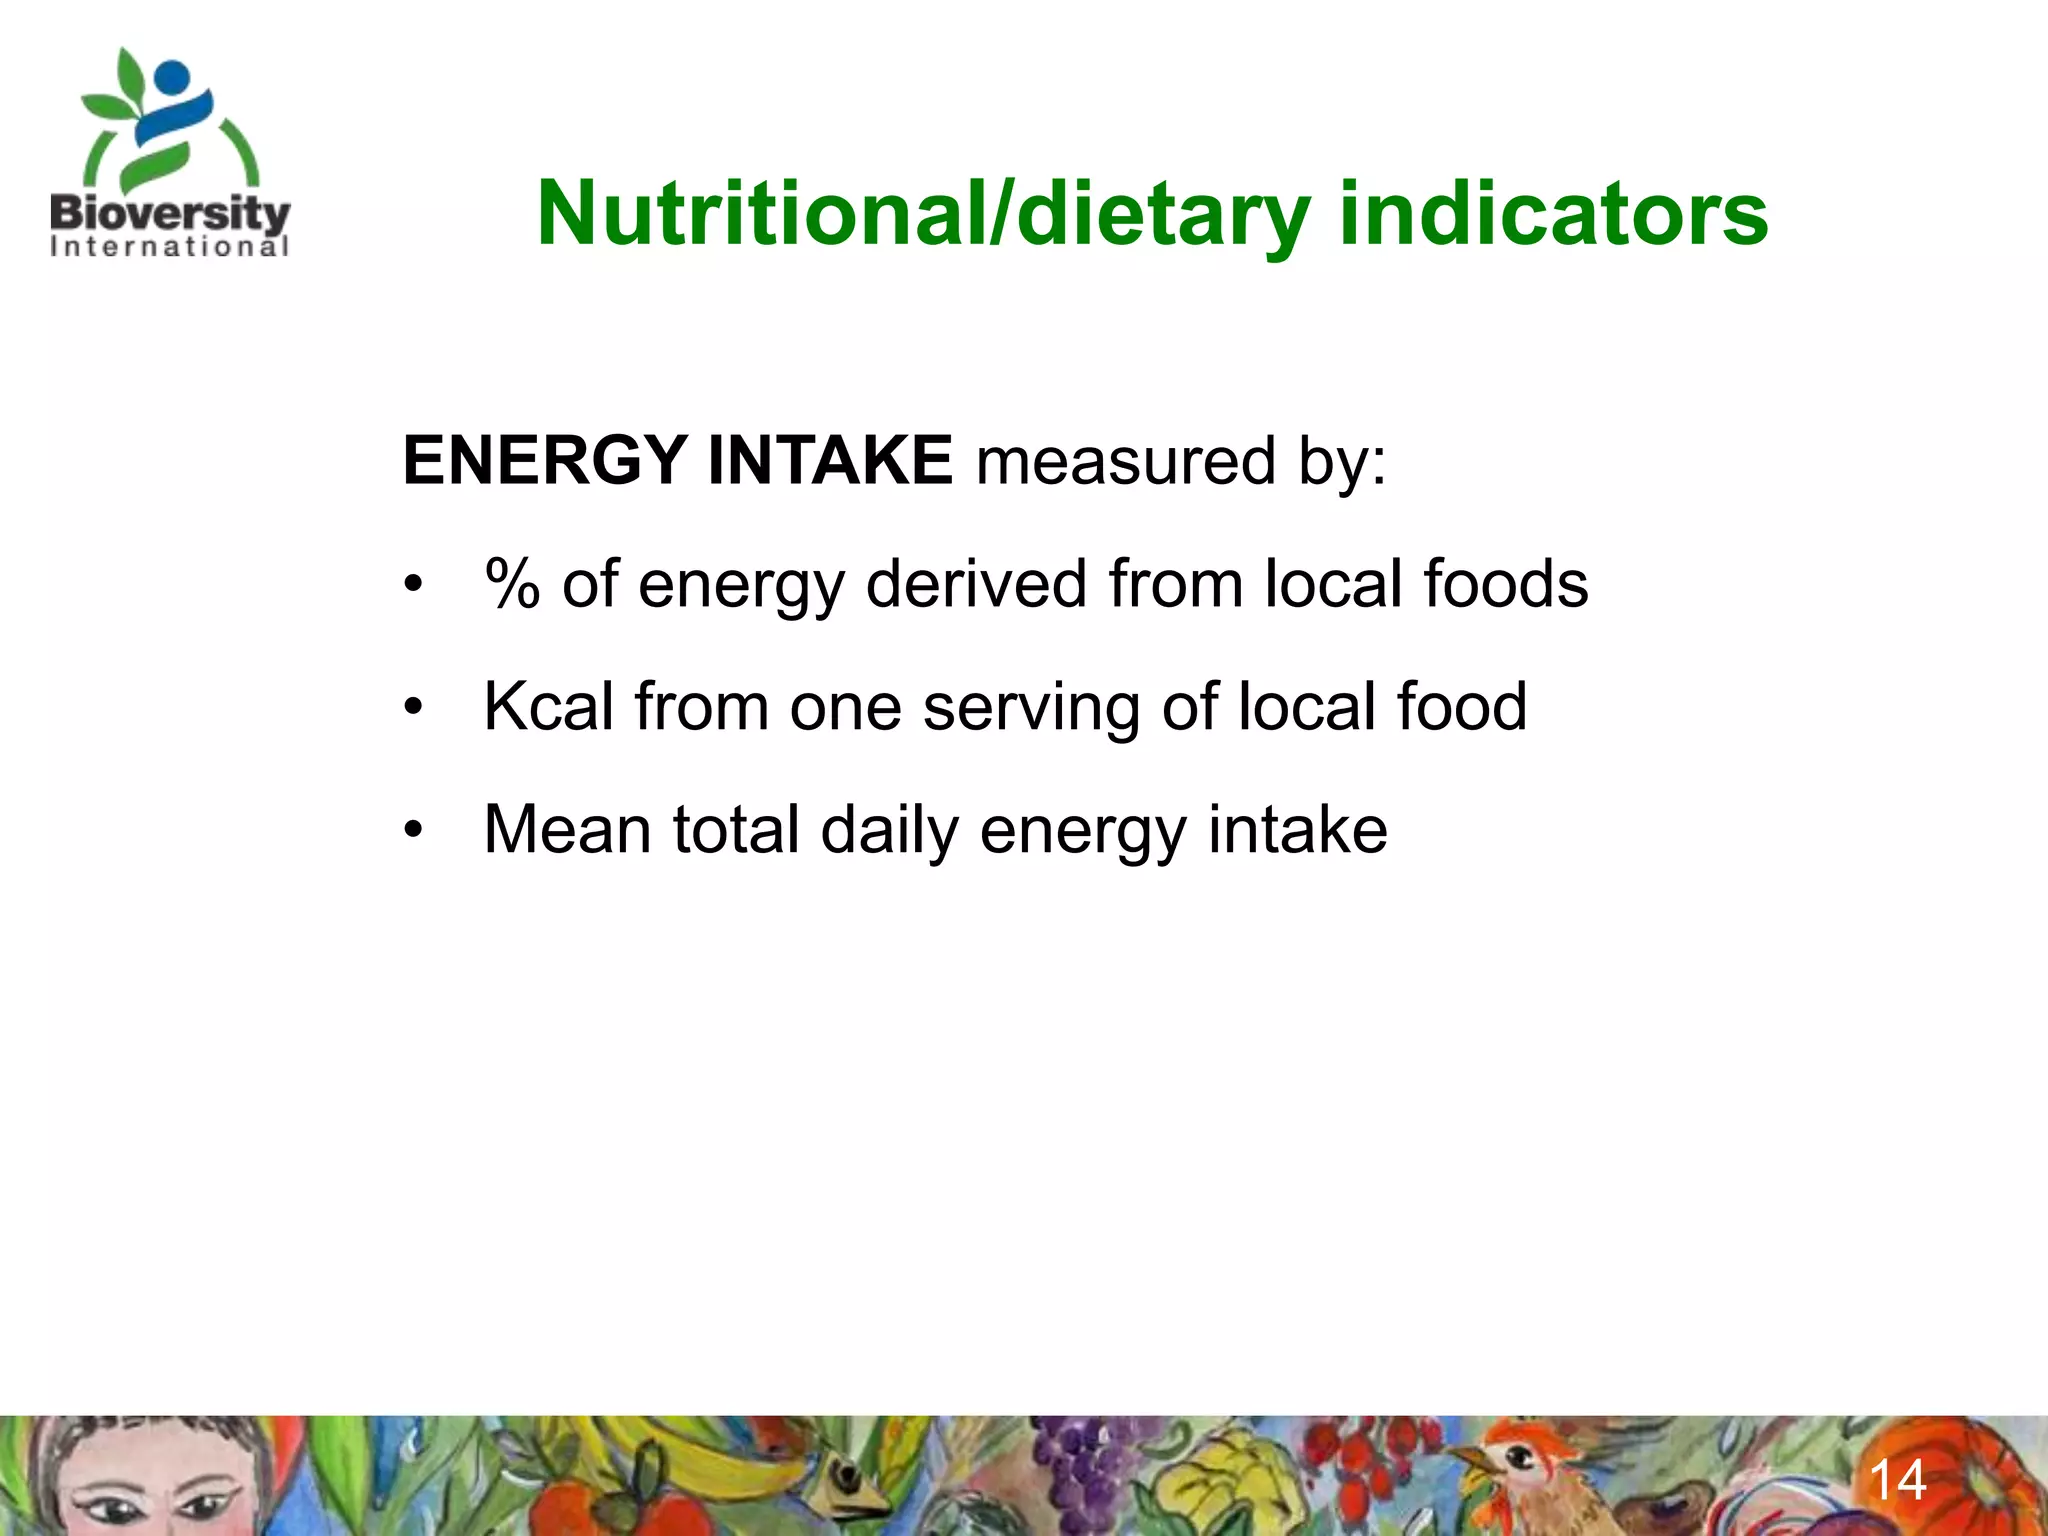
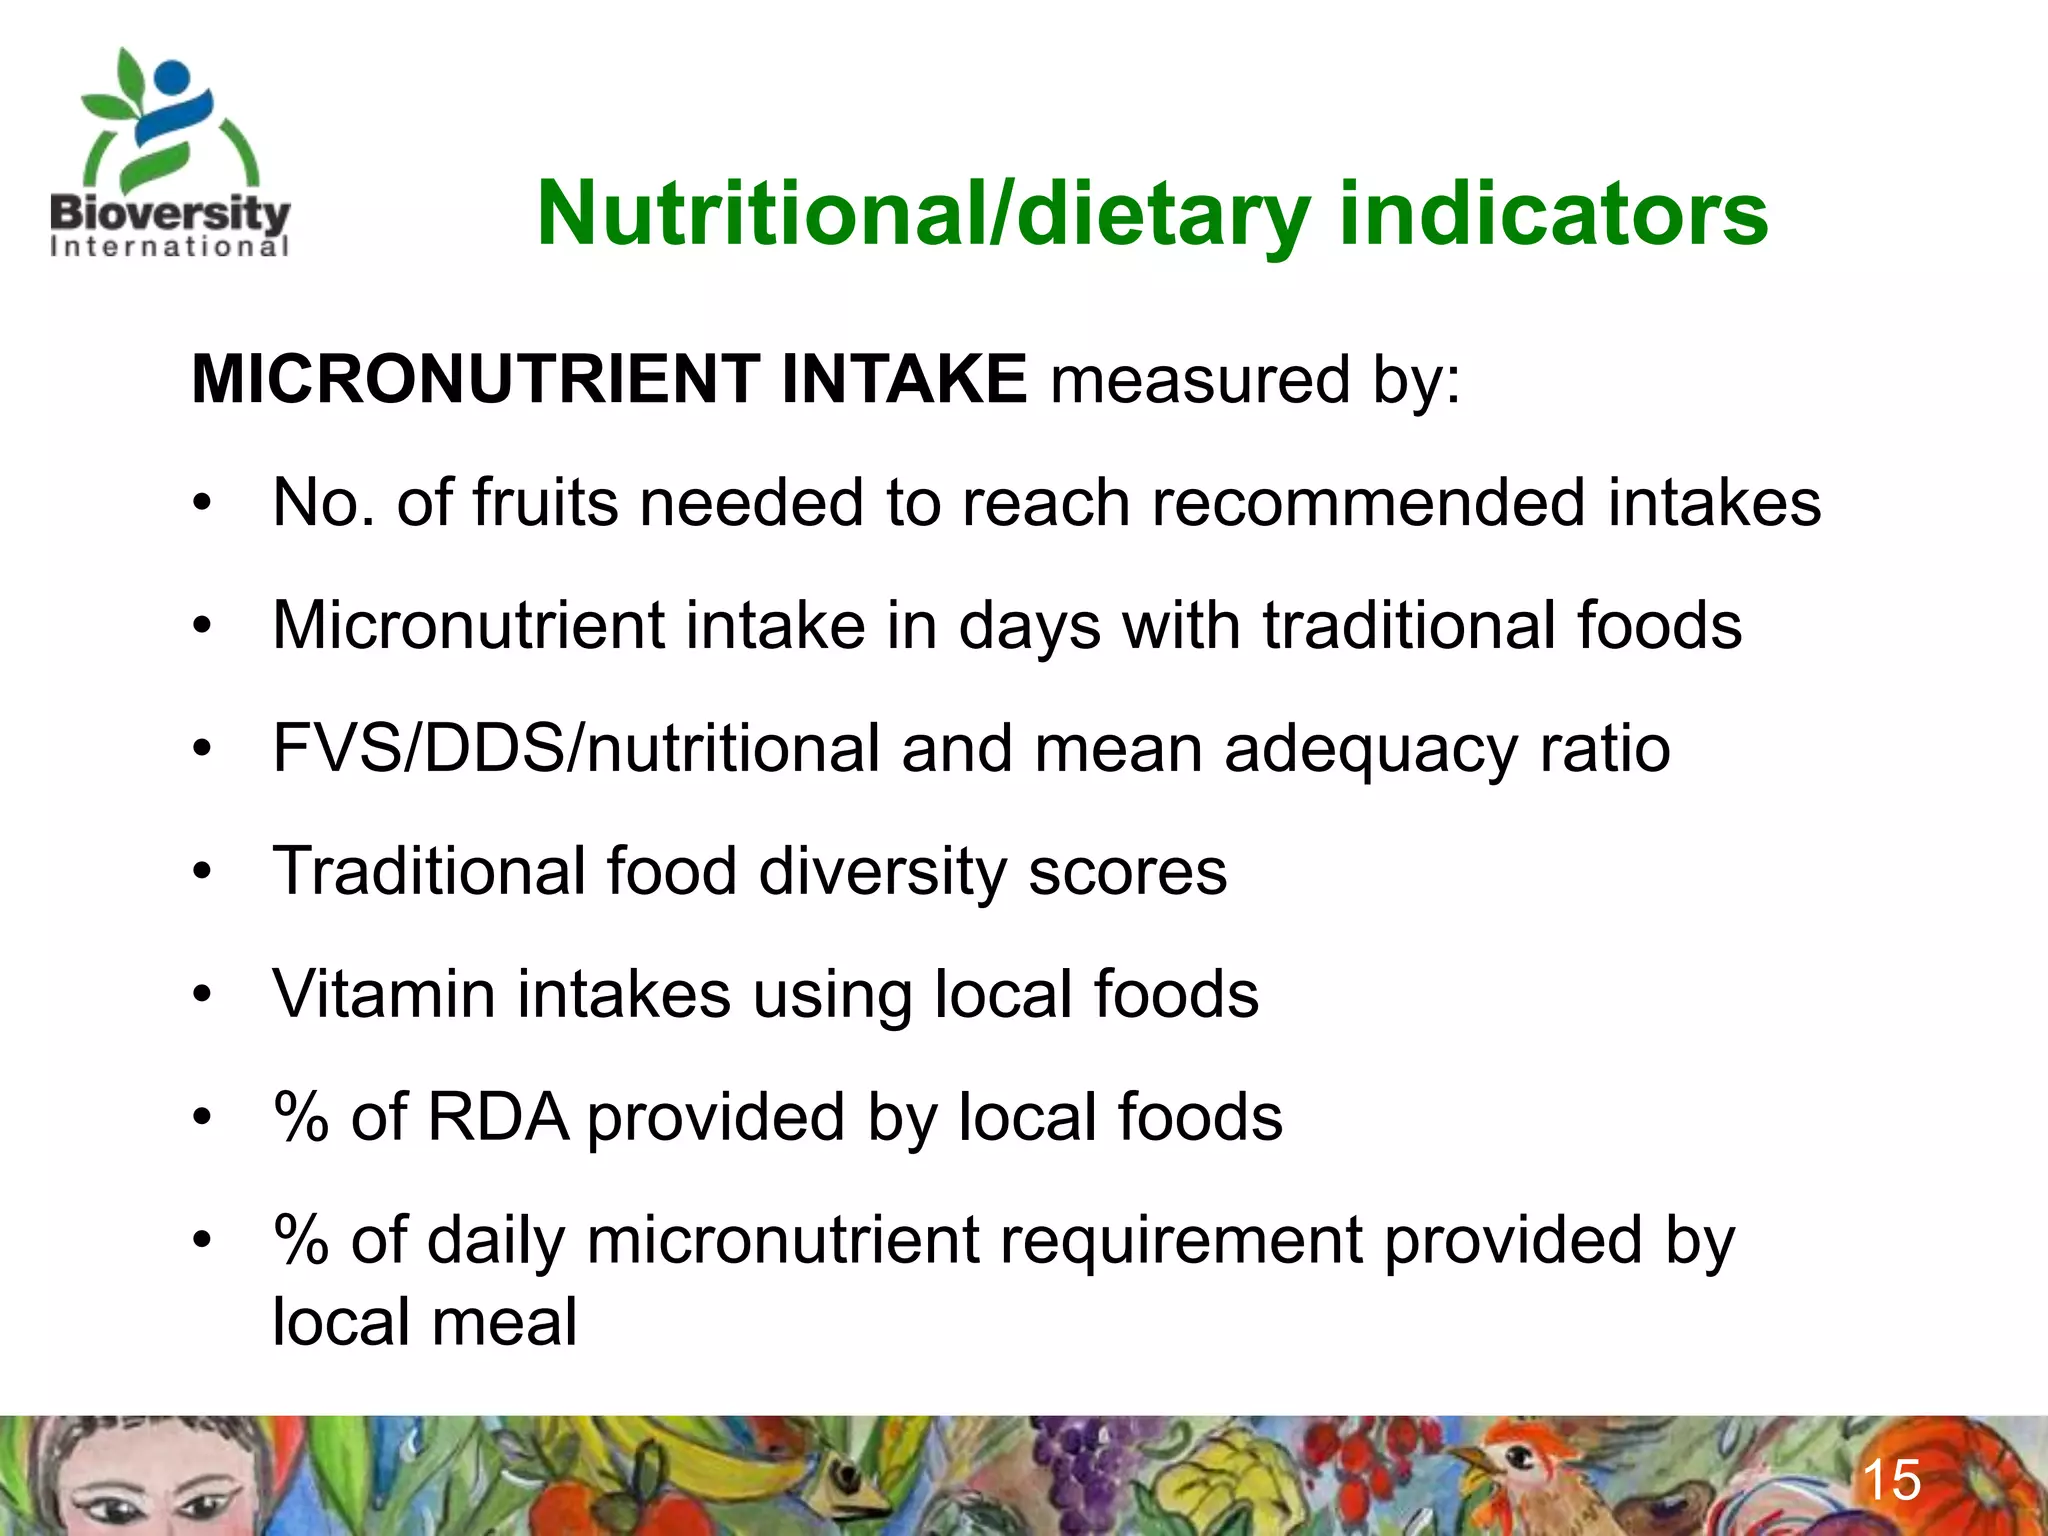
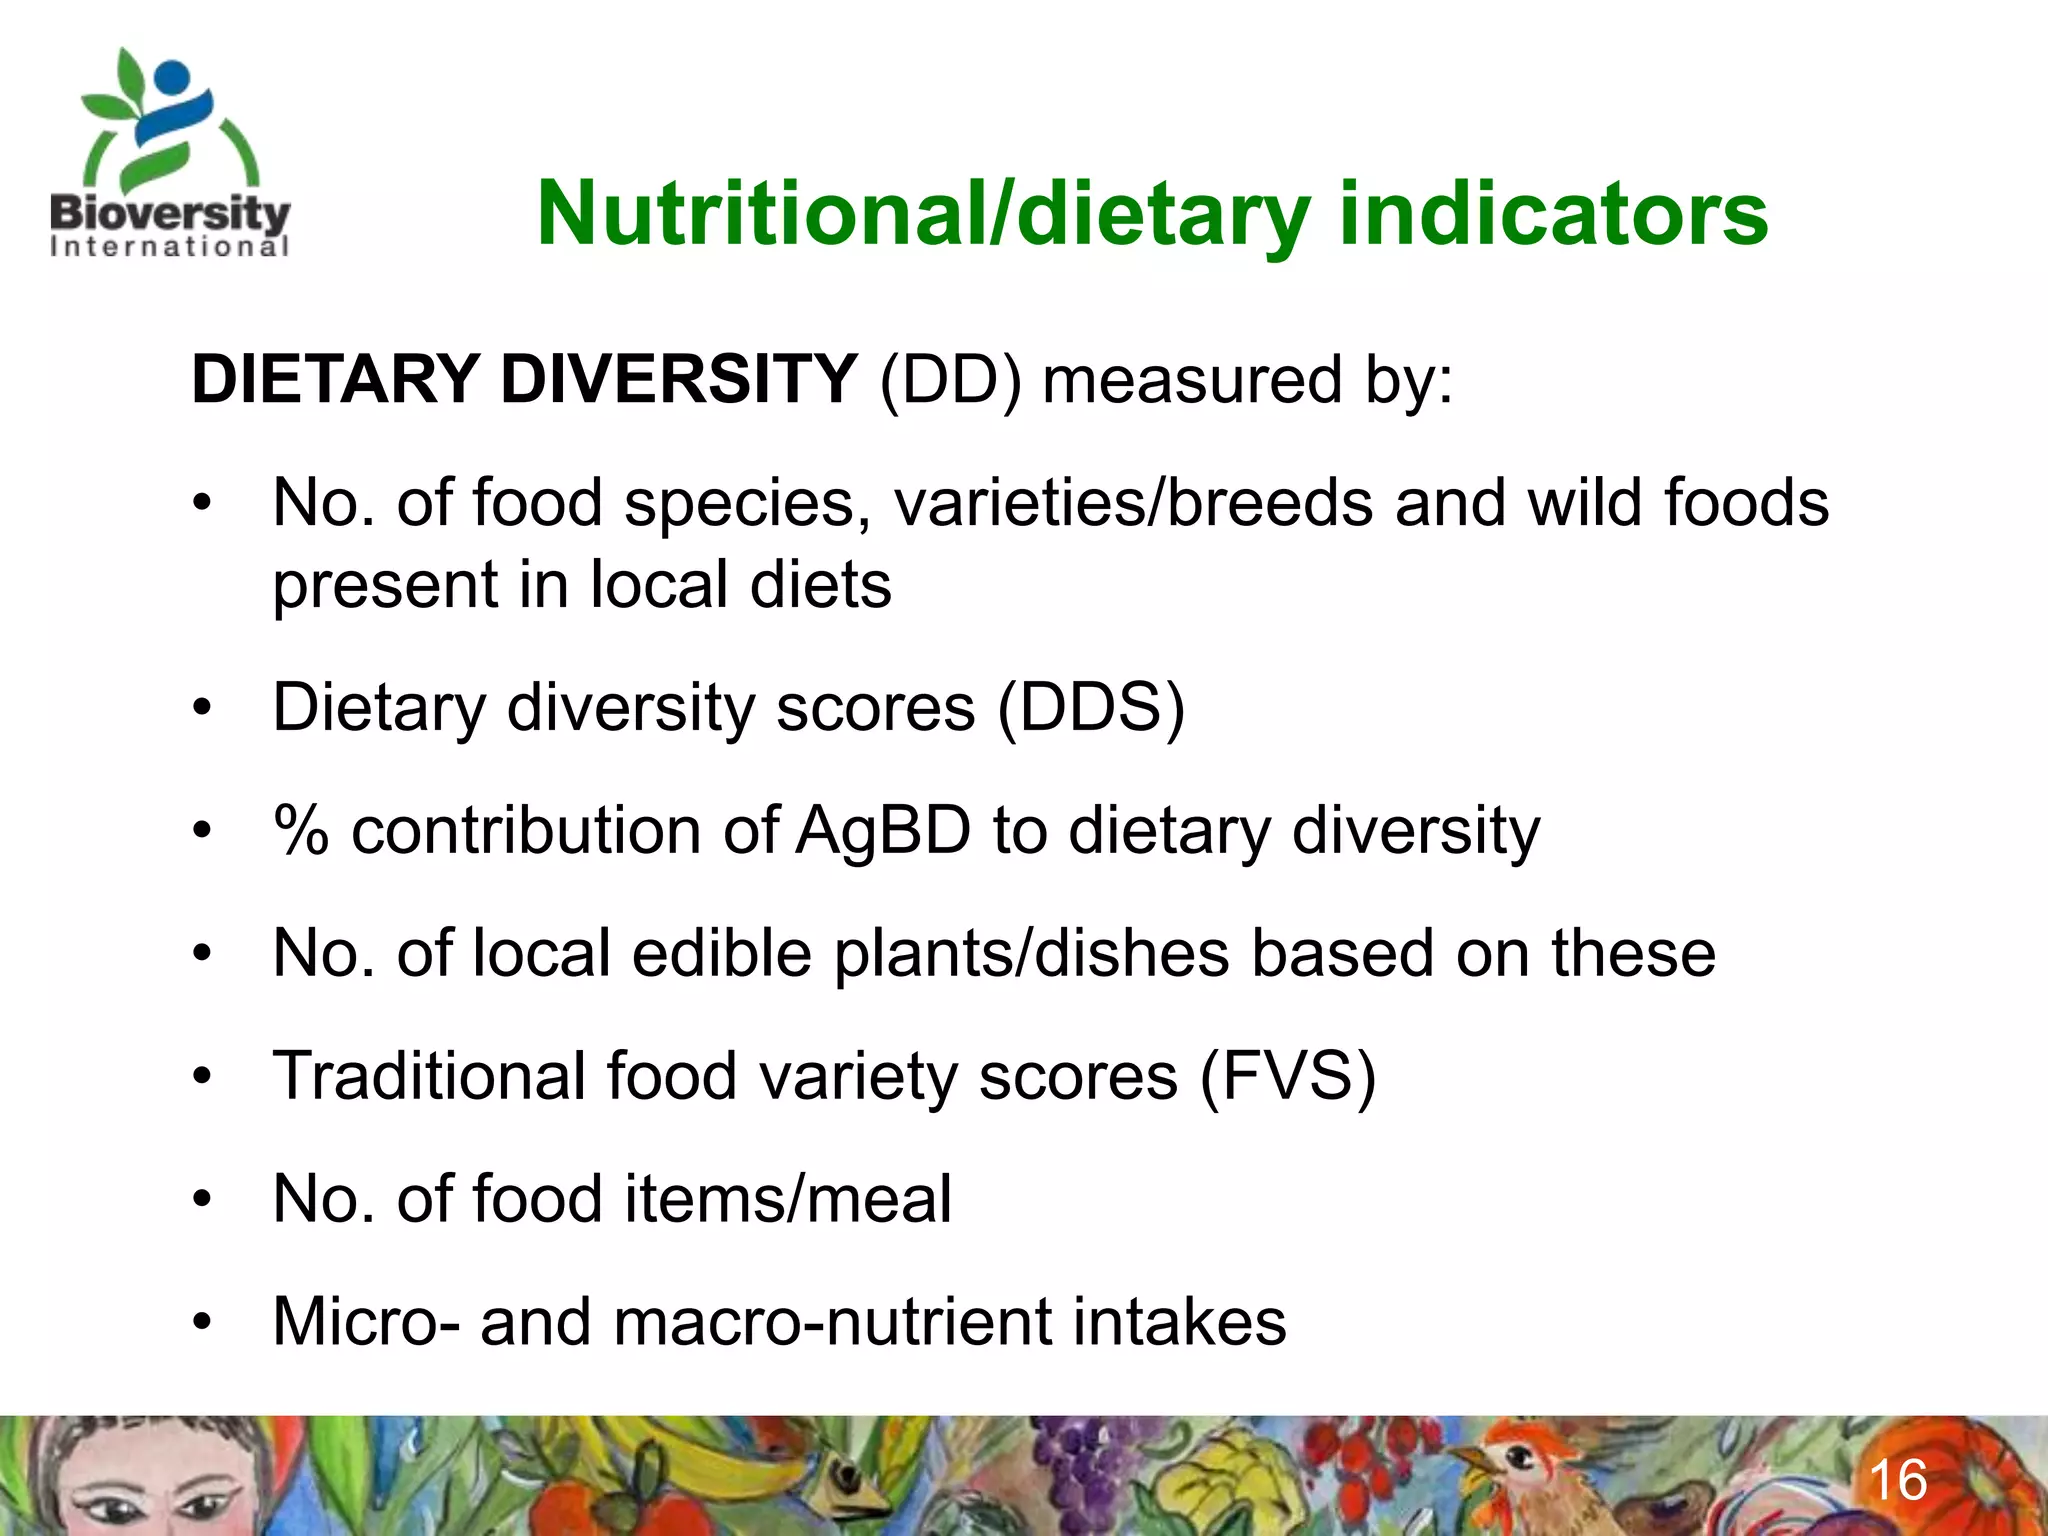
ANNEX E:
Approaches for linking biodiversity and nutrition

                                    Teresa Borelli
                           Bioversity International
2
3
Importance of agrobiodiversity


              Nutrition
              & Health


  Dietary
  Diversity


                     Biodiversity


                                    4
Importance of traditional foods

         • NUS
         • Wild foods
         • Lesser known grains
         • Green leafy vegetables
         • Tubers
         • Crop wild relatives
         • Forest fruits

                                    5
Contribution of traditional foods and no. of
  species/varieties to dietary energy

Indigenous groups                  Energy %            No. of
                                                  species/varieties
Awajun (Peru)                          93                 223
Bhil (India)                           59                  95
Dalit (India)                          43                 329
Gwich’in (Canada)                      33                  50
Igbo (Nigeria)                         96                 220
Ingano (Colombia)                      47                 160
Inuit (Canada)                         41                  79
Karen (Thailand)                      85*                 387
Maasai (Kenya)                          6                  35
Nuxalk (Canada)                       30*                  67
Pohnpei (FSM)                          27                 381
            Adapted from: Indigenous Peoples’ Food Systems, FAO/CINE, 2009


                                                                             6
Example of field work and project activities

1. Survey on traditional food system
          •     Literature survey
          •     In-depth interviews
          •     Informal focus group discussions
2. Market and agroforestry survey
          •     Markets surveyed
          •     Agroforestry study interviews
3. Photographic documentation
4. Health study – Anthropometric data
5. Dietary assessment
          •     24-hour recalls, food frequency questionnaires, DDS, FVS
6. Survey of factors relating to nutrition/health behaviours and issues
7. Food sample collection for analysis and identification

                         Adapted from: Indigenous Peoples’ Food Systems,
                         FAO/CINE, 2009
                                                                           7
Documenting the food system

                    Key informant   Focus Group
                     interviews     Discussions

    Agroecosystem                              Assess local AgBD
        analysis                                and food cultures
• Map of infrastructures                     • Document species
  and community                              • Typical foods/recipes
  resources                                  • Harvesting and
• Habitat where foods                          processing
  are found                                    techniques
• Market flows of goods                      • Gender preference
• Seasonality of Ag                            and food allocation in
  products and market                          the home
  values

                                                                   8
1. Developing the macro-perspective –
documenting the cultural food system


                                        9
How to collect agrobiodiversity data
    Scientific name          Common         Local    Parts        Seasonality    Marketed     Source
                             name           name     used
    Starchy staples

1   Alocasia macrorrhiza     Alocasia       ohd      Corm              no            no       Wild
                             Taro
2   Artocarpus altilis (15   Breadfruit     mahi     Fruit, nut        yes           yes      Cultivated
    var.)
    Fruits and nuts
3   Annona muricata          Soursop        sei      Fruit             yes           yes      Wild

4   Ficus tinctoria          Native fig     nin      Berry             yes           no       Wild

    Fish
5   Acantocybium solandri    Wahoo          ahi      -                 no            yes      Wild

6   Etelis corucans          Onaga          lol      -                 no            yes      Wild


                                        Adapted from: Indigenous Peoples’ Food Systems, FAO/CINE, 2009


                                                                                                 10
Methodologies

 1. Developing the macro-perspective
      Document local farming systems

Indicators and expected outputs

Indicator/s used             Expected output             Use of output
Soil sampling elevation,     Classified farming system   Crop and livestock change
GPS coords, cropping                                     can be tailored to the
system, water availability                               agroecological environment

Farming system, settlement   Summary of community        Targeting production
map indicating resources,    agroecology                 potentials by understanding
community visualization of                               how access to resources
production, consumption,                                 and where barriers exist in
market flows                                             market flow


                                                                                   11
Methodologies

 2. Assess household dietary patterns
      Document ethnofood culture and local food diversity

Indicators and expected outputs

Indicator/s used              Expected output                 Use of output
24 hour recalls, FVS, DDS     Description of food
                              availability and dietary
                              assessment at household
                              level                           Used to describe overall
                                                              food security at the
Documenting food culture      Description of utilization of
                                                              household and local level
and eating patterns, taboos   food resources


                                                                                          12
Methodologies

3. Assessing household nutritional status
   Anthropometric data collection

 Indicators and expected outputs

 Indicator/s used             Expected output          Use of output
 Weight for age/ height for   % of underweight or      Indicates over- or
 age/weight and height        overweight/wasting and   undernutrition
                              stunting


                                                                            13
Nutritional/dietary indicators

ENERGY INTAKE measured by:
• % of energy derived from local foods
• Kcal from one serving of local food
• Mean total daily energy intake


                                         14
Nutritional/dietary indicators
MICRONUTRIENT INTAKE measured by:
• No. of fruits needed to reach recommended intakes
• Micronutrient intake in days with traditional foods
• FVS/DDS/nutritional and mean adequacy ratio
• Traditional food diversity scores
• Vitamin intakes using local foods
• % of RDA provided by local foods
• % of daily micronutrient requirement provided by
  local meal

                                                        15
Nutritional/dietary indicators
DIETARY DIVERSITY (DD) measured by:
• No. of food species, varieties/breeds and wild foods
  present in local diets
• Dietary diversity scores (DDS)
• % contribution of AgBD to dietary diversity
• No. of local edible plants/dishes based on these
• Traditional food variety scores (FVS)
• No. of food items/meal
• Micro- and macro-nutrient intakes

                                                         16
Thank you!


             17

BFN Project - Approaches for linking biodiversity and nutrition

  • 1.
    ANNEX E: Approaches forlinking biodiversity and nutrition Teresa Borelli Bioversity International
  • 2.
  • 3.
  • 4.
    Importance of agrobiodiversity Nutrition & Health Dietary Diversity Biodiversity 4
  • 5.
    Importance of traditionalfoods • NUS • Wild foods • Lesser known grains • Green leafy vegetables • Tubers • Crop wild relatives • Forest fruits 5
  • 6.
    Contribution of traditionalfoods and no. of species/varieties to dietary energy Indigenous groups Energy % No. of species/varieties Awajun (Peru) 93 223 Bhil (India) 59 95 Dalit (India) 43 329 Gwich’in (Canada) 33 50 Igbo (Nigeria) 96 220 Ingano (Colombia) 47 160 Inuit (Canada) 41 79 Karen (Thailand) 85* 387 Maasai (Kenya) 6 35 Nuxalk (Canada) 30* 67 Pohnpei (FSM) 27 381 Adapted from: Indigenous Peoples’ Food Systems, FAO/CINE, 2009 6
  • 7.
    Example of fieldwork and project activities 1. Survey on traditional food system • Literature survey • In-depth interviews • Informal focus group discussions 2. Market and agroforestry survey • Markets surveyed • Agroforestry study interviews 3. Photographic documentation 4. Health study – Anthropometric data 5. Dietary assessment • 24-hour recalls, food frequency questionnaires, DDS, FVS 6. Survey of factors relating to nutrition/health behaviours and issues 7. Food sample collection for analysis and identification Adapted from: Indigenous Peoples’ Food Systems, FAO/CINE, 2009 7
  • 8.
    Documenting the foodsystem Key informant Focus Group interviews Discussions Agroecosystem Assess local AgBD analysis and food cultures • Map of infrastructures • Document species and community • Typical foods/recipes resources • Harvesting and • Habitat where foods processing are found techniques • Market flows of goods • Gender preference • Seasonality of Ag and food allocation in products and market the home values 8
  • 9.
    1. Developing themacro-perspective – documenting the cultural food system 9
  • 10.
    How to collectagrobiodiversity data Scientific name Common Local Parts Seasonality Marketed Source name name used Starchy staples 1 Alocasia macrorrhiza Alocasia ohd Corm no no Wild Taro 2 Artocarpus altilis (15 Breadfruit mahi Fruit, nut yes yes Cultivated var.) Fruits and nuts 3 Annona muricata Soursop sei Fruit yes yes Wild 4 Ficus tinctoria Native fig nin Berry yes no Wild Fish 5 Acantocybium solandri Wahoo ahi - no yes Wild 6 Etelis corucans Onaga lol - no yes Wild Adapted from: Indigenous Peoples’ Food Systems, FAO/CINE, 2009 10
  • 11.
    Methodologies 1. Developingthe macro-perspective Document local farming systems Indicators and expected outputs Indicator/s used Expected output Use of output Soil sampling elevation, Classified farming system Crop and livestock change GPS coords, cropping can be tailored to the system, water availability agroecological environment Farming system, settlement Summary of community Targeting production map indicating resources, agroecology potentials by understanding community visualization of how access to resources production, consumption, and where barriers exist in market flows market flow 11
  • 12.
    Methodologies 2. Assesshousehold dietary patterns Document ethnofood culture and local food diversity Indicators and expected outputs Indicator/s used Expected output Use of output 24 hour recalls, FVS, DDS Description of food availability and dietary assessment at household level Used to describe overall food security at the Documenting food culture Description of utilization of household and local level and eating patterns, taboos food resources 12
  • 13.
    Methodologies 3. Assessing householdnutritional status Anthropometric data collection Indicators and expected outputs Indicator/s used Expected output Use of output Weight for age/ height for % of underweight or Indicates over- or age/weight and height overweight/wasting and undernutrition stunting 13
  • 14.
    Nutritional/dietary indicators ENERGY INTAKEmeasured by: • % of energy derived from local foods • Kcal from one serving of local food • Mean total daily energy intake 14
  • 15.
    Nutritional/dietary indicators MICRONUTRIENT INTAKEmeasured by: • No. of fruits needed to reach recommended intakes • Micronutrient intake in days with traditional foods • FVS/DDS/nutritional and mean adequacy ratio • Traditional food diversity scores • Vitamin intakes using local foods • % of RDA provided by local foods • % of daily micronutrient requirement provided by local meal 15
  • 16.
    Nutritional/dietary indicators DIETARY DIVERSITY(DD) measured by: • No. of food species, varieties/breeds and wild foods present in local diets • Dietary diversity scores (DDS) • % contribution of AgBD to dietary diversity • No. of local edible plants/dishes based on these • Traditional food variety scores (FVS) • No. of food items/meal • Micro- and macro-nutrient intakes 16
  • 17.