Downloaded 35 times


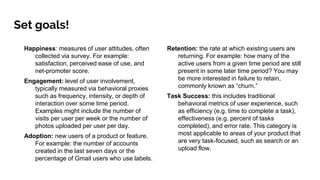

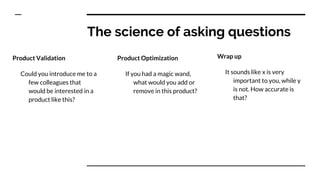
![The science of asking questions
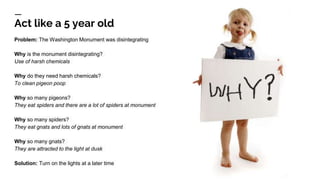
Problem Discovery
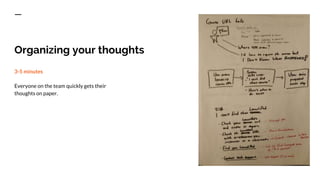
Describe your each step
involved to complete [job to
be done]. What are you
thinking during each step?
What are you feeling?
Problem Validation
Tell me about the last time you
[process you’re improving]
What are you currently doing
to solve this problem/get
this value?](https://image.slidesharecdn.com/meetup-productdesign-160304150553/85/LaunchNJ-Product-Design-Sprints-33-320.jpg)
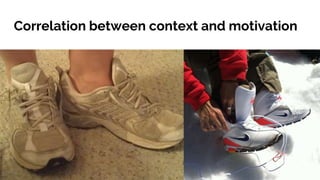
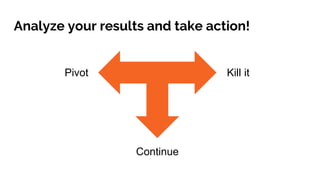
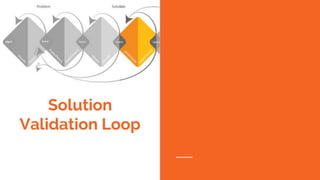


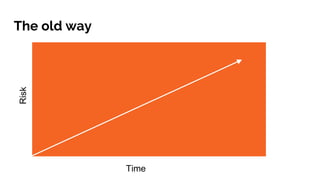
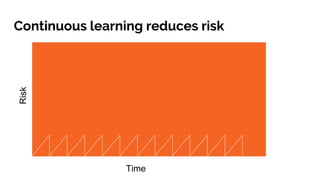
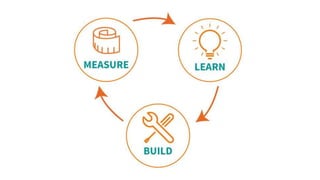
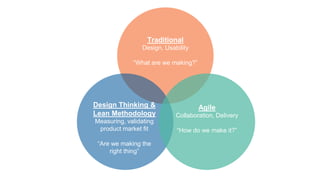
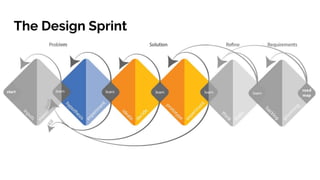
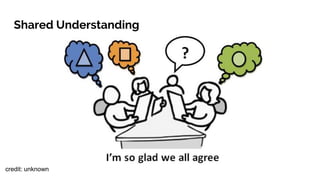
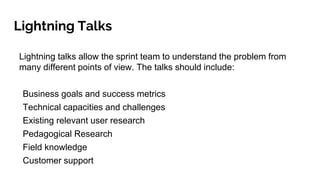
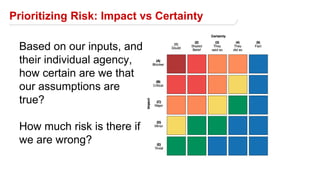
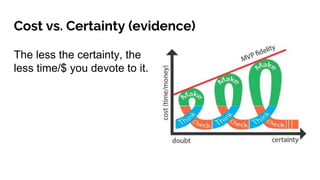
This document outlines the process of a design sprint used to validate product ideas. It discusses gathering inputs from various perspectives, defining problem statements and hypotheses to test, conducting rapid prototyping and user testing, and analyzing results to determine whether to pivot, kill, or continue an idea. The goal of a sprint is to learn quickly without fully building products in order to reduce risk and build the right solution for customers. Interactive prototyping and usability testing are emphasized over traditional design approaches to gather early feedback and make data-driven decisions.


![[UserTesting Webinar] Design Thinking & Design Research at Credit Karma](https://cdn.slidesharecdn.com/ss_thumbnails/usertestingwebinar-creditkarma-yasminekhan-finalpresentationslidesv2-170418203933-thumbnail.jpg?width=640&height=640&fit=bounds)


![[DevDay2019] Lean UX - By Bryant Castro, Bryant Castro at Wizeline](https://cdn.slidesharecdn.com/ss_thumbnails/bryantcastro-43ddopresoleanux-190416065313-thumbnail.jpg?width=640&height=640&fit=bounds)


