The document discusses activity diagrams in UML. It explains that activity diagrams model procedural flows of actions and can depict use case flows at a more detailed level. The basics of activity diagrams are covered, including actions, the initial state, and the final state. Beyond the basics, the document discusses decision points, merge points, and swim lanes. Decision points use guards to control the flow. Merge points connect decision paths. Swim lanes assign columns to different objects to clarify flows between them.
The document discusses sequence diagrams and their notation. Sequence diagrams show the interaction between objects over time by depicting messages exchanged. The summary discusses:
- Sequence diagrams show object interactions arranged in time sequence through messages exchanged.
- Objects are drawn as rectangles containing the object name. A sequence diagram has two dimensions - the vertical for message sequence and horizontal for involved objects.
- Boundary classes capture interface requirements, not implementation. Complexity is kept simple through separate diagrams for conditional logic.
The document discusses various types of Unified Modeling Language (UML) diagrams used for software modeling including state machine diagrams, deployment diagrams, package diagrams, component diagrams, and timing diagrams. It provides descriptions of each diagram type including their purpose and how they are used to model different aspects of software design.
Master sequence diagrams with this sequence diagram guide. It describes everything you need to know on sequence diagram notations, best practices as well as common mistakes. It also explains how to draw a sequence diagram step by step. Plus it offers Creately sequence diagram templates you can click and edit right away.
The document discusses various modeling techniques used to model complex software systems, including UML diagrams. It describes different types of UML diagrams like class diagrams, object diagrams, sequence diagrams, and collaboration diagrams. It explains concepts like classes, associations, generalizations, aggregations, and interfaces. It provides examples of how these diagrams can be used to model different types of relationships between classes and objects.
Sequence diagrams, component diagrams, activity diagrams, and collaboration diagrams are different types of UML diagrams that model various aspects of a system.
Sequence diagrams show the interactions between objects over time by modeling message exchanges, while component diagrams illustrate how software components are wired together. Activity diagrams model workflow and process flows, and collaboration diagrams specifically show synchronous message interactions between objects for a use case. Each diagram type serves a different modeling purpose and provides a unique perspective on the system.
The document provides an overview of Unified Modeling Language (UML) including its history, basic building blocks, and types of diagrams. It describes that UML was created in the 1990s to standardize modeling languages and combines concepts from object-oriented analysis and design. The basic building blocks of UML are things (model elements), relationships, and diagrams used to visualize models. There are several types of diagrams for structural and behavioral modeling.
The document provides an overview of the Unified Modeling Language (UML) including:
1) UML consists of 9 diagrams used at different stages of software development for requirements analysis, design, and deployment.
2) UML diagrams can be classified as static, dynamic, or implementation based on whether they depict the structural, behavioral, or deployment aspects of a system.
3) Popular UML tools should support features like generating code from diagrams, reverse engineering code into diagrams, and integrating with IDEs. Rational Rose is a widely used UML modeling tool.
This is an introduction to UML (Unified Modeling Language) given to people whom has no background on business modeling using UML. This is based on UML version 2.
Interaction modeling describes how objects in a system interact and communicate through message passing. It uses several UML diagrams including use case diagrams, sequence diagrams, activity diagrams, and collaboration diagrams. A use case diagram shows relationships between actors and use cases, while a sequence diagram depicts the temporal order of messages exchanged between objects to complete a scenario. An activity diagram models system workflows and dependencies between activities. A collaboration diagram displays message flows between objects to achieve a particular task.
This document provides an introduction to the Unified Modeling Language (UML). UML was developed in the mid-1990s as a standard language for modeling software systems. It uses different types of diagrams like class, use case, sequence, and state diagrams to visualize and document various aspects of a software system. The document describes the history and development of UML, provides examples of different UML diagrams, and explains how to interpret and use the diagrams.
UML (Unified Modeling Language) is a standard language for specifying, visualizing, constructing and documenting software systems. It uses mainly graphical notations to express design of software projects. There are two main categories of UML diagrams - structural diagrams which focus on static elements regardless of time, and behavioral diagrams which focus on dynamic features and business processes. Common UML diagram types include class, sequence, use case, activity, state machine, component, deployment and interaction diagrams.
An Automatic Approach to Translate Use Cases to Sequence DiagramsMohammed Misbhauddin
An automatic approach is presented to translate use case descriptions to sequence diagrams. The approach uses a metamodel for use case specifications and sequence diagrams to guide the translation process. Key steps include parsing use case steps, identifying mapping rules between meta-models, and applying a translation process. An evaluation on sample student projects found the approach produced most sequence diagram constructs from use case sentences, addressing a gap between specification and design domains. Future work includes handling compound sentences and increasing classification rates using artificial intelligence.
The document discusses various Unified Modeling Language (UML) diagrams used to model different aspects of software systems. It describes structure diagrams like class diagrams that show system composition and deployment diagrams that map software to hardware. It also covers behavioral diagrams like use case diagrams, interaction diagrams (sequence and communication diagrams), state-chart diagrams, and activity diagrams that model dynamic system behavior through object interactions and state transitions. Specific examples are provided for how to construct and interpret sequence diagrams, state machine diagrams, and activity diagrams.
This document provides explanations of interaction overview diagrams and timing diagrams. It defines interaction overview diagrams as a combination of activity and sequence diagrams that can visualize two aspects of object behavior. Timing diagrams are used to represent timing constraints and state changes over time. There are two notation styles for timing diagrams: state lifelines that show states as lines, and value lifelines that show states as areas. An example diagram of an automatic door is presented to illustrate both notation styles.
The document introduces visual modeling and modeling software systems using Rational Rose. It discusses that visual modeling graphically depicts a system and allows filtering out nonessential details while providing different perspectives. Modeling software identifies requirements, focuses on component interactions, and improves communication. Rational Rose supports modeling through use case, logical, component and deployment views using diagrams like use case, class, sequence and state charts. It generates code and keeps designs and code synchronized through development.
The document summarizes a chapter about use case modeling. It describes use cases and actors, relationships between use cases, and use case descriptions. Use case modeling involves identifying functional requirements, drawing diagrams showing actors and use cases, and writing use case descriptions in a conversational style to document interactions between actors and the system. Relationships like include, extend, and generalization are used to show how use cases relate to each other.
Interaction diagrams describe how objects interact and communicate with each other. The two main types are sequence diagrams and collaboration diagrams. Sequence diagrams show the time ordering of messages visually with objects arranged from top to bottom. Collaboration diagrams focus more on the relationships between objects and can show all messages between objects clearly. Both are used to model dynamic behavior and interactions in a system.
The document discusses sequence diagrams and their use in system analysis and design. Sequence diagrams show the interactions between objects in a system and the order that messages and method calls are made. They can incorporate elements like alternate paths using frames to represent conditional logic. While not required, sequence diagrams are useful for testing a system design by validating interactions and method accessibility between classes.
The document discusses UML (Unified Modeling Language) and object-oriented software development. It describes the software development life cycle and various modeling techniques used in UML, including use case diagrams, class diagrams, sequence diagrams, and collaboration diagrams. It explains key UML concepts such as classes, objects, attributes, operations, actors, and relationships. The benefits of visual modeling and UML are also summarized.
The document provides an overview of the Unified Modeling Language (UML), including its history, purpose, key diagrams, and changes between versions. It describes how UML was created in the 1990s to standardize modeling of software systems, and discusses the main structural and behavioral diagrams used to model different aspects of a system, such as class, use case, activity, and state diagrams. The document also summarizes new elements introduced in UML 2.0, such as changes to activity diagrams.
Interaction overview and Profile UML DiagramsHusnain Safdar
The document discusses two UML diagrams: Interaction Overview Diagram and Profile Diagram. The Interaction Overview Diagram focuses on the flow of control of interactions and visualizes a sequence of activities using nested interaction diagrams. The Profile Diagram is an extensibility mechanism that allows customizing UML using stereotypes, tagged values, and constraints to make the language suitable for a specific domain. Stereotypes introduce new model elements, tagged values add additional properties, and constraints specify semantics or conditions that must be true.
UML (Unified Modeling Language) is a standardized modeling language used to create visual representations of object-oriented software systems. It includes various diagram types to depict different views of a system, such as use case diagrams (user functionality), class diagrams (system structure), statechart diagrams (object states), sequence diagrams (object interactions), and activity diagrams (system workflows). UML provides a common language for discussing and designing software systems and standard visual symbols for expressing models.
UML (Unified Modeling Language) is a standard language for specifying, visualizing, and documenting software systems. It uses various diagrams to model different views of a system, such as structural diagrams (e.g. class diagrams), behavioral diagrams (e.g. sequence diagrams), and deployment diagrams. The key building blocks of UML include things (classes, interfaces, use cases), relationships (associations, generalizations), and diagrams. UML aims to provide a clear blueprint of software systems for both technical and non-technical audiences.
UML allows for extending diagrams and modeling elements through three main techniques:
1. Stereotypes allow applying tags to existing modeling elements like classes, associations, etc. to add domain-specific meaning.
2. Profiles extend UML with new modeling elements tailored for specific domains or platforms.
3. Extension mechanisms allow precisely defining new constructs that integrate with the UML metamodel. Together these techniques make UML extensible for multiple domains.
This document provides an overview and summary of the book "Visual Modeling with Rational Rose 2000 and UML" by Terry Quatrani. The book introduces visual modeling techniques using the Unified Modeling Language (UML) notation and the Rational Rose modeling tool. It uses a case study of designing a university course registration system to demonstrate the iterative software development process. Over the course of 12 chapters, the book guides readers through analyzing requirements, identifying objects and classes, discovering how objects interact through scenarios and diagrams, specifying class relationships, adding behavior and structure to classes, checking model consistency, and designing system architecture. The book provides a practical introduction to visual modeling, the UML, and the Rational Unified Process for analyzing and
This document provides guidance on changes to the 2010 ADA Standards for Accessible Design. It addresses revisions to section 35.151 of the Title II regulations regarding alterations to facilities by state and local governments. The key changes include: adding an exception for structural impracticability; clarifying that path of travel requirements only apply to alterations not for program accessibility compliance; and establishing a safe harbor for elements complying with the 1991 Standards.
The document discusses the Americans with Disabilities Act Accessibility Guidelines (ADAAG) which provide specifications for accessibility to places of public accommodation. It covers topics such as corridor and doorway dimensions, ramp specifications, accessible restroom requirements, and scoping provisions that dictate the number of required accessible fixtures. Designers must follow these guidelines to ensure compliance with the Americans with Disabilities Act.
Have you ever seen Handicap village?
We should really appreciate the school management.
The school is raising donations please refer to last slide of PPT for more details.
This document discusses handicaps, disabilities, and rehabilitation. It defines handicaps as disadvantages that limit a person's ability to fulfill normal roles due to physical, cognitive, mental, sensory or emotional impairments. Rehabilitation aims to restore function and quality of life through prevention strategies and a multidisciplinary team. Therapeutic exercises are important for rehabilitation and include strengthening, balance training, coordination, gait training, mobilization, massage, and relaxation exercises. Physical activity and exercise can improve disabilities and handicaps to enhance quality of life.
software engineering with uml- activity diagramrahmantoyuri
This document discusses activity diagrams, interaction overview diagrams, and business process models. It provides an overview of the key notations and uses of activity diagrams, including modeling business processes, use case flows, and system flows. The document also discusses interaction overview diagrams and business process model and notation (BPMN). Finally, it provides examples of activity diagrams for a hospital management system to illustrate how they can be used to model specific processes like registering a patient, maintaining a calendar, booking a consultation, and paying a bill.
An activity diagram visually presents a series of actions or flow of control in a system similar to a flowchart or a data flow diagram. They can also describe the steps in a use case diagram.
Activity Diagram Model An activity diagram visually presents a series of actions or flow of control in a system similar to a flowshart or a data flow diagram. Activity diagrams are often used in business process modeling.
Activity diagrams can be used to model workflows and business processes by showing the sequence and flow of activities. They are similar to flowcharts but also show decision points and parallel activities. Activity diagrams can address deficiencies in use case diagrams by showing the temporal order and flow when one use case uses others or extends another. Practical examples of using activity diagrams include modeling approval processes, invoice processes, or software development processes.
Use Case and Activity Diagrams Modeling NotationLeslie Munday
The document discusses use case and activity diagrams. It provides definitions of the components of use case diagrams, including actors, use cases, and relationships. It also defines the components of activity diagrams, such as activities, branches, forks, joins. The document explains how to represent business and application use cases using both use case diagrams and activity diagrams.
This document discusses using activity diagrams for business and systems modeling. It explains the basic and advanced elements of activity diagrams like activity states, transitions, decisions, synchronization bars, concurrent threads, alternative threads, conditional threads, nested activity diagrams and partitions. The objectives are to explain UML modeling, demonstrate activity diagram usage for business and systems modeling, apply activity diagram notations, and highlight common student mistakes.
The document introduces activity diagrams, which are like flow charts for modeling the flow of logic through a system. They define the workflow and how objects share responsibilities. The key elements of activity diagrams are described, and an example is provided to demonstrate how a simple game mechanic could be modeled step-by-step using activity diagrams.
The document discusses different approaches and methods for synchronizing team members during software development projects. It describes static waterfall and agile iterative development processes. It also introduces Unified Modeling Language (UML) diagrams for visually representing software architecture and interactions, including activity diagrams, sequence diagrams, and use case diagrams. These diagrams use standardized symbols and notation to clearly depict processes, objects, messages, and functionality.
The document provides an overview of Unified Modeling Language (UML). It discusses that UML is a standard modeling language used to visualize, specify and document artifacts of a software system. It then summarizes the history and evolution of UML from its origins combining different modeling approaches in the 1980s-1990s to the current version. The document also lists and briefly describes the main UML diagram types including class, use case, activity, sequence, collaboration, state chart, component and deployment diagrams. For each diagram type, it highlights the key elements and purpose.
The document provides an overview of activity diagrams, including what they are, their purpose, how to draw them, where to use them, and how they differ from flowchart diagrams. Activity diagrams illustrate the flow of activities from one to another and can show parallel, branched, and concurrent flows. They are used to model workflow, business requirements, and the functionalities and systems within an application. Key elements of activity diagrams include activities, flows, decisions, forks, and swimlanes.
Creately offers wide range of Activity Diagram Templates which can be edited instantly using our online Editor. We have listed several Activity Diagram Templates here, and you can find many more Activity Diagram templates on our diagram community as well. All our popular activity diagram templates are available for free. Just click on the "Use as Template" button to immediately start modifying it using our online diagramming tools.
This document presents information on activity diagrams in UML (Unified Modeling Language). It defines activity diagrams as representing the dynamic or behavioral view of a system through workflows and processes. The document outlines the basic notations used in activity diagrams, including activities, flows, decision/merge points, swimlanes, and more. It provides an example activity diagram of a student registration system and discusses limitations of activity diagrams in not conveying responsibility for activities.
A Suite of Metrics for UML Behavioral Diagrams based on Complexity Perspectivessebastianku31
Submit your Research Articles!!
International Journal of Software Engineering & Applications(IJSEA)
ISSN:0975-3834 [Online]; 0975-4679 [Print]
ERA Indexed, H Index 31
Web Page URL : https://airccse.org/journal/ijsea/ijsea.html
Current Issue link: https://www.airccse.org/journal/ijsea/vol15.html
A Suite of Metrics for UML Behavioral Diagrams based on Complexity Perspectives
Ann Wambui King’ori, Geoffrey Muchiri Muketha and John Gichuki Ndia, Murang’a University of Technology, Kenya
Abstract URL :https://aircconline.com/abstract/ijsea/v15n2/15224ijsea01.html
Article URL :https://aircconline.com/ijsea/V15N2/15224ijsea01.pdf
#Softwarecomplexity #softwaremetrics #UMLbehavioraldiagrams #qualityanalysis, #theoreticalvalidations
Submission System: https://airccse.com/submissioncs/home.html
Contact Us : ijseajournal@airccse.org or ijsea@aircconline.com
A use case diagram describes interactions between users and a system. It displays relationships between actors and use cases. Actors represent users or other systems interacting with the system being modeled. Use cases represent actions a user performs to complete a task. Use case diagrams are helpful early in projects to expose requirements and plan projects, and more use cases may be identified as projects continue.
The document contains an exam with questions about UML diagrams and the RUP methodology. It defines use case diagrams, use case specifications, activity diagrams, state diagrams, and deployment diagrams. It provides a comparative table highlighting differences between these diagram types. It also lists some differences between UML and RUP, specifically that UML is a modeling language while RUP is a software development process. Finally, it asks to create a conceptual map about use case diagrams.
UML stands for Unified Modelling Language.
UML is a standard language for specifying, visualizing, constructing, and documenting a system in which software represents the most significant part.
UML is different from the other common programming languages like C++, Java, COBOL etc.
UML is a pictorial language used to make software blue prints.
UML can serve as a central notation for software development process. Using UML helps project teams communicate, explore potential designs, and validate the architectural designs of software.
UML diagrams are made using notation of things and relationships.
The building blocks of UML can be defined as:
Things
Relationships
Diagrams
Things: Things are the most important building blocks of UML. Things can be:
Structural
Behavioral
Grouping
Annotational
The Structural things define the static part of the model. They represent physical and conceptual elements. Following are the brief descriptions of the structural things.
Class: Class represents set of objects having similar responsibilities.
Interface: Interface defines a set of operations which specify the responsibility of a class.
Collaboration: Collaboration defines interaction between elements.
Use case: Use case represents a set of actions performed by a system for a specific goal.
Component: Component describes physical part of a system.
Node: A node can be defined as a physical element that exists at run time.
A behavioral thing consists of the dynamic parts of UML models. Following are the behavioral things:
Interaction: Interaction is defined as a behavior that consists of a group of messages exchanged among elements to accomplish a specific task.
State machine: State machine is useful when the state of an object in its life cycle is important. It defines the sequence of states an object goes through in response to events. Events are external factors responsible for state change.
This document is a record notebook for a computer science student documenting the experiments completed in a CASE tools laboratory course. It contains details of 15 software systems developed during the course like passport automation, book banking, stock maintenance, etc. It also includes studies of UML diagrams like use case diagrams, sequence diagrams, class diagrams, etc. and how to connect a Visual Basic form to a Microsoft Access database.
This document provides an overview of modeling systems with the Unified Modeling Language (UML). It introduces UML diagrams including use case diagrams, which describe system functionality from the user perspective; class diagrams, which describe system structure through objects and relationships; and sequence diagrams, which describe object interactions and behavior over time. Examples of each diagram type are provided and explained. The key aspects of UML covered are its development from older techniques, its focus on functional, object, and dynamic models, and how different diagram types relate to different views of the system.
The document provides an introduction and overview of the Business Process Modeling Notation (BPMN). It discusses that BPMN was created to provide a standard notation that is understandable by all business users. BPMN defines graphical elements to develop simple diagrams that look like flowcharts. It categorizes the elements into flow objects, connecting objects, swimlanes, and artifacts. Flow objects include events, activities, and gateways. Connecting objects are sequence flows, message flows, and associations. Swimlanes separate activities using pools and lanes. BPMN aims to balance simplicity with the ability to model complex business processes.
Fyp list batch-2009 (project approval -rejected list)Mr SMAK
This document lists 29 final year projects for computer science students in the BS (CS) Batch of 2009 at Sir Syed University of Engineering & Technology in Karachi, Pakistan. It provides the roll numbers, names, project titles and assigned supervisors for each group of students. The remarks column notes whether project ideas were accepted, rejected or required revisions and additional consultation with supervisors.
The document contains 8 questions for an assignment on wireless application protocol. The questions cover topics such as comparing circuit-switched and packet-switched networks, frequency division multiplexing of voice channels, spread spectrum techniques, calculating bandwidth requirements for frequency division multiplexing with guard bands, advantages and disadvantages of bursty versus continuous data transmission in wireless systems, and disadvantages of wireless LANs compared to wired LANs. The last question discusses applications where the disadvantages of wireless LANs may be outweighed or override the advantages of wireless mobility.
This document provides an introduction to wireless communication and wireless application protocol (WAP). It discusses the benefits of wireless communication like freedom from wires and global coverage. It also covers some of the technical challenges in wireless communication like efficient use of spectrum, mobility support, and maintaining quality of service over unreliable links. It defines wireless communication and differentiates between wireless and mobile. It also describes various types of wireless technologies and their limitations.
The document summarizes the evolution of wireless networks from 1G to 4G. 1G networks used analog signals and standards like NMT, AMPS, and TACS. 2G introduced digital cellular and standards like GSM, CDMA, and IS-136. 2.5G provided upgrades like GPRS, EDGE, and CDMA2000 1x to support higher data rates. 3G networks supported broadband data and included W-CDMA and CDMA2000. 4G aims to provide fully integrated IP services with speeds over 100 Mbps.
Wireless Application Protocol (WAP) allows devices to access the Internet over wireless networks. There are three main categories of protocols for managing shared access to wireless networks: fixed assignment, demand assignment, and random assignment. Fixed assignment divides resources like frequency bands or time slots and allocates them exclusively. Demand assignment allocates resources only to nodes that need them. Random assignment does not preallocate resources and relies on collision detection and retransmission to manage shared access. Common protocols that fall under these categories include FDMA, TDMA, CDMA, ALOHA, and CSMA.
Wireless cellular networks divide geographic areas into cells served by base stations to allow for frequency reuse. As users travel between cells, their calls are handed off seamlessly. Cellular systems improve capacity by allocating unique frequency groups to each cell and reusing the same frequencies in cells sufficiently distant from each other. Larger networks connect multiple base stations and mobile switching centers to facilitate roaming and complete calls between mobile and fixed users.
This chapter discusses shared memory architecture and classifications of shared memory systems. It describes Uniform Memory Access (UMA), Non-Uniform Memory Access (NUMA), and Cache Only Memory Architecture (COMA). It also covers bus-based symmetric multiprocessors and basic cache coherency methods like write-through, write-back, write-invalidate, and write-update. Finally, it discusses snooping protocols for maintaining cache coherency, including write-invalidate and write-through, write-invalidate and write-back, write-once, write-update and partial write-through, and write-update and write-back.
This document discusses parallel computer memory architectures, including shared memory, distributed memory, and hybrid architectures. Shared memory architectures allow all processors to access a global address space, but lack scalability. Distributed memory assigns separate memory to each processor requiring explicit communication between tasks. Hybrid architectures combine shared memory within nodes and distributed memory between nodes for scalability.
This document discusses parallel computers and architectures. It defines parallel computers as collections of processing elements that cooperate and communicate to solve problems fast. It then examines questions about parallel computers, different types of parallelism, and opportunities for parallel computing in scientific and commercial applications. Finally, it discusses fundamental issues in parallel architectures, including naming, synchronization, latency and bandwidth, and different parallel frameworks and models like shared memory, message passing, and data parallelism.
This document provides an overview of parallel computing and parallel processing. It discusses:
1. The three types of concurrent events in parallel processing: parallel, simultaneous, and pipelined events.
2. The five fundamental factors for projecting computer performance: clock rate, cycles per instruction (CPI), execution time, million instructions per second (MIPS) rate, and throughput rate.
3. The four programmatic levels of parallel processing from highest to lowest: job/program level, task/procedure level, interinstruction level, and intrainstruction level.
This document discusses key concepts and terminologies related to parallel computing. It defines tasks, parallel tasks, serial and parallel execution. It also describes shared memory and distributed memory architectures as well as communications and synchronization between parallel tasks. Flynn's taxonomy is introduced which classifies parallel computers based on instruction and data streams as Single Instruction Single Data (SISD), Single Instruction Multiple Data (SIMD), Multiple Instruction Single Data (MISD), and Multiple Instruction Multiple Data (MIMD). Examples are provided for each classification.
This document provides an overview of a course on parallel computing for undergraduates. It outlines the theoretical and practical components of the course, including concepts that will be covered pre- and post-midterm. It also details assessment criteria, reading resources, and codes of conduct for the class.
This document discusses parallel computer memory architectures, including shared memory, distributed memory, and hybrid architectures. Shared memory architectures allow all processors to access a global address space, but lack scalability. Distributed memory assigns separate memory to each processor requiring explicit communication between tasks. Hybrid architectures combine shared memory within nodes and distributed memory between nodes for scalability.
This chapter discusses shared memory architecture and classifications of shared memory systems. It describes Uniform Memory Access (UMA), Non-Uniform Memory Access (NUMA), and Cache Only Memory Architecture (COMA). It also covers basic cache coherency methods like write-through, write-back, write-invalidate, and write-update. Finally, it discusses snooping protocols and cache coherency techniques used in shared memory systems.
Planning and scheduling involves fundamental engineering principles of first analyzing a problem and then developing a solution to meet defined needs. Key objectives include effective time management, optimizing the sequence of events, and defining necessary resources to ensure timely project progress. Gantt charts and PERT charts are common tools used to plan and schedule projects, with Gantt charts focusing more on calendar timelines and PERT charts emphasizing task dependencies. Function point analysis is an alternative technique for estimating the time and effort required for a software project based on identifying and weighting various user-requested application components and functionalities.
The document outlines a project plan structure covering 5 sections: 1) the software engineering process model and team roles, 2) risk analysis and management methods, 3) tasks and scheduling, 4) resources, costs and estimates, and 5) monitoring and management methods to track the project. A sample project plan is attached for reference.
The document outlines guidelines for formatting a final year project proposal. It includes sections for the project title, student names and roll numbers, main text formatting, headings formatting, figures and tables, and references. Guidelines are provided for font type, size, indentation, spacing, capitalization, and other formatting rules to maintain a consistent structure and appearance.
Students of the final year 2009 batch at Sir Syed University of Engineering & Technology are advised to submit 3 copies of their final year project proposals by March 03, 2012. The proposals can be in the areas of artificial intelligence, expert systems, communication & networking, 3D applications, mobile computing, or web applications. Proposals should be submitted to faculty members Naheed Khan, Shardha Nand, Asharaf Ali Waseem, or M. Kashif Khan. Projects must be completed by groups of 3 to 4 students, who will later defend their proposal to the final year project committee.
This document outlines 29 potential projects for university students to undertake with SUPARCO. The projects range from designing components of small satellites to analyzing aerodynamic properties to developing encryption systems. SUPARCO will provide funding and engineering support for selected projects. Students will gain hands-on experience working on challenges relevant to SUPARCO's objectives.
The document outlines the timeline and assessment policy for final year projects (FYP) for computer science students graduating in 2009 from Sir Syed University of Engineering & Technology in Karachi, Pakistan. Key dates are provided for submitting registration forms, proposals, requirements documents, design documents, progress reviews, reports and presentations. The assessment policy breaks down the project into components like requirements, design, presentations and reviews, allocating marks between supervisor and evaluation committee assessments with the total project marks equalling 200.
UiPath Test Automation using UiPath Test Suite series, part 5DianaGray10
Welcome to UiPath Test Automation using UiPath Test Suite series part 5. In this session, we will cover CI/CD with devops.
Topics covered:
CI/CD with in UiPath
End-to-end overview of CI/CD pipeline with Azure devops
Speaker:
Lyndsey Byblow, Test Suite Sales Engineer @ UiPath, Inc.
Maruthi Prithivirajan, Head of ASEAN & IN Solution Architecture, Neo4j
Get an inside look at the latest Neo4j innovations that enable relationship-driven intelligence at scale. Learn more about the newest cloud integrations and product enhancements that make Neo4j an essential choice for developers building apps with interconnected data and generative AI.
Unlocking Productivity: Leveraging the Potential of Copilot in Microsoft 365, a presentation by Christoforos Vlachos, Senior Solutions Manager – Modern Workplace, Uni Systems
Why You Should Replace Windows 11 with Nitrux Linux 3.5.0 for enhanced perfor...SOFTTECHHUB
The choice of an operating system plays a pivotal role in shaping our computing experience. For decades, Microsoft's Windows has dominated the market, offering a familiar and widely adopted platform for personal and professional use. However, as technological advancements continue to push the boundaries of innovation, alternative operating systems have emerged, challenging the status quo and offering users a fresh perspective on computing.
One such alternative that has garnered significant attention and acclaim is Nitrux Linux 3.5.0, a sleek, powerful, and user-friendly Linux distribution that promises to redefine the way we interact with our devices. With its focus on performance, security, and customization, Nitrux Linux presents a compelling case for those seeking to break free from the constraints of proprietary software and embrace the freedom and flexibility of open-source computing.
Securing your Kubernetes cluster_ a step-by-step guide to success !KatiaHIMEUR1
Today, after several years of existence, an extremely active community and an ultra-dynamic ecosystem, Kubernetes has established itself as the de facto standard in container orchestration. Thanks to a wide range of managed services, it has never been so easy to set up a ready-to-use Kubernetes cluster.
However, this ease of use means that the subject of security in Kubernetes is often left for later, or even neglected. This exposes companies to significant risks.
In this talk, I'll show you step-by-step how to secure your Kubernetes cluster for greater peace of mind and reliability.
Dr. Sean Tan, Head of Data Science, Changi Airport Group
Discover how Changi Airport Group (CAG) leverages graph technologies and generative AI to revolutionize their search capabilities. This session delves into the unique search needs of CAG’s diverse passengers and customers, showcasing how graph data structures enhance the accuracy and relevance of AI-generated search results, mitigating the risk of “hallucinations” and improving the overall customer journey.
In his public lecture, Christian Timmerer provides insights into the fascinating history of video streaming, starting from its humble beginnings before YouTube to the groundbreaking technologies that now dominate platforms like Netflix and ORF ON. Timmerer also presents provocative contributions of his own that have significantly influenced the industry. He concludes by looking at future challenges and invites the audience to join in a discussion.
Sudheer Mechineni, Head of Application Frameworks, Standard Chartered Bank
Discover how Standard Chartered Bank harnessed the power of Neo4j to transform complex data access challenges into a dynamic, scalable graph database solution. This keynote will cover their journey from initial adoption to deploying a fully automated, enterprise-grade causal cluster, highlighting key strategies for modelling organisational changes and ensuring robust disaster recovery. Learn how these innovations have not only enhanced Standard Chartered Bank’s data infrastructure but also positioned them as pioneers in the banking sector’s adoption of graph technology.
LF Energy Webinar: Electrical Grid Modelling and Simulation Through PowSyBl -...DanBrown980551
Do you want to learn how to model and simulate an electrical network from scratch in under an hour?
Then welcome to this PowSyBl workshop, hosted by Rte, the French Transmission System Operator (TSO)!
During the webinar, you will discover the PowSyBl ecosystem as well as handle and study an electrical network through an interactive Python notebook.
PowSyBl is an open source project hosted by LF Energy, which offers a comprehensive set of features for electrical grid modelling and simulation. Among other advanced features, PowSyBl provides:
- A fully editable and extendable library for grid component modelling;
- Visualization tools to display your network;
- Grid simulation tools, such as power flows, security analyses (with or without remedial actions) and sensitivity analyses;
The framework is mostly written in Java, with a Python binding so that Python developers can access PowSyBl functionalities as well.
What you will learn during the webinar:
- For beginners: discover PowSyBl's functionalities through a quick general presentation and the notebook, without needing any expert coding skills;
- For advanced developers: master the skills to efficiently apply PowSyBl functionalities to your real-world scenarios.
Goodbye Windows 11: Make Way for Nitrux Linux 3.5.0!SOFTTECHHUB
As the digital landscape continually evolves, operating systems play a critical role in shaping user experiences and productivity. The launch of Nitrux Linux 3.5.0 marks a significant milestone, offering a robust alternative to traditional systems such as Windows 11. This article delves into the essence of Nitrux Linux 3.5.0, exploring its unique features, advantages, and how it stands as a compelling choice for both casual users and tech enthusiasts.
Generative AI Deep Dive: Advancing from Proof of Concept to ProductionAggregage
Join Maher Hanafi, VP of Engineering at Betterworks, in this new session where he'll share a practical framework to transform Gen AI prototypes into impactful products! He'll delve into the complexities of data collection and management, model selection and optimization, and ensuring security, scalability, and responsible use.
Full-RAG: A modern architecture for hyper-personalizationZilliz
Mike Del Balso, CEO & Co-Founder at Tecton, presents "Full RAG," a novel approach to AI recommendation systems, aiming to push beyond the limitations of traditional models through a deep integration of contextual insights and real-time data, leveraging the Retrieval-Augmented Generation architecture. This talk will outline Full RAG's potential to significantly enhance personalization, address engineering challenges such as data management and model training, and introduce data enrichment with reranking as a key solution. Attendees will gain crucial insights into the importance of hyperpersonalization in AI, the capabilities of Full RAG for advanced personalization, and strategies for managing complex data integrations for deploying cutting-edge AI solutions.
Observability Concepts EVERY Developer Should Know -- DeveloperWeek Europe.pdfPaige Cruz
Monitoring and observability aren’t traditionally found in software curriculums and many of us cobble this knowledge together from whatever vendor or ecosystem we were first introduced to and whatever is a part of your current company’s observability stack.
While the dev and ops silo continues to crumble….many organizations still relegate monitoring & observability as the purview of ops, infra and SRE teams. This is a mistake - achieving a highly observable system requires collaboration up and down the stack.
I, a former op, would like to extend an invitation to all application developers to join the observability party will share these foundational concepts to build on:
Enchancing adoption of Open Source Libraries. A case study on Albumentations.AIVladimir Iglovikov, Ph.D.
Presented by Vladimir Iglovikov:
- https://www.linkedin.com/in/iglovikov/
- https://x.com/viglovikov
- https://www.instagram.com/ternaus/
This presentation delves into the journey of Albumentations.ai, a highly successful open-source library for data augmentation.
Created out of a necessity for superior performance in Kaggle competitions, Albumentations has grown to become a widely used tool among data scientists and machine learning practitioners.
This case study covers various aspects, including:
People: The contributors and community that have supported Albumentations.
Metrics: The success indicators such as downloads, daily active users, GitHub stars, and financial contributions.
Challenges: The hurdles in monetizing open-source projects and measuring user engagement.
Development Practices: Best practices for creating, maintaining, and scaling open-source libraries, including code hygiene, CI/CD, and fast iteration.
Community Building: Strategies for making adoption easy, iterating quickly, and fostering a vibrant, engaged community.
Marketing: Both online and offline marketing tactics, focusing on real, impactful interactions and collaborations.
Mental Health: Maintaining balance and not feeling pressured by user demands.
Key insights include the importance of automation, making the adoption process seamless, and leveraging offline interactions for marketing. The presentation also emphasizes the need for continuous small improvements and building a friendly, inclusive community that contributes to the project's growth.
Vladimir Iglovikov brings his extensive experience as a Kaggle Grandmaster, ex-Staff ML Engineer at Lyft, sharing valuable lessons and practical advice for anyone looking to enhance the adoption of their open-source projects.
Explore more about Albumentations and join the community at:
GitHub: https://github.com/albumentations-team/albumentations
Website: https://albumentations.ai/
LinkedIn: https://www.linkedin.com/company/100504475
Twitter: https://x.com/albumentations
Enchancing adoption of Open Source Libraries. A case study on Albumentations.AI
Lab # 05
1. Advance Software Engineering UML Diagram
LAB # 05
Objective:
• To understand Activity Diagram.
The Activity Diagram
The purpose of the activity diagram is to model the procedural flow of actions that are part of a
larger activity. In projects in which use cases are present, activity diagrams can model a specific
use case at a more detailed level. However, activity diagrams can be used independently of use
cases for modeling a business-level function, it models procedural flow, the activity diagram
focuses on the action sequence of execution and the conditions that trigger or guard those
actions. The activity diagram is also focused only on the activity's internal actions and not on the
actions that call the activity in their process flow or that trigger the activity according to some
event.
Although UML sequence diagrams can protray the same information as activity diagrams, but
activity diagrams show all potential sequence flows in an activity, whereas a sequence diagram
typically shows only one flow of an activity.
The basics
Consider the action element in an activity diagram, whose official UML name is action state. An
action is indicated on the activity diagram by a "capsule" shape. The text inside it indicates the
action (e.g., Customer Calls Ticket Office or Registration Office Opens).
Figure 1: A sample action that is part of an activity diagram.
Because activity diagrams show a sequence of actions, they must indicate the starting point of
the sequence. The initial state is drawn as a solid circle with a transition line (arrow) that
connects it to the first action in the activity's sequence of actions. Figure 2 shows what an
activity diagram's initial state looks like.
It is important to note that there can be only one initial state on an activity diagram and only one
1
2. Advance Software Engineering UML Diagram
transition line connecting the initial state to an action. Although it may seem obvious that an
activity can have only one initial state, there are certain circumstances -- namely, the
commencement of asynchronous action sequences -- that may suggest that a new initial state
should be indicated in the activity diagram. UML does not allow this. Figure 3 offers an example
of an incorrect activity diagram, because the initial state has two transition lines that point to two
activities.
Figure 3: Incorrect rendering of an initial state within an activity
diagram. The initial state can indicate only ONE action.
The activity's flow terminates when the transition line of the last action in the sequence connects
to a "final state" symbol, which is a bullseye (a circle surrounding a smaller solid circle).
Beyond the basics
Activities modeled for real software development projects include decision points that control
what actions take place. And sometimes activities have parallel actions.
Decision points
Typically, decisions need to be made throughout an activity, depending on the outcome of a
specific prior action. In creating the activity diagram for such cases, you might need to model
two or more different sequences of actions. The UML specification provides two ways to model
decisions like this. The first way is to show a single transition line coming out of an action and
connecting to a decision point. The UML specification name for a decision point is decision, and
it is drawn as a diamond on an activity diagram. Since a decision will have at least two different
outcomes, the decision symbol will have multiple
transition lines connecting to different actions. Figure 5
shows a fragment of a sample activity diagram with a
decision.
Figure 5: A decision point models a choice that must be made
within the sequence of actions.
2
3. Advance Software Engineering UML Diagram
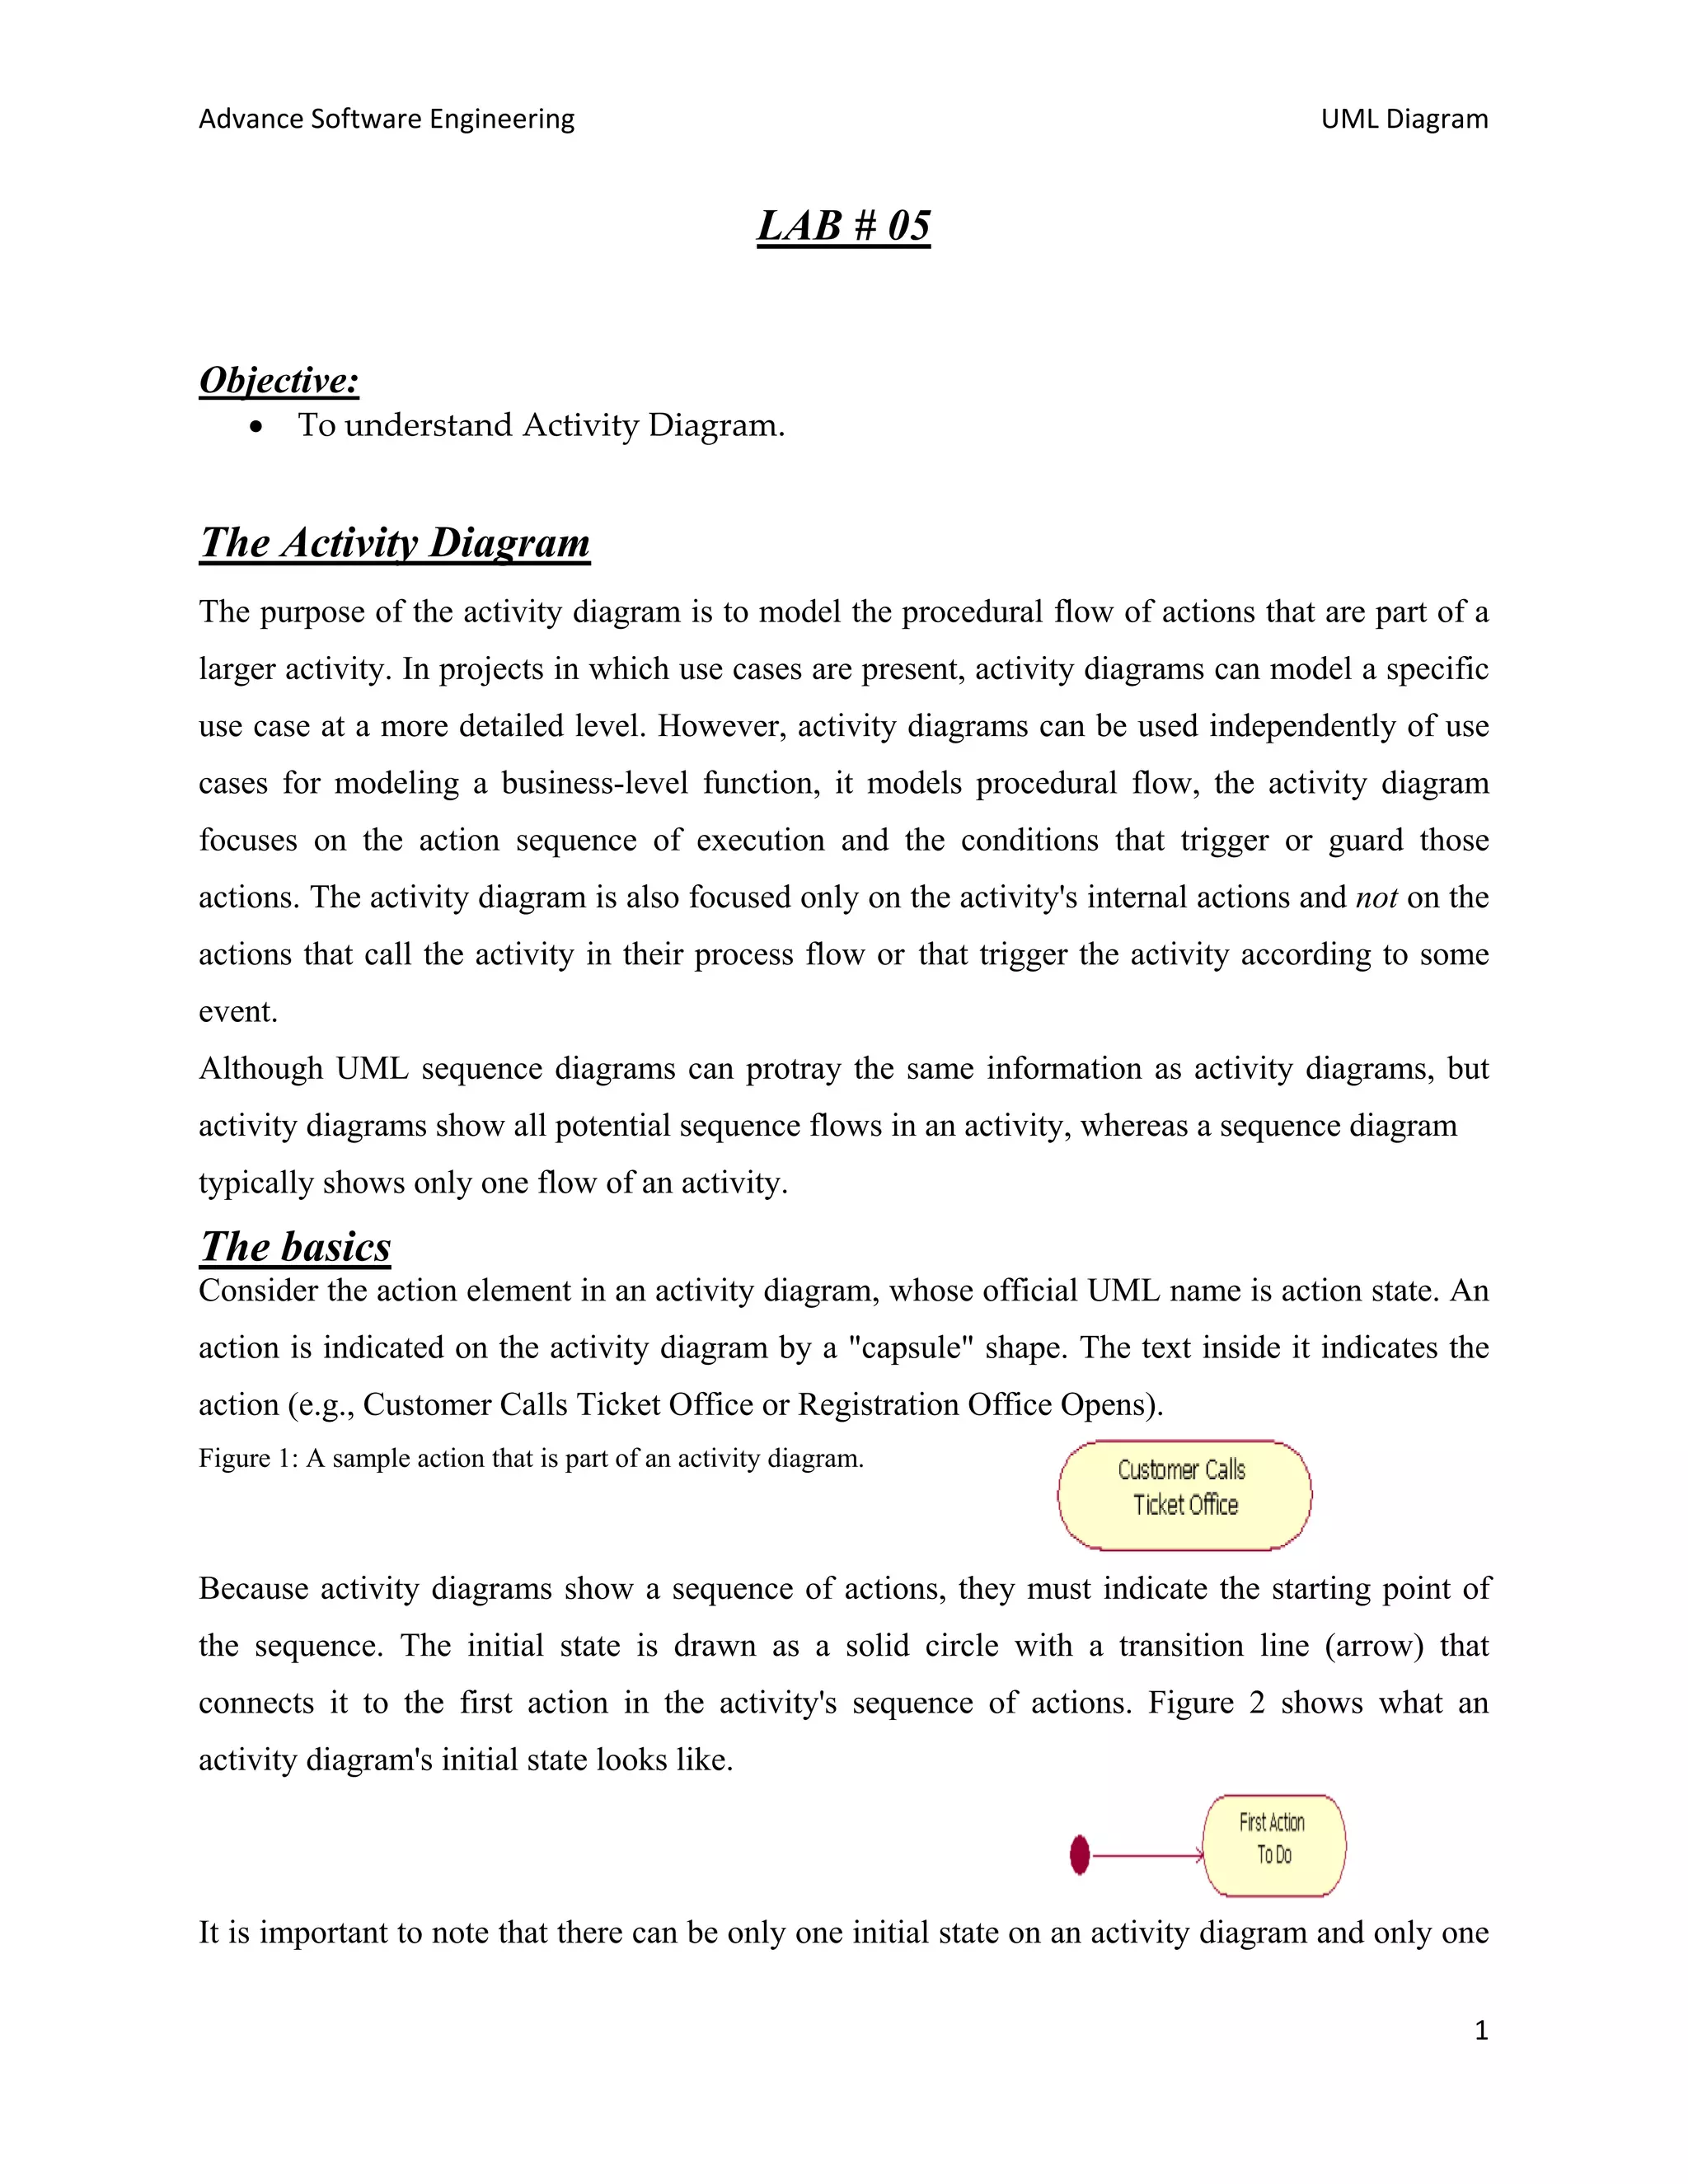
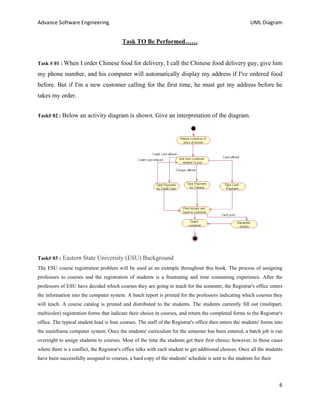
As shown in Figure 5, each transition line involved in a decision point must be labeled with text
above it to indicate "guard conditions," commonly abbreviated as guards. Guard condition text is
always placed in brackets -- for example, [guard condition text]. A guard condition explicitly
tells when to follow a transition line to the next action. According to the decision point shown in
Figure 5, a bartender (user) only needs to "make sure the customer is at least 21 years old" when
the customer orders an alcoholic drink. If the customer orders any other type of drink (the "else"
condition), then the bartender simply gets the drink for the customer. The [else] guard is
commonly used in activity diagrams to mean "if none of the other guarded transition lines
matches the actual condition," then follow the [else] transition line.
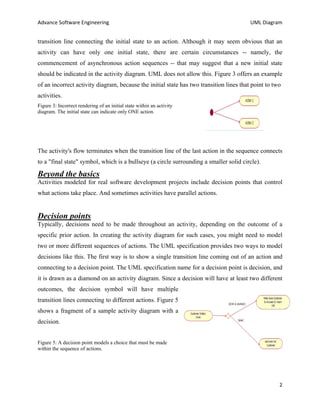
Merge points
Sometimes the procedural flow from one decision path may connect back to another decision
path, as shown in Figure 6 at the "Customer's Age > = 21" condition. In these cases, we connect
two or more action paths together using the same diamond icon with multiple paths pointing to
it, but with only one transition line coming out of it. This does not indicate a decision point, but
rather a merge.
Figure 6 shows the same decision as in Figure 5, but Figure 6 expands the activity diagram.
Performing a check of the customer's age leads the user to a second decision: If the customer is
younger than 21, the bartender must tell the customer to order another non-alcoholic drink,
which takes our sequence back to the action "Customer Orders Drink." However, if the customer
is 21 years old or older, then our action sequence takes take us to the same action the bartender
would follow if the person had ordered a non-alcoholic drink: "Get Drink For Customer."
Figure 6: A partial activity diagram, showing
two decision points
("Drink is alcoholic" and "Customer's age <
21") and one merge
("else" and "Customer's age >= 21")
3
4. Advance Software Engineering UML Diagram
Synch states for asynchronous actions
When modeling activities, you sometimes need to show that certain action sequences can be
done in parallel, or asynchronously. A special notation element allows you to show parallel
action sequences, or synch states. To be clear, a synch state that forks actions into two or more
threads represents a de-synchronizing of the flow (asynchronous actions), and a synch state that
joins actions back together represents a return to synchronized flow. A synch state is drawn as a
thick, solid line with transition lines coming into it from the left (usually) and out of it on the
right (usually). To draw a synch state that forks the action sequence into multiple threads, first
connect a transition line from the action preceding the parallel sequence to the synch state. Then
draw two transition lines coming out of the synch state, each connecting to its own action. Figure
9 is an activity diagram fragment that shows the forking of execution modeled.
Figure 9: A thick, solid line indicates a synch state, allowing two or
more action sequences to proceed in parallel.
4
5. Advance Software Engineering UML Diagram
Swim lanes
In activity diagrams, it is often useful to model the activity's procedural flow of control between
the objects (persons, organizations, or other responsible entities) that actually execute the action.
To do this, you can add swim lanes to the activity diagram (swim lanes are named for their
resemblance to the straight-line boundaries between two or more competitors at a swim meet).
To put swim lanes on an activity diagram, use vertical columns. For each object that executes
one or more actions, assign a column its name, placed at the top of the column. Then place each
action associated with an object in that object's swim
lane. Figure 12 shows that two objects execute actions
(e.g., Band Manager and Reporting Tool). The Band
Manager object executes the "Selects the View Sales For
My Band Report" action, and the Reporting Tool
executes the "Retrieve Bands the Band Manager
Manages" action. It is important to note that, although
using swimlanes improves the clarity of an activity
diagram (since all the activities are placed in the
swimlanes of their respective executor objects), all the previously mentioned rules governing
activity diagrams still hold true. In other words, you read the activity diagram just like you would
if no swimlanes were used.
5
6. Advance Software Engineering UML Diagram
Task TO Be Performed……
Task # 01 : When I order Chinese food for delivery, I call the Chinese food delivery guy, give him
my phone number, and his computer will automatically display my address if I've ordered food
before. But if I'm a new customer calling for the first time, he must get my address before he
takes my order.
Task# 02 : Below an activity diagram is shown. Give an interpretation of the diagram.
Task# 03 : Eastern State University (ESU) Background
The ESU course registration problem will be used as an example throughout this book. The process of assigning
professors to courses and the registration of students is a frustrating and time consuming experience. After the
professors of ESU have decided which courses they are going to teach for the semester, the Registrar's office enters
the information into the computer system. A batch report is printed for the professors indicating which courses they
will teach. A course catalog is printed and distributed to the students. The students currently fill out (mulitpart,
multicolor) registration forms that indicate their choice in courses, and return the completed forms to the Registrar's
office. The typical student load is four courses. The staff of the Registrar's office then enters the students' forms into
the mainframe computer system. Once the students' curriculum for the semester has been entered, a batch job is run
overnight to assign students to courses. Most of the time the students get their first choice; however, in those cases
where there is a conflict, the Registrar's office talks with each student to get additional choices. Once all the students
have been successfully assigned to courses, a hard copy of the students' schedule is sent to the students for their
6
7. Advance Software Engineering UML Diagram
verification. Most student registrations are processed within a week, but some exceptional cases take up to two
weeks to solve. Once the initial registration period is completed, professors receive a student roster for each course
they are scheduled to teach. Draw an activity diagram for the senerio described above.
Task # 04 Draw an activity diagram models the business process of enrolling in a university, takes this approach. A
student gets enrolled in the university if the form filled is correct otherwise a help system is available. If student
successfully get enrolled in the university he/she can attend classes can enrolled in the seminar committee and need
to pay library fee as well.
Task # 05 Create an activity diagram describing the process of a person (user) using the machine to buy a ticket
from Hamburg to Lübeck. Actually, the machine only takes coins (no credit cards, debit cards).
Task # 06 Create a sequence diagram for the following collaboration. Use the classes and methods on the next slide.
A customer wants to draw money from his bank account. He enters his card into an ATM (automated teller
machine). The ATM machine prompts „Enter PIN“. The customer enters his PIN. The ATM (internally) retrieves
the bank account number from the card. The ATM encrypts the PIN and the account number and sends it over to the
bank. The bank verifies the encrypted Account and PIN number. If the PIN number is correct, the ATM displays
„Enter amount“, draws money from the bank account and pays out the amount.(Use Swimlanes)
7