Download to read offline
![-Gene Sher
Software Development Processes:
Those in engineering and science will sooner or later either be members of teams solving some large
project, or be managing teams solving some large project. There needs to be a way in which to
synchronize the members of the team and the project development, so that everyone on the team knows
what parts they must complete, and when, without interfering with the work being done by other
members of the team. For this purpose, when working on large projects, there needs to be a
synchronizing process that puts all the members of the team on the same page, and so that all the
members know what they must work on. There are two main approaches to synchronizing the team
members on a project, 1. using a static method, and 2. using an agile method.
-The most standard and oldest software development process is the waterfall model. It is composed of
the following steps:
1. Requirements Specifications
2. Design
3. Implementation
4. Integration
5. Testing
6. Installation
7. Maintenance
A static approach is very useful because it can be planned out to completion at the very start of the
project, and each part could then be assigned to every team member. Within a company, this also allows
for technical writers to begin working on documentation based on the requirements section of the
document.
In a competitive market though, a company can not wait two or three years to produce a polished
product. For example, assume that you're developing a software product using the static model, and
that you will have a full product produced in 1 year. But your competitor in the same area has decided
to release their unpolished version a few months before you. A number of costumers will start using
your competitor's product, and while they are doing so they will become more familiar with its
interface, and begin establishing repore with that company. Thus, even though you might release a
better and more polished product a few months after your competitor, there will be a large portion of
the market that is already used to your competitor's product, and thus they will not be willing to switch.
An iterative and agile approach to product development allows you to get to market before the
competition. In software, first mover advantage [1] is significant
The agile approaches to software development, like XP and Scrum for example, are more flexible.
They are constantly interacting with their costumers, and based on this feedback adjust various features
of the product, dropping some, adding others. But there is an overhead to agile development, and that
overhead is team synchronization. Every time a feature of a product is changed, there needs to be
another meeting, and document specifications have to be rewritten or readjusted. Also, if there is a
documentation team, they might have to rewrite things again and again if features keep changing on
monthly bases for example. For this reason there is now a market opening for startups creating agile
project management tools[2], allowing for an easier documentation exchange, synchronization,
distribution and assignment of work within the team.
[1] http://en.wikipedia.org/wiki/First-mover_advantage
[2] http://www.acunote.com](https://image.slidesharecdn.com/uml-examples-150113120533-conversion-gate01/85/Uml-examples-1-320.jpg)
![-Gene Sher
Software Development Processes:
Those in engineering and science will sooner or later either be members of teams solving some large
project, or be managing teams solving some large project. There needs to be a way in which to
synchronize the members of the team and the project development, so that everyone on the team knows
what parts they must complete, and when, without interfering with the work being done by other
members of the team. For this purpose, when working on large projects, there needs to be a
synchronizing process that puts all the members of the team on the same page, and so that all the
members know what they must work on. There are two main approaches to synchronizing the team
members on a project, 1. using a static method, and 2. using an agile method.
-The most standard and oldest software development process is the waterfall model. It is composed of
the following steps:
1. Requirements Specifications
2. Design
3. Implementation
4. Integration
5. Testing
6. Installation
7. Maintenance
A static approach is very useful because it can be planned out to completion at the very start of the
project, and each part could then be assigned to every team member. Within a company, this also allows
for technical writers to begin working on documentation based on the requirements section of the
document.
In a competitive market though, a company can not wait two or three years to produce a polished
product. For example, assume that you're developing a software product using the static model, and
that you will have a full product produced in 1 year. But your competitor in the same area has decided
to release their unpolished version a few months before you. A number of costumers will start using
your competitor's product, and while they are doing so they will become more familiar with its
interface, and begin establishing repore with that company. Thus, even though you might release a
better and more polished product a few months after your competitor, there will be a large portion of
the market that is already used to your competitor's product, and thus they will not be willing to switch.
An iterative and agile approach to product development allows you to get to market before the
competition. In software, first mover advantage [1] is significant
The agile approaches to software development, like XP and Scrum for example, are more flexible.
They are constantly interacting with their costumers, and based on this feedback adjust various features
of the product, dropping some, adding others. But there is an overhead to agile development, and that
overhead is team synchronization. Every time a feature of a product is changed, there needs to be
another meeting, and document specifications have to be rewritten or readjusted. Also, if there is a
documentation team, they might have to rewrite things again and again if features keep changing on
monthly bases for example. For this reason there is now a market opening for startups creating agile
project management tools[2], allowing for an easier documentation exchange, synchronization,
distribution and assignment of work within the team.
[1] http://en.wikipedia.org/wiki/First-mover_advantage
[2] http://www.acunote.com](https://image.slidesharecdn.com/uml-examples-150113120533-conversion-gate01/75/Uml-examples-1-2048.jpg)
![UML:
Software projects are usually large and complex, composed of multiple interacting modules. There is a
need to represent the interacting modules and the architecture of the project in a manner that is easy to
grasp. Rather than writing pages upon pages of how each particular module and function within a
larger project are interacting with each other, a visual diagram can much more rapidly be absorbed by
team members. Also, it is much easier to diagram the various parts of the software, and then assign
those parts to the members. Through a diagram each member would know exactly what part he is
working on, and how it functions with relation to the other modules in the project, as shown in Fig-1.
Fig-1: An example diagram of a 3 module Neural Network software, each isolated module assigned to
a different team member.
Different diagramming methods have different advantages and disadvantages. The following 3
diagramming methods are used within the assigned homework:
1. Activity Diagram [3]
2. Use Case Diagram [4]
3. Sequence Diagram [5]
Activity Diagram
Quoted from [3]: “Activity Diagrams: are graphical representations of workflows of stepwise
activities and actions with support for choice, iteration and concurrency. Activity diagrams are
constructed from a limited number of shapes, connected with arrows. The most important shape types:
• rounded rectangles represent activities;
• diamonds represent decisions;
• bars represent the start (split) or end (join) of concurrent activities;
• a black circle represents the start (initial state) of the work-flow;
• an encircled black circle represents the end (final state).
Arrows run from the start towards the end and represent the order in which activities happen.” These
most often used shapes are shown in Fig-2, with an example of a model in Fig-3..
NN Project
Sensor
Modules
Neuron
Modules
Actuator
Modules
Interface Protocol
Jack Max Sally](https://image.slidesharecdn.com/uml-examples-150113120533-conversion-gate01/85/Uml-examples-2-320.jpg)
![Fig-2: Most important activity diagram shapes
Fig-3: Activity diagram of the brainstorming process.
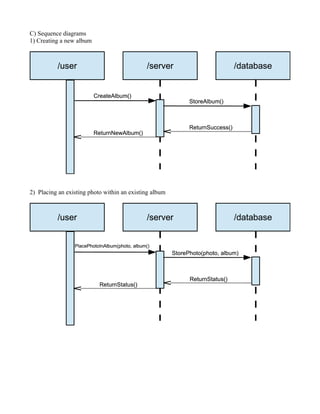
Sequence Diagram:
Quoted from [4]. “Sequence Diagrams: show how processes operate with one another and in what
order. A sequence diagram shows, as parallel vertical lines (lifelines), different processes or objects that
live simultaneously, and, as horizontal arrows, the messages exchanged between them, in the order in
which they occur.”
Sequence Diagrams are excellent for representing message passing of parallel processes. If you've ever
taken a computer networking class and remember the diagrams drawn, with messages being passed
Start, Initial State
Activity Decision
End, Final State
Split into concurrent
activities
Join from concurrent
activities](https://image.slidesharecdn.com/uml-examples-150113120533-conversion-gate01/85/Uml-examples-3-320.jpg)
![“Diagram Building blocks:
If the lifeline is that of an object, it demonstrates a role. Note that leaving the instance name blank can
represent anonymous and unnamed instances.
In order to display interaction, messages are used. These are horizontal arrows with the message name
written above them. Solid arrows with full heads are synchronous calls, solid arrows with stick heads
are asynchronous calls and dashed arrows with stick heads are return messages.
Activation boxes, or method-call boxes, are opaque rectangles drawn on top of lifelines to represent
that processes are being performed in response to the message.
Objects calling methods on themselves use messages and add new activation boxes on top of any others
to indicate a further level of processing.
When an object is destroyed (removed from memory), an X is drawn on top of the lifeline, and the
dashed line ceases to be drawn below it. It should be the result of a message, either from the object
itself, or another.
A message sent from outside the diagram can be represented by a message originating from a filled-in
circle or from a border of sequence diagram.”
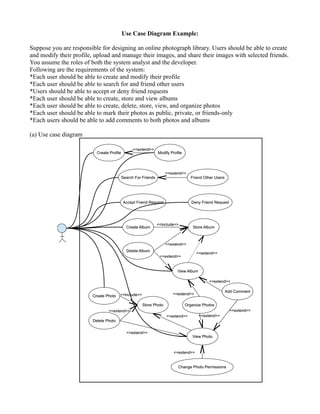
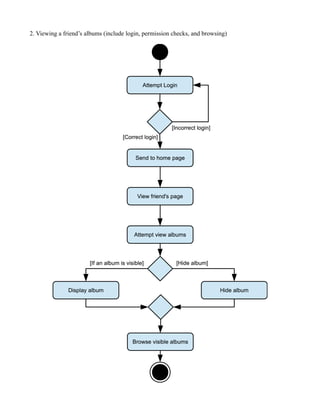
Use Case Diagram:
Quoted from [5]: Use Case Diagram: is a type of behavioral diagram defined by and created from a
Use-cases analysis. Its purpose is to present a graphical overview of the functionality provided by a
system in terms of actors, their goals (represented as use cases), and any dependencies between those
use cases. The main purpose of a use case diagram is to show what system functions are performed for
which actor.
Diagram Building Blocks:
Use cases : A use case describes a sequence of actions that provide something of measurable value to
an actor and is drawn as a horizontal ellipse.
Actors: An actor is a person, organization, or external system that plays a role in one or more
interactions with the system.
System boundary boxes (optional) : A rectangle is drawn around the use cases, called the system
boundary box, to indicate the scope of system. Anything within the box represents functionality that is
in scope and anything outside the box is not.
Include: In one form of interaction, a given use case may include another. "Include is a Directed
Relationship between two use cases, implying that the behavior of the included use case is inserted into
the behavior of the including use case".
The first use case often depends on the outcome of the included use case. This is useful for extracting
truly common behaviors from multiple use cases into a single description. The notation is a dashed
arrow from the including to the included use case, with the label "«include»". This usage resembles a
macro expansion where the included use case behavior is placed in-line in the base use case behavior.
There are no parameters or return values. To specify the location in a flow of events in which the base
use case includes the behavior of another, you simply write include followed by the name of use case
you want to include.
Extend: In another form of interaction, a given use case (the extension) may extend another. The
relationship indicates that the behavior of the extension use case may be inserted in the extended use
case under some conditions. The notation is a dashed arrow from the extension to the extended use](https://image.slidesharecdn.com/uml-examples-150113120533-conversion-gate01/85/Uml-examples-5-320.jpg)

![Fig-5: Use case diagram example, simpler restaurant model.
Fig-6: Use case diagram building blocks.
[3] http://en.wikipedia.org/wiki/Activity_diagram
[4] http://en.wikipedia.org/wiki/Sequence_diagram
[5] http://en.wikipedia.org/wiki/Use_case_diagram
Use Case
Actor
Use Case-A Use Case-B
<<include>>
including included
Use case-A depends on use case-B
Use Case-A Use Case-B
<<extend>>
extended extension
Use case-B could be included (optional) in use case-A
Use Case-A Use Case-B
general specialized
Use CaseActor
association
System boundary box
Represents
scope of
system.
Everything
inside is within
scope.](https://image.slidesharecdn.com/uml-examples-150113120533-conversion-gate01/85/Uml-examples-7-320.jpg)


The document discusses different approaches and methods for synchronizing team members during software development projects. It describes static waterfall and agile iterative development processes. It also introduces Unified Modeling Language (UML) diagrams for visually representing software architecture and interactions, including activity diagrams, sequence diagrams, and use case diagrams. These diagrams use standardized symbols and notation to clearly depict processes, objects, messages, and functionality.


![[RPL2] Pertemuan 3 - UML dan USECASE VIEW](https://cdn.slidesharecdn.com/ss_thumbnails/rpl2pertemuan3-umldanusecaseview-181013010605-thumbnail.jpg?width=640&height=640&fit=bounds)