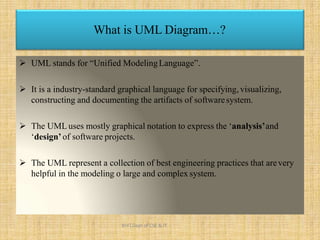
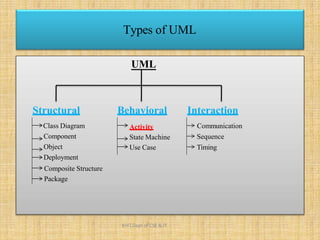
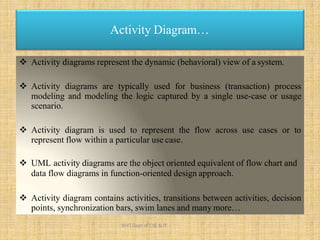
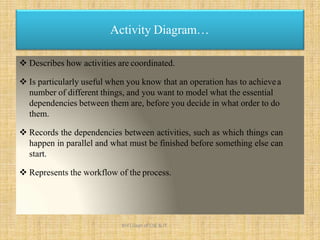
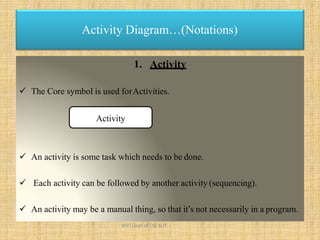
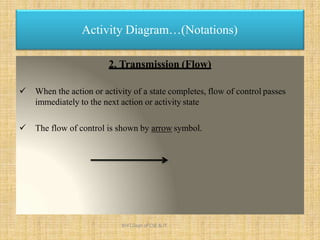
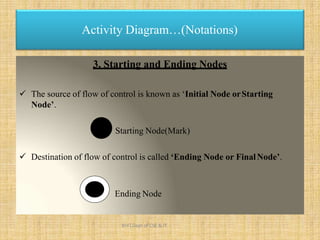
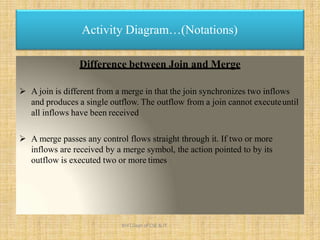
This document presents information on activity diagrams in UML (Unified Modeling Language). It defines activity diagrams as representing the dynamic or behavioral view of a system through workflows and processes. The document outlines the basic notations used in activity diagrams, including activities, flows, decision/merge points, swimlanes, and more. It provides an example activity diagram of a student registration system and discusses limitations of activity diagrams in not conveying responsibility for activities.


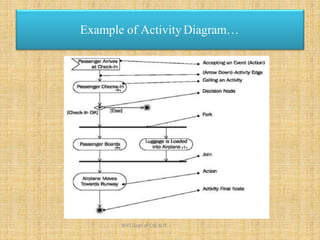
![Example of Activity Diagram…
Fill-in
form
Check
form
[Incorrect]
[Correct]
Displaystudent
screen
Inputstudent
information Searchfor Student
selection list
Verifythe
applications
Regretmessage
Createrecord
Regret
registration
[NoMatch]
[Match]
[NotFound]
[Found]
1
Student
KHIT,Dept of CSE & IT
RegistrarSystem](https://image.slidesharecdn.com/lecture19-201013111503/85/Lecture-19-unit-3-se-16-320.jpg)