Download to read offline


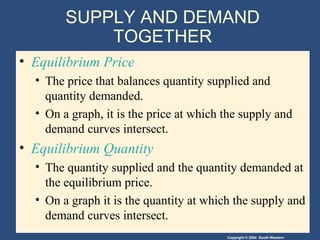
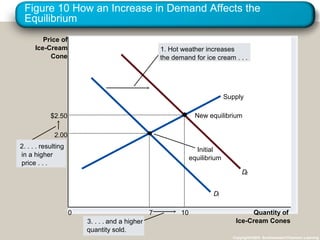

1. The document discusses the economic concepts of supply and demand, and how they determine market equilibrium price and quantity. 2. It explains that equilibrium is reached at the price where the quantity suppliers are willing to sell equals the quantity demanded by buyers. 3. When supply or demand shifts due to changes in factors like costs, preferences, or number of market participants, the equilibrium price and quantity also change to bring the market back into balance.