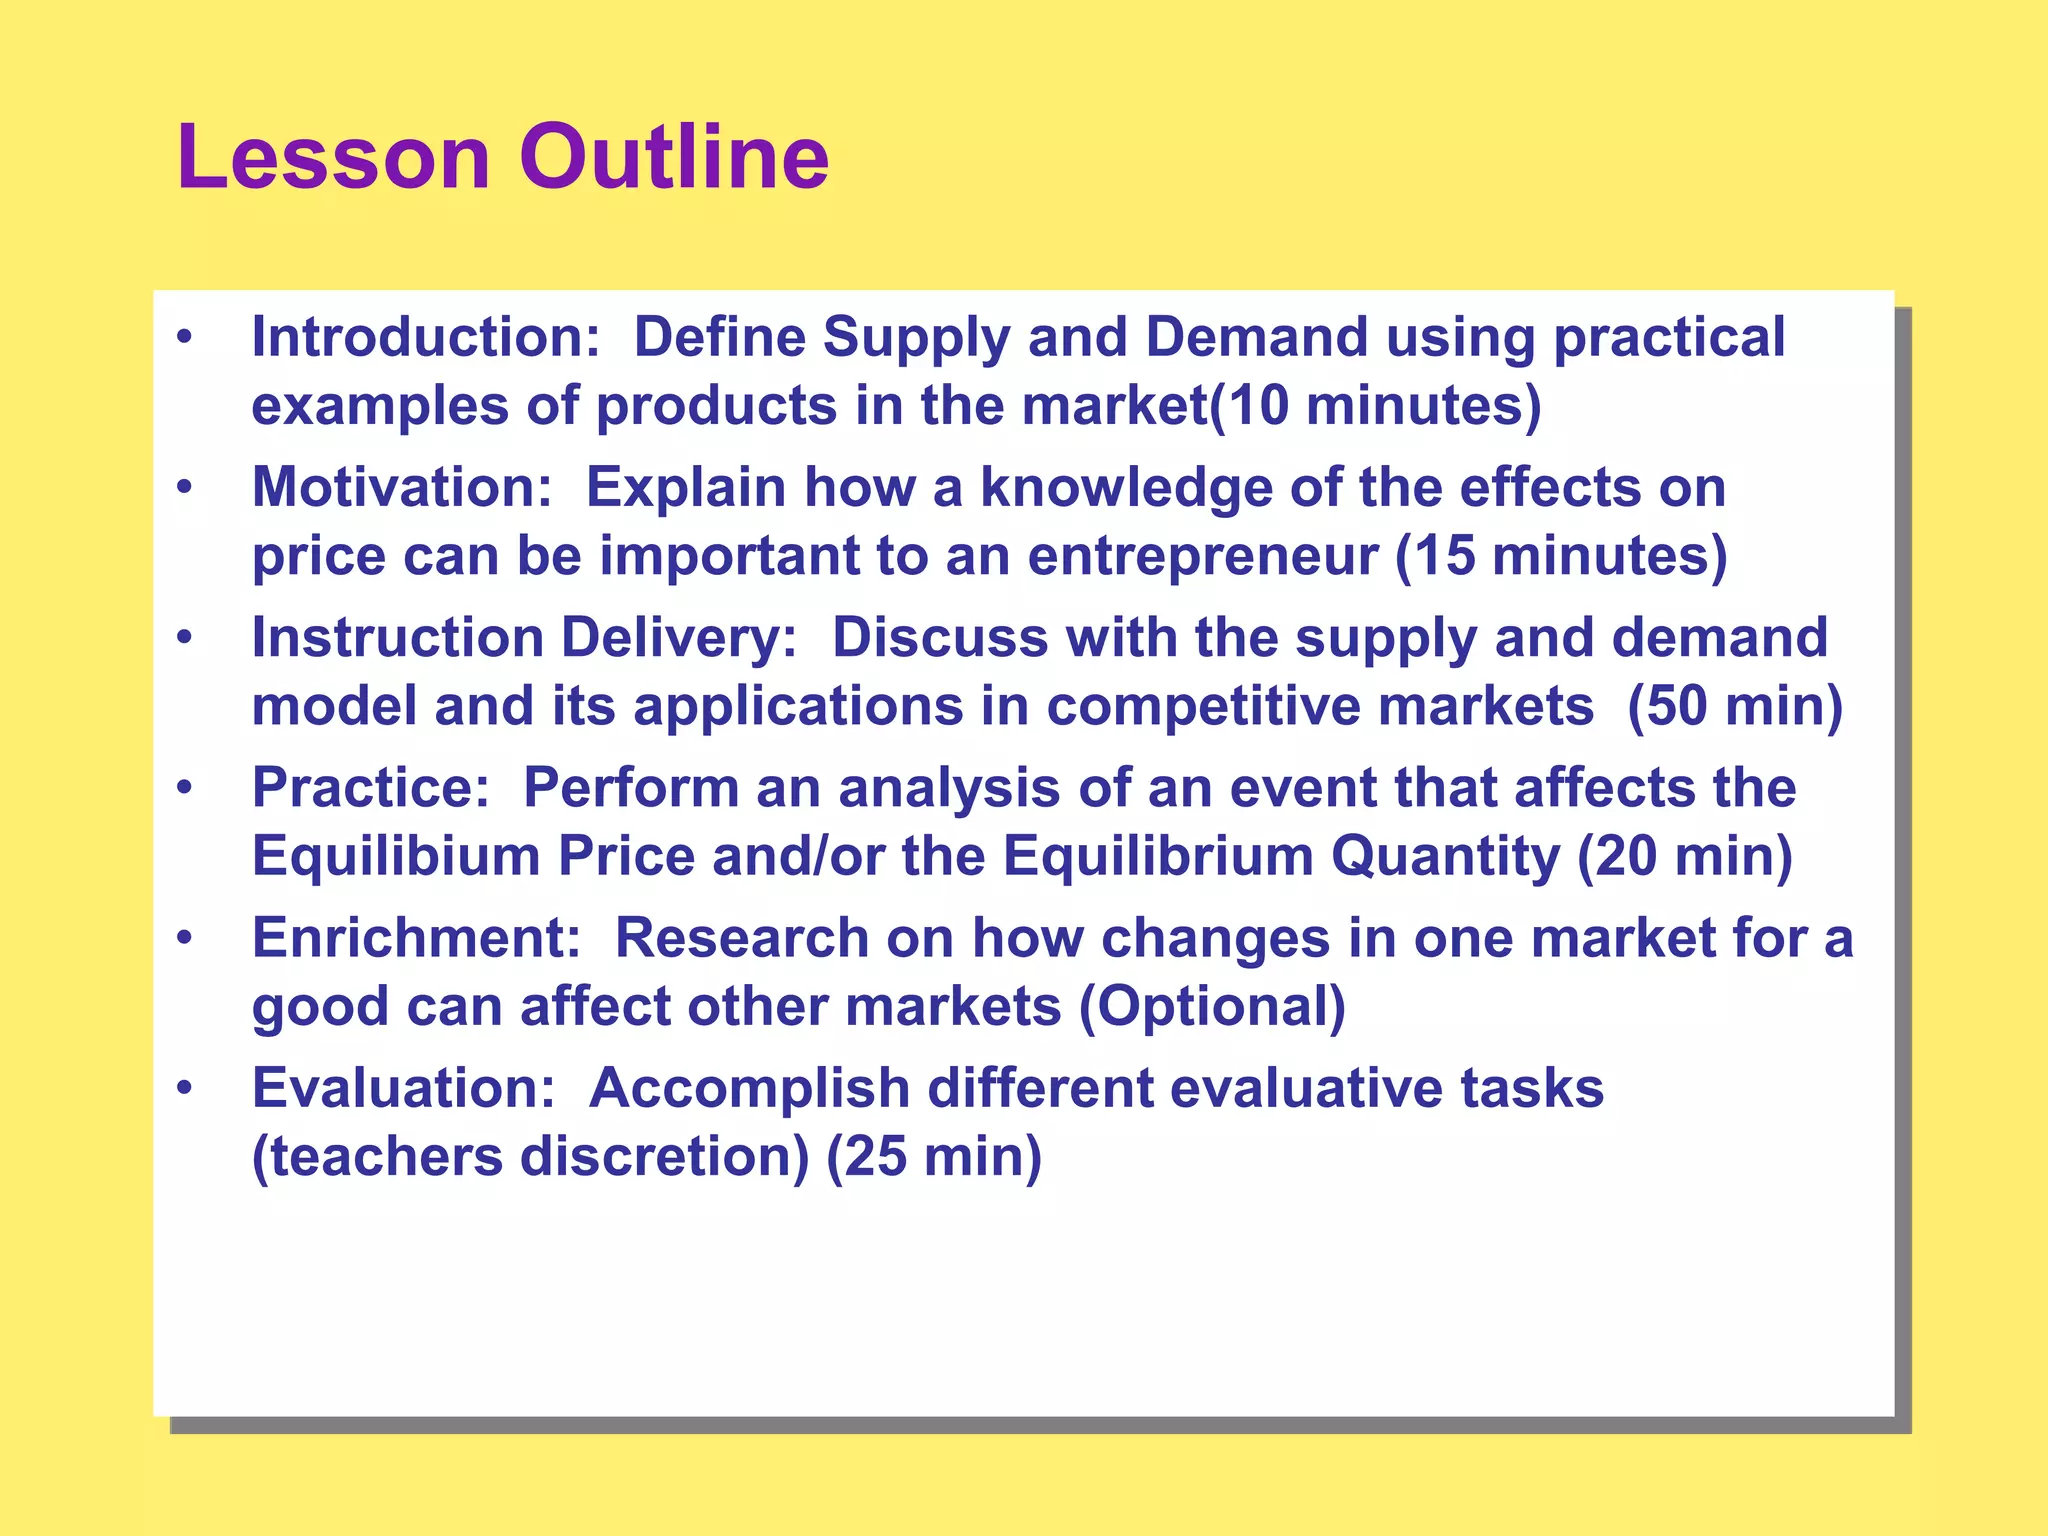
Lesson Outline
• Introduction: Define Supply and Demand using practical
examples of products in the market(10 minutes)
• Motivation: Explain how a knowledge of the effects on
price can be important to an entrepreneur (15 minutes)
• Instruction Delivery: Discuss with the supply and demand
model and its applications in competitive markets (50 min)
• Practice: Perform an analysis of an event that affects the
Equilibium Price and/or the Equilibrium Quantity (20 min)
• Enrichment: Research on how changes in one market for a
good can affect other markets (Optional)
• Evaluation: Accomplish different evaluative tasks
(teachers discretion) (25 min)
Supply and
Demand I:
How Markets
Work
In this chapter you will…
• Learn the nature of a competitive market.
• Examine what determines the demand for a good in a
competitive market.
• Examine what determines the supply of a good in a competitive
market.
• See how supply and demand together set the price of a good
and the quantity sold.
• Consider the key role of prices in allocating scarce resources.
• Compare the prices of commodities and analyze the impact on
consumers
• Analyze the effects of contemporary issues such as migration,
fluctuations in the exchange rate, oil price increases,
unemployment, peace and order, etc. on the purchasing power
of the people.
Activity 1
• Brainstorming
In Five (5) minutes write as many
concepts/ideas you have learned or have
known which are related to Price. Write your
answer on a piece of paper and write all
your concepts and ideas on the whiteboard /
blackboard.
THE MARKET FORCES OF
SUPPLY AND DEMAND
• Supply and Demand are the two
words that economists use most
often.
• Supply and Demand are the forces
that make market economies work!
• Modern microeconomics is about
supply, demand, and market
equilibrium.
MARKETS AND COMPETITION
• The terms supply and demand refer
to the behaviour of people. . .
• . . .as they interact with one another
in markets.
• A market is a group of buyers and sellers
of a particular good or service.
– Buyers determine demand...
– Sellers determine supply…
Competitive Markets
• A Competitive Market is a market
with many buyers and sellers so that
each has a negligible impact on the
market price.
Competition: Market Structure
 Perfectly Competitive:
 Homogeneous Products
 Buyers and Sellers are Price Takers
 Complete Information
 Monopolistic Competition:
 Many Sellers, differentiated products
 Oligopoly:
 Few Sellers, not aggressive competition
 Monopoly:
 One Seller, controls price
DEMAND
• Quantity Demanded refers to the
amount (quantity) of a good that
buyers are willing to purchase at
alternative prices for a given period.
Determinants of Demand
• What factors determine how much ice
cream you will buy?
• What factors determine how much you
will really purchase?
1) Product’s Own Price
2) Consumer Income
3) Prices of Related Goods
4) Tastes
5) Expectations
6) Number of Consumers
1) Price
Law of Demand
– The law of demand states that,
other things equal, the quantity
demanded of a good falls when
the price of the good rises.
2) Income
• As income increases the
demand for a normal good will
increase.
• As income increases the
demand for an inferior good will
decrease.
3) Prices of Related Goods
Prices of Related Goods
– When a fall in the price of one
good reduces the demand for
another good, the two goods are
called substitutes.
– When a fall in the price of one
good increases the demand for
another good, the two goods are
called complements.
4) Others
• Tastes
• Expectations
The Demand Schedule and the
Demand Curve
 The demand schedule is a table that
shows the relationship between the
price of the good and the quantity
demanded.
 The demand curve is a graph of the
relationship between the price of a
good and the quantity demanded.
 Ceteris Paribus: “Other things being
equal”
Catherine’s Demand Schedule
0
3.00
2
2.50
4
2.00
6
1.50
8
1.00
10
0.50
12
0.00
Quantity of cones
Demanded
Price of Ice-cream
Cone (Pesos)
Catherine’s Demand Curve
Price of Ice-
Cream
Cone
Quantity of
Ice-Cream
Cones
2 4 6 8 10 12
0
P3.00
2.50
2.00
1.50
1.00
0.50
Market Demand Schedule
• Market demand is the sum of all individual
demands at each possible price.
• Graphically, individual demand curves are
summed horizontally to obtain the market
demand curve.
• Assume the ice cream market has two
buyers as follows…
0
3.00
10
0.50
12
0.00
Catherine
Price of Ice-cream
Cone (Pesos)
Market demand as the Sum of Individual
Demands
+
1
6
7
Nicholas
1
2
2.50
4
2.00
6
1.50
8
1.00
2
3
4
5
4
7
10
13
16
19
Market
=
Price of Ice-
Cream
Cone
Quantity of
Ice-Cream
Cones
D3
D1
D2
Decrease
in demand
Increase
in demand
Figure 4-3: Shifts in the Demand Curve
The Determinants of Quantity Demanded
Shifts in the Demand Curve versus
Movements Along the Demand Curve
Price of
Cigarettes,
per Pack.
Number of Cigarettes
Smoked per Day
D2
A policy to discourage
smoking shifts the demand
curve to the left.
0 20
P20.00
D1
A
10
B
Shifts of the Demand Curve
Price of
Cigarettes,
per Pack.
Number of Cigarettes
Smoked per Day
0 20
P20.00
D1
A
A tax that raises the price
of cigarettes results in a
movements along the
demand curve.
C
12
P40.00
A Movement Along the Demand Curve
A. The price of iPods
falls
B. The price of music
downloads falls
C. The price of CDs
falls
A C T I V E L E A R N I N G
Demand Curve
25
Draw a demand curve for music downloads.
What happens to it in each of
the following scenarios? Why?
A C T I V E L E A R N I N G
A. Price of iPods falls
26
Q2
Price of
music
down-
loads
Quantity of
music downloads
D1
D2
P1
Q1
Music downloads
and iPods are
complements.
A fall in price of
iPods shifts the
demand curve for
music downloads
to the right.
A C T I V E L E A R N I N G
B. Price of music downloads falls
27
The D curve
does not shift.
Move down along
curve to a point with
lower P, higher Q.
Price of
music
down-
loads
Quantity of
music downloads
D1
P1
Q1 Q2
P2
A C T I V E L E A R N I N G
C. Price of CDs falls
28
P1
Q1
CDs and
music downloads
are substitutes.
A fall in price of CDs
shifts demand for
music downloads
to the left.
Price of
music
down-
loads
Quantity of
music downloads
D1
D2
Q2
SUPPLY
• Quantity Supplied refers to the
amount (quantity) of a good that
sellers are willing to make available
for sale at alternative prices for a
given period.
Determinants of Supply
• What factors determine how much
ice cream you are willing to offer or
produce?
1) Product’s Own Price
2) Input prices
3) Technology
4) Expectations
5) Number of sellers
1) Price
Law of Supply
– The law of supply states that,
other things equal, the quantity
supplied of a good rises when the
price of the good rises.
The Supply Schedule and the
Supply Curve
 The supply schedule is a table that
shows the relationship between the
price of the good and the quantity
supplied.
 The supply curve is a graph of the
relationship between the price of a
good and the quantity supplied.
 Ceteris Paribus: “Other things being
equal”
Ben’s Supply Schedule
5
3.00
4
2.50
3
2.00
2
1.50
1
1.00
0
0.50
0
0.00
Quantity of cones
Supplied
Price of Ice-cream
Cone (Pesos)
Price of Ice-
Cream
Cone
Quantity of
Ice-Cream
Cones
6 8 10 12
0 2
1.50
1.00
1
2.00
3 4
P3.00
2.50
5
0.50
Ben’s Supply Curve
Market Supply Schedule
• Market supply is the sum of all individual
supplies at each possible price.
• Graphically, individual supply curves are
summed horizontally to obtain the market
demand curve.
• Assume the ice cream market has two
suppliers as follows…
5
3.00
0
0.50
0
0.00
Ben
Price of Ice-cream
Cone (Pesos)
Market supply as the Sum of Individual
Supplies
+
8
0
0
Nicholas
13
4
2.50
3
2.00
2
1.50
1
1.00
6
4
2
0
10
7
4
1
0
0
Market
=
Price of Ice-
Cream
Cone
Quantity of
Ice-Cream
Cones
S3
S2
S1
Decrease
in supply
Increase
in supply
Shifts in the Supply Curve
The Determinants of Quantity Supplied
SUPPLY AND DEMAND
TOGETHER
• Equilibrium refers to a situation in which
the price has reached the level where
quantity supplied equals quantity
demanded.
Equilibrium
• Equilibrium Price
– The price that balances quantity supplied and
quantity demanded.
– On a graph, it is the price at which the supply
and demand curves intersect.
• Equilibrium Quantity
– The quantity supplied and the quantity
demanded at the equilibrium price.
– On a graph it is the quantity at which the
supply and demand curves intersect.
At P2.00, the quantity demanded
is equal to the quantity supplied!
Demand Schedule Supply Schedule
Equilibrium
Equilibrium price
Demand
Supply
P2.00
6 8 10
0
Equilibrium
Equilibrium quantity
Quantity of Ice-
Cream Cones
Price of
Ice-Cream
Cone
4
2
1 3 5 7 9 11
The Equilibrium of Supply and Demand
Equilibrium
• Surplus
– When price > equilibrium price, then quantity
supplied > quantity demanded.
• There is excess supply or a surplus.
• Suppliers will lower the price to increase sales,
thereby moving toward equilibrium.
• Shortage
– When price < equilibrium price, then quantity
demanded > the quantity supplied.
• There is excess demand or a shortage.
• Suppliers will raise the price due to too many buyers
chasing too few goods, thereby moving toward
equilibrium.
Demand
Supply
P2.00
6 8 10
0 Quantity of Ice-
Cream Cones
Price of
Ice-Cream
Cone
4
2
1 3 5 7 9 11
P2.50
Surplus
Quantity
Demanded
Quantity
Supplied
Excess Supply
Demand
Supply
P2.00
6 8 10
0 Quantity of Ice-
Cream Cone
Price of
Ice-Cream
Cone
4
2
1 3 5 7 9 11
P1.50
Shortage
Quantity
Supplied
Quantity
Demanded
Excess Demand
Three Steps To Analyzing
Changes in Equilibrium
• Decide whether the event shifts the
supply or demand curve (or both).
• Decide whether the curve(s) shift(s)
to the left or to the right.
• Use the supply-and-demand diagram
to see how the shift affects
equilibrium price and quantity.
• Example: A Heat Wave
D1
Supply
P2.00
6 10
0 Quantity of Ice-
Cream Cone
Price of
Ice-Cream
Cone
4
2
1 3 5 7 11
D2
P2.50
1. Hot weather increases the
demand for ice cream…
2. …
resulting in
a higher
price …
3. … and a higher quantity
sold.
New equilibrium
Initial
equilibrium
How an Increase in Demand Affects the Equilibrium
Demand
S1
P2.00
10
0 Quantity of Ice-
Cream Cones
Price of
Ice-Cream
Cone
4
2
1 3 7 11
S2
P2.50
1. An earthquake reduces the
supply of ice cream…
2. …
resulting in
a higher
price …
3. … and a lower quantity
sold.
New equilibrium
Initial equilibrium
How a Decrease in Demand Affects the Equilibrium
D1
S1
0 Quantity of Ice-
Cream Cone
Price of
Ice-Cream
Cone
Q1
D2
Large increase
in demand
P2
S2
Q2
New
equilibrium
Small
decrease in
supply
Initial equilibrium
P1
A Shift in Both Supply and Demand
D1
S1
0 Quantity of Ice-
Cream Cone
Price of
Ice-Cream
Cone
Q1
D2
Large
decrease in
supply
P2
S2
Q2
New
equilibrium
Small increase
in demand
Initial equilibrium
P1
A Shift in Both Supply and Demand
Table 4-8: What Happens to Price and
Quantity when Supply or Demand Shifts
• Market economies harness the
forces of supply and demand. . .
• Supply and Demand together
determine the prices of the
economy’s different goods and
services. . .
• Prices in turn are the signals that
guide the allocation of resources.
Purchasing Power
• Is the value of a currency expressed in
terms of the amount of goods or services
that one unit of money can buy.
Inflation – is a phenomenon of rising general
level of prices of goods and services over
period of time.
Deflation – a decrease in the general level of
prices of goods and services.
Basic Commodities
- Are raw materials or primary agricultural
products that can be bought and sold in
the market like corn, wheat, copper, crude
oil..
What causes commodities price to change?
1. When supply exceeds demand, price fall
and when demand is greater than supply
prices rise.
Basic Commodities
2. Natural disasters can also cause prices to
change like the El Nino and La Nina climate
phenomenon, volcanic eruptions,
earthquakes, typhoon, and landslide, among
others.
3. Production costs can also cause price to
rise or fall like the implementation of Salary
Standardization Law and Minimum Wage
Law, and the shifting of production from
human to technology.
Employment Sector in the
Phillipines
1.Agricultural Sector
2.Industrial Sector
3.Services Sector
Demand and Supply of Labor
Labor surplus – is an economic condition in
which the supply of labor is greater than the
demand for labor.
Labor shortage – is an economic conditions
in which supply of labor is less than the
demand for labor.
Elasticities of Demand and Supply
• Elasticity – is a measure if how much
buyer and sellers respond to change in
market conditions.
• Coefficient of elasticity – is the number
obtained when the percentage change in
demand is divided by the percentage
change in the determinant.
• Elastic – a change in a determinant will
lead to proportionately greater change in
demand or supply. Coefficient of elasticity
is greater than 1.
Elasticities of Demand and Supply
• Inelastic – a change in a determinant will
lead to proportionately lesser change in
demand or supply. Coefficient of elasticity
is less than 1.
• Unitary elastic – change in determinant
will lead to a proportionately equal change
in demand or supply. Coefficient of
elasticity is equal to 1.
Elasticity of Demand
• Three Types of Elasticity of Demand
1. Price Elasticity of Demand
- This measure the responsiveness of demand
to a change in the price of the good.
a. Arc Elasticity – the value of elasticity is
computed by choosing two points on the
demand curve and comparing the
percentage changes in the quantity and the
price on those two points.
Ep = {(Q2-Q1)/(Q2+Q1/2)} / {(P2-P1)/(P2+P1/2)}
Elasticity of Demand
Where:
Q2 = new quantity demanded
Q1 = original quantity demanded
P2 = new price of the good
P1 = original price of the good
b. Point Elasticity – measures the degree of
elasticity on a single point on the demand
curve. Change on single point are
infinitesimally small.
Ep = {(Q2-Q} / {(P2-P1) /P1 }
r
Elasticity of Demand
2. Income Elasticity of Demand
- This measure how the quantity demanded
changes as consumer income changes.
- Is equal to (% change in quantity demanded)/
(% change in income)
3. Cross Price Elasticity of Demand
- This measure how many quantity demanded
changes as the price of related goods
change.
- Measures the responsiveness of the demand
for a good to the change in the price of
substitute good or a complement.
Price Elasticity of Supply
- Determines whether the supply curve is
steep or flat. A steep curve signifies a high
degree of elasticity or ability to change,
while a flat curve indicates an inability to
change in response to a change in the price
of the good. Goods that are easy to produce
have elastic supply while those which need
a long time to produce and which are hard
to make have inelastic to supply.
Summary
• Economists use the model of supply and
demand to analyze competitive markets.
• In a competitive market, there are many
buyers and sellers, each of whom has little
or no influence on the market price.
Summary
• The demand curve shows how the
quantity of a good depends upon the
price.
– According to the law of demand, as the price
of a good falls, the quantity demanded rises.
Therefore, the demand curve slopes downward
illustrating a negative relationship between
price and quantity.
– In addition to price, other determinants of how
much consumers want to buy include income,
the prices of complements and substitutes,
tastes, expectations, and the number of
buyers.
– If one of these factors changes, the demand
curve shifts.
Summary
• The supply curve shows how the quantity of a
good supplied depends upon the price.
– According to the law of supply, as the price of
a good rises, the quantity supplied rises.
Therefore, the supply curve slopes upward
illustrating a positive relationship between
price and quantity.
– In addition to price, other determinants of how
much producers want to sell include input
prices, technology, expectations, and the
number of sellers.
– If one of these factors changes, the supply
curve shifts.
Summary
• Market equilibrium is determined by the
intersection of the supply and demand
curves.
• At the equilibrium price, the quantity
demanded equals the quantity supplied.
• The behavior of buyers and sellers
naturally drives markets toward their
equilibrium.
Summary
• If the market price is above equilibrium,
a surplus results, which causes the price
to fall.
If the market price is below equilibrium,
a shortage results, causing the price to
rise.
Summary
• We can use the supply-demand diagram to
analyze the effects of any event on a
market:
First, determine whether the event shifts
one or both curves. Second, determine
the direction of the shifts. Third, compare
the new equilibrium to the initial one.
• In market economies, prices are the
signals that guide economic decisions
and allocate scarce resources.

topic-4-5.ppt

  • 1.
    Lesson Outline • Introduction:Define Supply and Demand using practical examples of products in the market(10 minutes) • Motivation: Explain how a knowledge of the effects on price can be important to an entrepreneur (15 minutes) • Instruction Delivery: Discuss with the supply and demand model and its applications in competitive markets (50 min) • Practice: Perform an analysis of an event that affects the Equilibium Price and/or the Equilibrium Quantity (20 min) • Enrichment: Research on how changes in one market for a good can affect other markets (Optional) • Evaluation: Accomplish different evaluative tasks (teachers discretion) (25 min)
  • 2.
  • 3.
    In this chapteryou will… • Learn the nature of a competitive market. • Examine what determines the demand for a good in a competitive market. • Examine what determines the supply of a good in a competitive market. • See how supply and demand together set the price of a good and the quantity sold. • Consider the key role of prices in allocating scarce resources. • Compare the prices of commodities and analyze the impact on consumers • Analyze the effects of contemporary issues such as migration, fluctuations in the exchange rate, oil price increases, unemployment, peace and order, etc. on the purchasing power of the people.
  • 4.
    Activity 1 • Brainstorming InFive (5) minutes write as many concepts/ideas you have learned or have known which are related to Price. Write your answer on a piece of paper and write all your concepts and ideas on the whiteboard / blackboard.
  • 5.
    THE MARKET FORCESOF SUPPLY AND DEMAND • Supply and Demand are the two words that economists use most often. • Supply and Demand are the forces that make market economies work! • Modern microeconomics is about supply, demand, and market equilibrium.
  • 6.
    MARKETS AND COMPETITION •The terms supply and demand refer to the behaviour of people. . . • . . .as they interact with one another in markets. • A market is a group of buyers and sellers of a particular good or service. – Buyers determine demand... – Sellers determine supply…
  • 7.
    Competitive Markets • ACompetitive Market is a market with many buyers and sellers so that each has a negligible impact on the market price.
  • 8.
    Competition: Market Structure Perfectly Competitive:  Homogeneous Products  Buyers and Sellers are Price Takers  Complete Information  Monopolistic Competition:  Many Sellers, differentiated products  Oligopoly:  Few Sellers, not aggressive competition  Monopoly:  One Seller, controls price
  • 9.
    DEMAND • Quantity Demandedrefers to the amount (quantity) of a good that buyers are willing to purchase at alternative prices for a given period.
  • 10.
    Determinants of Demand •What factors determine how much ice cream you will buy? • What factors determine how much you will really purchase? 1) Product’s Own Price 2) Consumer Income 3) Prices of Related Goods 4) Tastes 5) Expectations 6) Number of Consumers
  • 11.
    1) Price Law ofDemand – The law of demand states that, other things equal, the quantity demanded of a good falls when the price of the good rises.
  • 12.
    2) Income • Asincome increases the demand for a normal good will increase. • As income increases the demand for an inferior good will decrease.
  • 13.
    3) Prices ofRelated Goods Prices of Related Goods – When a fall in the price of one good reduces the demand for another good, the two goods are called substitutes. – When a fall in the price of one good increases the demand for another good, the two goods are called complements.
  • 14.
  • 15.
    The Demand Scheduleand the Demand Curve  The demand schedule is a table that shows the relationship between the price of the good and the quantity demanded.  The demand curve is a graph of the relationship between the price of a good and the quantity demanded.  Ceteris Paribus: “Other things being equal”
  • 16.
  • 17.
    Catherine’s Demand Curve Priceof Ice- Cream Cone Quantity of Ice-Cream Cones 2 4 6 8 10 12 0 P3.00 2.50 2.00 1.50 1.00 0.50
  • 18.
    Market Demand Schedule •Market demand is the sum of all individual demands at each possible price. • Graphically, individual demand curves are summed horizontally to obtain the market demand curve. • Assume the ice cream market has two buyers as follows…
  • 19.
    0 3.00 10 0.50 12 0.00 Catherine Price of Ice-cream Cone(Pesos) Market demand as the Sum of Individual Demands + 1 6 7 Nicholas 1 2 2.50 4 2.00 6 1.50 8 1.00 2 3 4 5 4 7 10 13 16 19 Market =
  • 20.
    Price of Ice- Cream Cone Quantityof Ice-Cream Cones D3 D1 D2 Decrease in demand Increase in demand Figure 4-3: Shifts in the Demand Curve
  • 21.
    The Determinants ofQuantity Demanded
  • 22.
    Shifts in theDemand Curve versus Movements Along the Demand Curve
  • 23.
    Price of Cigarettes, per Pack. Numberof Cigarettes Smoked per Day D2 A policy to discourage smoking shifts the demand curve to the left. 0 20 P20.00 D1 A 10 B Shifts of the Demand Curve
  • 24.
    Price of Cigarettes, per Pack. Numberof Cigarettes Smoked per Day 0 20 P20.00 D1 A A tax that raises the price of cigarettes results in a movements along the demand curve. C 12 P40.00 A Movement Along the Demand Curve
  • 25.
    A. The priceof iPods falls B. The price of music downloads falls C. The price of CDs falls A C T I V E L E A R N I N G Demand Curve 25 Draw a demand curve for music downloads. What happens to it in each of the following scenarios? Why?
  • 26.
    A C TI V E L E A R N I N G A. Price of iPods falls 26 Q2 Price of music down- loads Quantity of music downloads D1 D2 P1 Q1 Music downloads and iPods are complements. A fall in price of iPods shifts the demand curve for music downloads to the right.
  • 27.
    A C TI V E L E A R N I N G B. Price of music downloads falls 27 The D curve does not shift. Move down along curve to a point with lower P, higher Q. Price of music down- loads Quantity of music downloads D1 P1 Q1 Q2 P2
  • 28.
    A C TI V E L E A R N I N G C. Price of CDs falls 28 P1 Q1 CDs and music downloads are substitutes. A fall in price of CDs shifts demand for music downloads to the left. Price of music down- loads Quantity of music downloads D1 D2 Q2
  • 29.
    SUPPLY • Quantity Suppliedrefers to the amount (quantity) of a good that sellers are willing to make available for sale at alternative prices for a given period.
  • 30.
    Determinants of Supply •What factors determine how much ice cream you are willing to offer or produce? 1) Product’s Own Price 2) Input prices 3) Technology 4) Expectations 5) Number of sellers
  • 31.
    1) Price Law ofSupply – The law of supply states that, other things equal, the quantity supplied of a good rises when the price of the good rises.
  • 32.
    The Supply Scheduleand the Supply Curve  The supply schedule is a table that shows the relationship between the price of the good and the quantity supplied.  The supply curve is a graph of the relationship between the price of a good and the quantity supplied.  Ceteris Paribus: “Other things being equal”
  • 33.
  • 34.
    Price of Ice- Cream Cone Quantityof Ice-Cream Cones 6 8 10 12 0 2 1.50 1.00 1 2.00 3 4 P3.00 2.50 5 0.50 Ben’s Supply Curve
  • 35.
    Market Supply Schedule •Market supply is the sum of all individual supplies at each possible price. • Graphically, individual supply curves are summed horizontally to obtain the market demand curve. • Assume the ice cream market has two suppliers as follows…
  • 36.
    5 3.00 0 0.50 0 0.00 Ben Price of Ice-cream Cone(Pesos) Market supply as the Sum of Individual Supplies + 8 0 0 Nicholas 13 4 2.50 3 2.00 2 1.50 1 1.00 6 4 2 0 10 7 4 1 0 0 Market =
  • 37.
    Price of Ice- Cream Cone Quantityof Ice-Cream Cones S3 S2 S1 Decrease in supply Increase in supply Shifts in the Supply Curve
  • 38.
    The Determinants ofQuantity Supplied
  • 39.
    SUPPLY AND DEMAND TOGETHER •Equilibrium refers to a situation in which the price has reached the level where quantity supplied equals quantity demanded.
  • 40.
    Equilibrium • Equilibrium Price –The price that balances quantity supplied and quantity demanded. – On a graph, it is the price at which the supply and demand curves intersect. • Equilibrium Quantity – The quantity supplied and the quantity demanded at the equilibrium price. – On a graph it is the quantity at which the supply and demand curves intersect.
  • 41.
    At P2.00, thequantity demanded is equal to the quantity supplied! Demand Schedule Supply Schedule Equilibrium
  • 42.
    Equilibrium price Demand Supply P2.00 6 810 0 Equilibrium Equilibrium quantity Quantity of Ice- Cream Cones Price of Ice-Cream Cone 4 2 1 3 5 7 9 11 The Equilibrium of Supply and Demand
  • 43.
    Equilibrium • Surplus – Whenprice > equilibrium price, then quantity supplied > quantity demanded. • There is excess supply or a surplus. • Suppliers will lower the price to increase sales, thereby moving toward equilibrium. • Shortage – When price < equilibrium price, then quantity demanded > the quantity supplied. • There is excess demand or a shortage. • Suppliers will raise the price due to too many buyers chasing too few goods, thereby moving toward equilibrium.
  • 44.
    Demand Supply P2.00 6 8 10 0Quantity of Ice- Cream Cones Price of Ice-Cream Cone 4 2 1 3 5 7 9 11 P2.50 Surplus Quantity Demanded Quantity Supplied Excess Supply
  • 45.
    Demand Supply P2.00 6 8 10 0Quantity of Ice- Cream Cone Price of Ice-Cream Cone 4 2 1 3 5 7 9 11 P1.50 Shortage Quantity Supplied Quantity Demanded Excess Demand
  • 46.
    Three Steps ToAnalyzing Changes in Equilibrium • Decide whether the event shifts the supply or demand curve (or both). • Decide whether the curve(s) shift(s) to the left or to the right. • Use the supply-and-demand diagram to see how the shift affects equilibrium price and quantity. • Example: A Heat Wave
  • 47.
    D1 Supply P2.00 6 10 0 Quantityof Ice- Cream Cone Price of Ice-Cream Cone 4 2 1 3 5 7 11 D2 P2.50 1. Hot weather increases the demand for ice cream… 2. … resulting in a higher price … 3. … and a higher quantity sold. New equilibrium Initial equilibrium How an Increase in Demand Affects the Equilibrium
  • 48.
    Demand S1 P2.00 10 0 Quantity ofIce- Cream Cones Price of Ice-Cream Cone 4 2 1 3 7 11 S2 P2.50 1. An earthquake reduces the supply of ice cream… 2. … resulting in a higher price … 3. … and a lower quantity sold. New equilibrium Initial equilibrium How a Decrease in Demand Affects the Equilibrium
  • 49.
    D1 S1 0 Quantity ofIce- Cream Cone Price of Ice-Cream Cone Q1 D2 Large increase in demand P2 S2 Q2 New equilibrium Small decrease in supply Initial equilibrium P1 A Shift in Both Supply and Demand
  • 50.
    D1 S1 0 Quantity ofIce- Cream Cone Price of Ice-Cream Cone Q1 D2 Large decrease in supply P2 S2 Q2 New equilibrium Small increase in demand Initial equilibrium P1 A Shift in Both Supply and Demand
  • 51.
    Table 4-8: WhatHappens to Price and Quantity when Supply or Demand Shifts
  • 52.
    • Market economiesharness the forces of supply and demand. . . • Supply and Demand together determine the prices of the economy’s different goods and services. . . • Prices in turn are the signals that guide the allocation of resources.
  • 53.
    Purchasing Power • Isthe value of a currency expressed in terms of the amount of goods or services that one unit of money can buy. Inflation – is a phenomenon of rising general level of prices of goods and services over period of time. Deflation – a decrease in the general level of prices of goods and services.
  • 54.
    Basic Commodities - Areraw materials or primary agricultural products that can be bought and sold in the market like corn, wheat, copper, crude oil.. What causes commodities price to change? 1. When supply exceeds demand, price fall and when demand is greater than supply prices rise.
  • 55.
    Basic Commodities 2. Naturaldisasters can also cause prices to change like the El Nino and La Nina climate phenomenon, volcanic eruptions, earthquakes, typhoon, and landslide, among others. 3. Production costs can also cause price to rise or fall like the implementation of Salary Standardization Law and Minimum Wage Law, and the shifting of production from human to technology.
  • 56.
    Employment Sector inthe Phillipines 1.Agricultural Sector 2.Industrial Sector 3.Services Sector
  • 57.
    Demand and Supplyof Labor Labor surplus – is an economic condition in which the supply of labor is greater than the demand for labor. Labor shortage – is an economic conditions in which supply of labor is less than the demand for labor.
  • 58.
    Elasticities of Demandand Supply • Elasticity – is a measure if how much buyer and sellers respond to change in market conditions. • Coefficient of elasticity – is the number obtained when the percentage change in demand is divided by the percentage change in the determinant. • Elastic – a change in a determinant will lead to proportionately greater change in demand or supply. Coefficient of elasticity is greater than 1.
  • 59.
    Elasticities of Demandand Supply • Inelastic – a change in a determinant will lead to proportionately lesser change in demand or supply. Coefficient of elasticity is less than 1. • Unitary elastic – change in determinant will lead to a proportionately equal change in demand or supply. Coefficient of elasticity is equal to 1.
  • 61.
    Elasticity of Demand •Three Types of Elasticity of Demand 1. Price Elasticity of Demand - This measure the responsiveness of demand to a change in the price of the good. a. Arc Elasticity – the value of elasticity is computed by choosing two points on the demand curve and comparing the percentage changes in the quantity and the price on those two points. Ep = {(Q2-Q1)/(Q2+Q1/2)} / {(P2-P1)/(P2+P1/2)}
  • 62.
    Elasticity of Demand Where: Q2= new quantity demanded Q1 = original quantity demanded P2 = new price of the good P1 = original price of the good b. Point Elasticity – measures the degree of elasticity on a single point on the demand curve. Change on single point are infinitesimally small. Ep = {(Q2-Q} / {(P2-P1) /P1 } r
  • 63.
    Elasticity of Demand 2.Income Elasticity of Demand - This measure how the quantity demanded changes as consumer income changes. - Is equal to (% change in quantity demanded)/ (% change in income) 3. Cross Price Elasticity of Demand - This measure how many quantity demanded changes as the price of related goods change. - Measures the responsiveness of the demand for a good to the change in the price of substitute good or a complement.
  • 64.
    Price Elasticity ofSupply - Determines whether the supply curve is steep or flat. A steep curve signifies a high degree of elasticity or ability to change, while a flat curve indicates an inability to change in response to a change in the price of the good. Goods that are easy to produce have elastic supply while those which need a long time to produce and which are hard to make have inelastic to supply.
  • 65.
    Summary • Economists usethe model of supply and demand to analyze competitive markets. • In a competitive market, there are many buyers and sellers, each of whom has little or no influence on the market price.
  • 66.
    Summary • The demandcurve shows how the quantity of a good depends upon the price. – According to the law of demand, as the price of a good falls, the quantity demanded rises. Therefore, the demand curve slopes downward illustrating a negative relationship between price and quantity. – In addition to price, other determinants of how much consumers want to buy include income, the prices of complements and substitutes, tastes, expectations, and the number of buyers. – If one of these factors changes, the demand curve shifts.
  • 67.
    Summary • The supplycurve shows how the quantity of a good supplied depends upon the price. – According to the law of supply, as the price of a good rises, the quantity supplied rises. Therefore, the supply curve slopes upward illustrating a positive relationship between price and quantity. – In addition to price, other determinants of how much producers want to sell include input prices, technology, expectations, and the number of sellers. – If one of these factors changes, the supply curve shifts.
  • 68.
    Summary • Market equilibriumis determined by the intersection of the supply and demand curves. • At the equilibrium price, the quantity demanded equals the quantity supplied. • The behavior of buyers and sellers naturally drives markets toward their equilibrium.
  • 69.
    Summary • If themarket price is above equilibrium, a surplus results, which causes the price to fall. If the market price is below equilibrium, a shortage results, causing the price to rise.
  • 70.
    Summary • We canuse the supply-demand diagram to analyze the effects of any event on a market: First, determine whether the event shifts one or both curves. Second, determine the direction of the shifts. Third, compare the new equilibrium to the initial one. • In market economies, prices are the signals that guide economic decisions and allocate scarce resources.