![2009 2010 2011
Students Research Sponsors
2 PhD [2013: +3; -1] Augmented Reality (AR)
2 Master Human-Computer Interaction
4 Internship Haptics
Visualization](https://image.slidesharecdn.com/keynote-vec-2012-120921034232-phpapp01/75/Keynote-Virtual-Efficiency-Congress-2012-3-2048.jpg)
![Augmented Reality
[Azuma 1997]
1. Combines real and virtual
2. Interactive in realtime
3. Registered in 3–D
[Milgram & Kishino, 1994]
2 Challenges in Developing User Interfaces for Ubiquitous Augmented Reality
Mixed
Reality (MR)
Real Augmented Augmented Virtual
Environment Reality (AR) Virtuality (AV) Environment](https://image.slidesharecdn.com/keynote-vec-2012-120921034232-phpapp01/75/Keynote-Virtual-Efficiency-Congress-2012-5-2048.jpg)
![AR in the Real World
1584: Pepper’s Ghost
[Giambattista della Porta]
Early 1990s: Boeing coins
term AR for their wire
assembly application
2002: Intelligent Welding
Gun [Klinker & BMW]](https://image.slidesharecdn.com/keynote-vec-2012-120921034232-phpapp01/75/Keynote-Virtual-Efficiency-Congress-2012-6-2048.jpg)
![Current State of AR:
low-level = solved!
Essential technology: tracking
(where is the camera in the real world?)
Parallel Tracking and Mapping for Small AR
Workspaces [Klein & Murray, 2007]
KinectFusion [Newcombe et al., 2011]](https://image.slidesharecdn.com/keynote-vec-2012-120921034232-phpapp01/75/Keynote-Virtual-Efficiency-Congress-2012-8-2048.jpg)
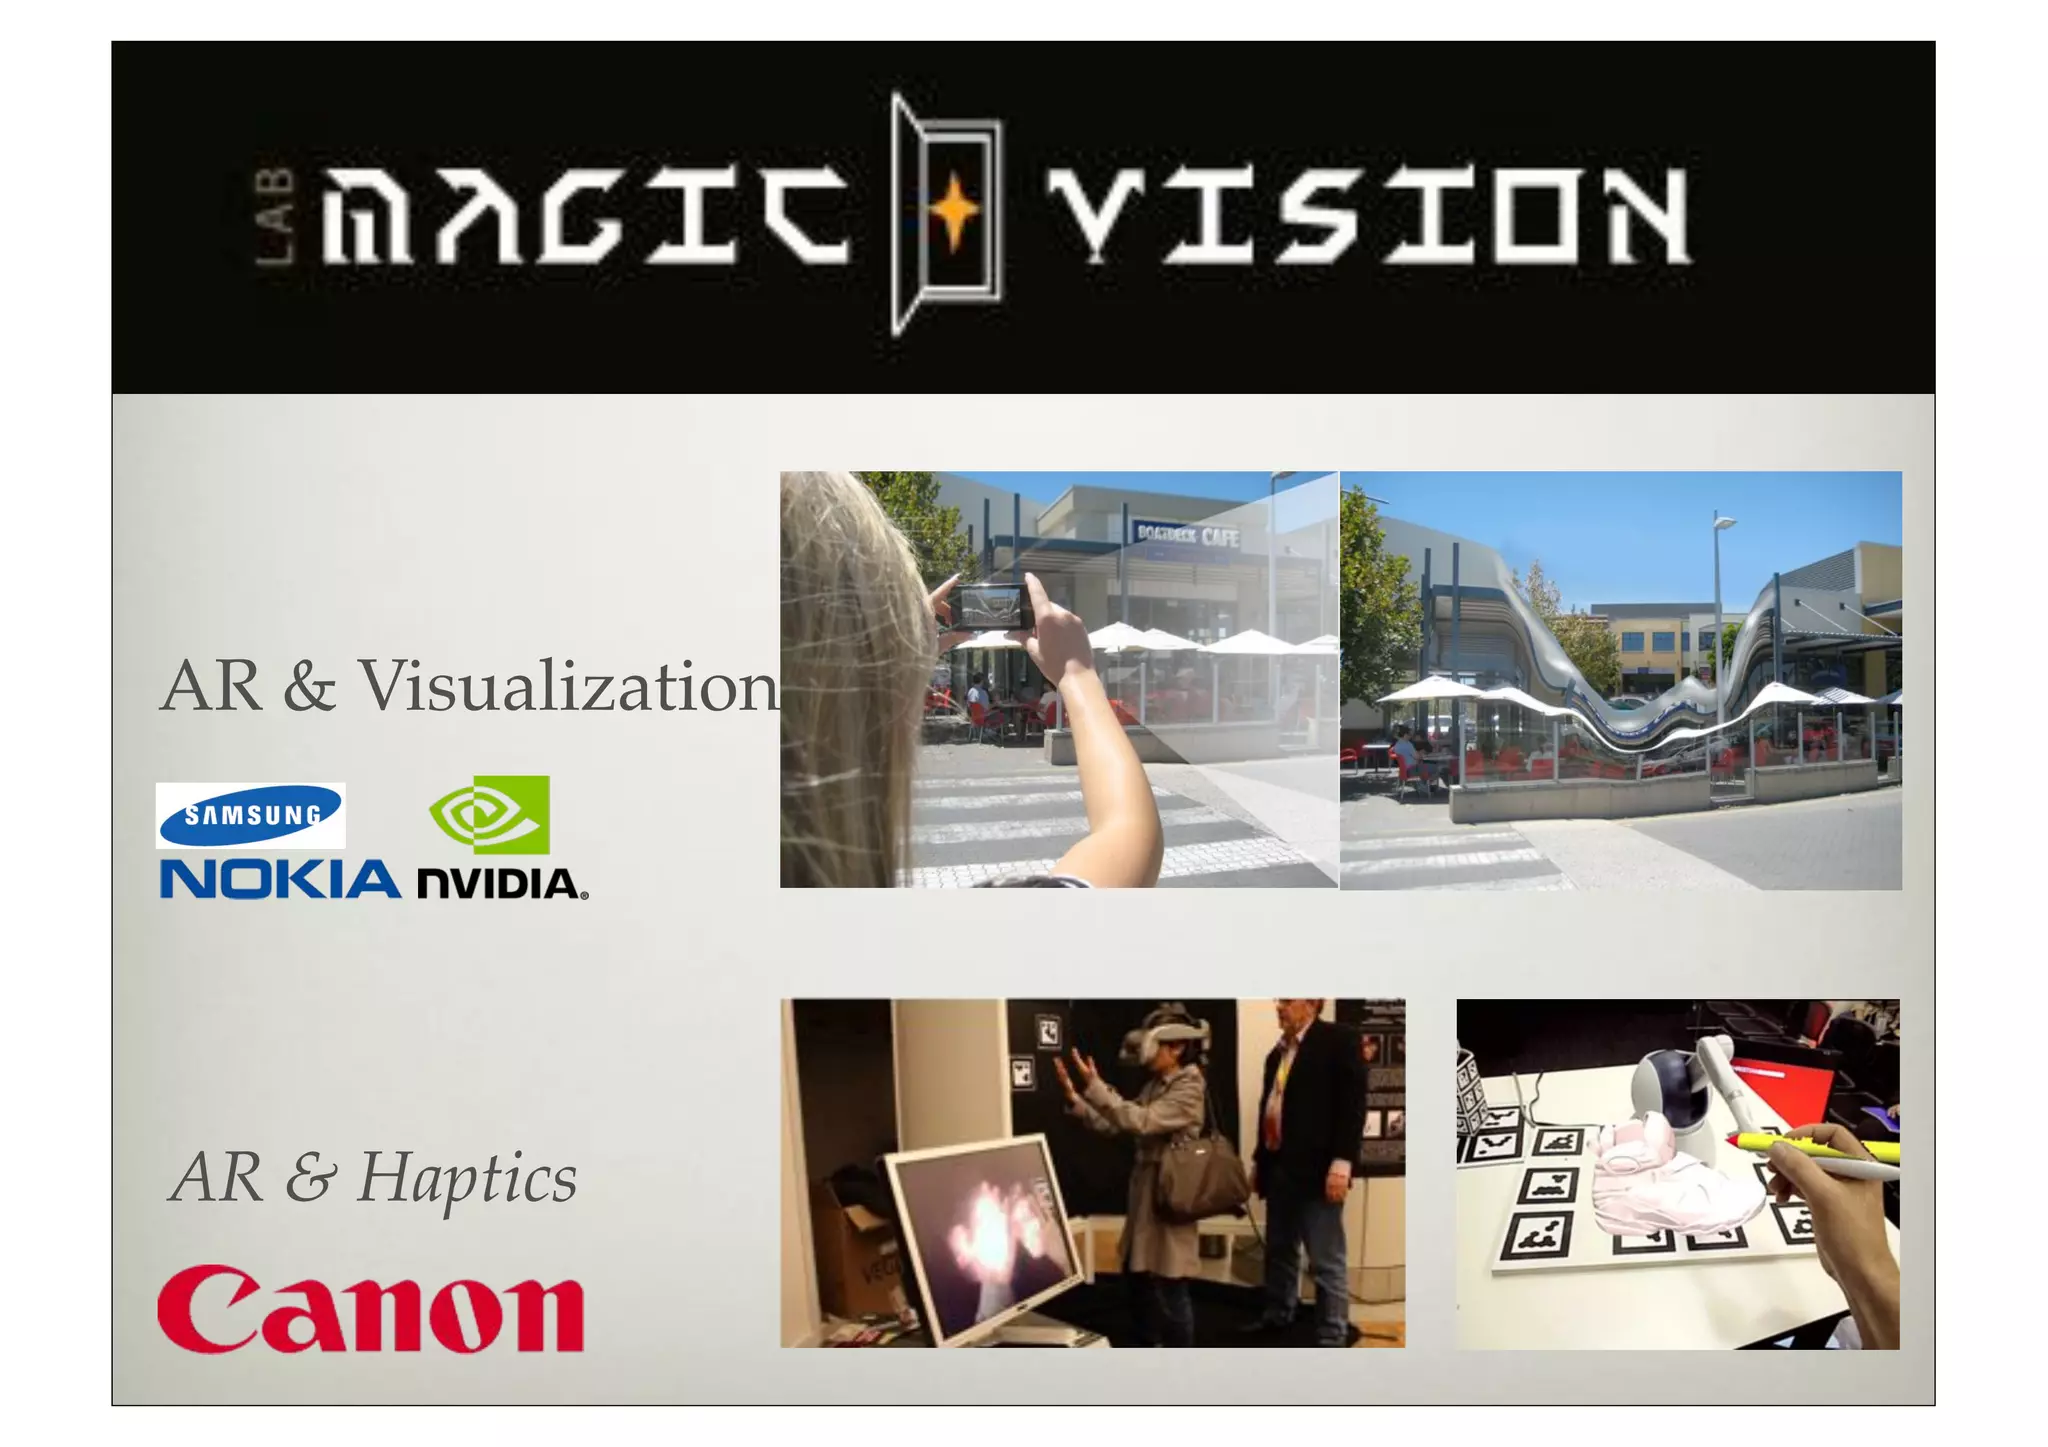
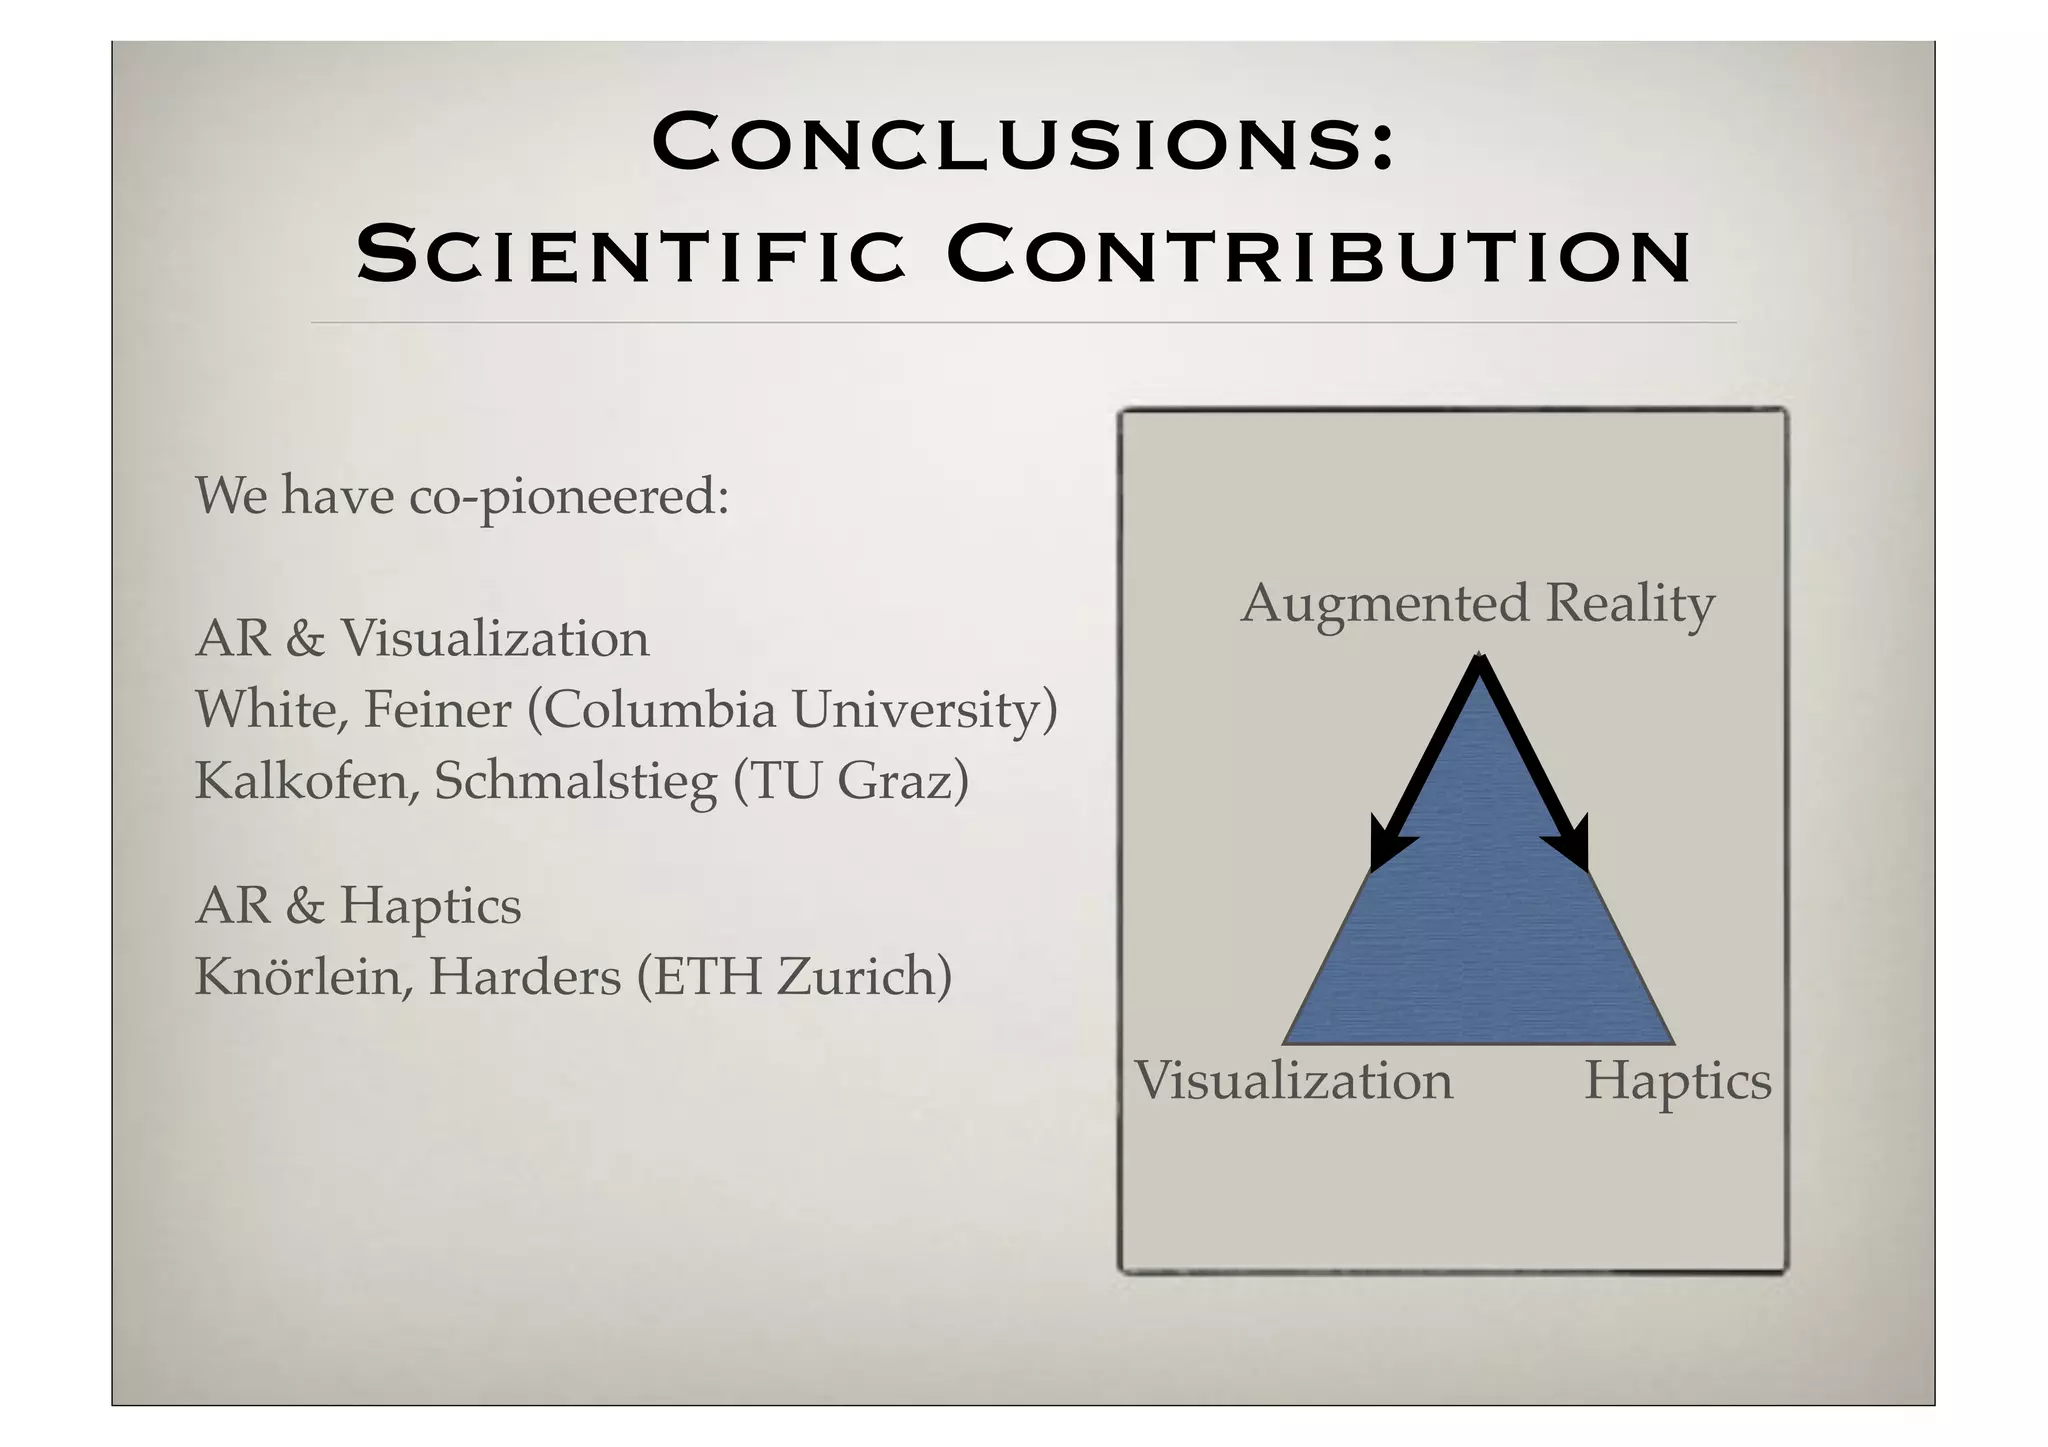
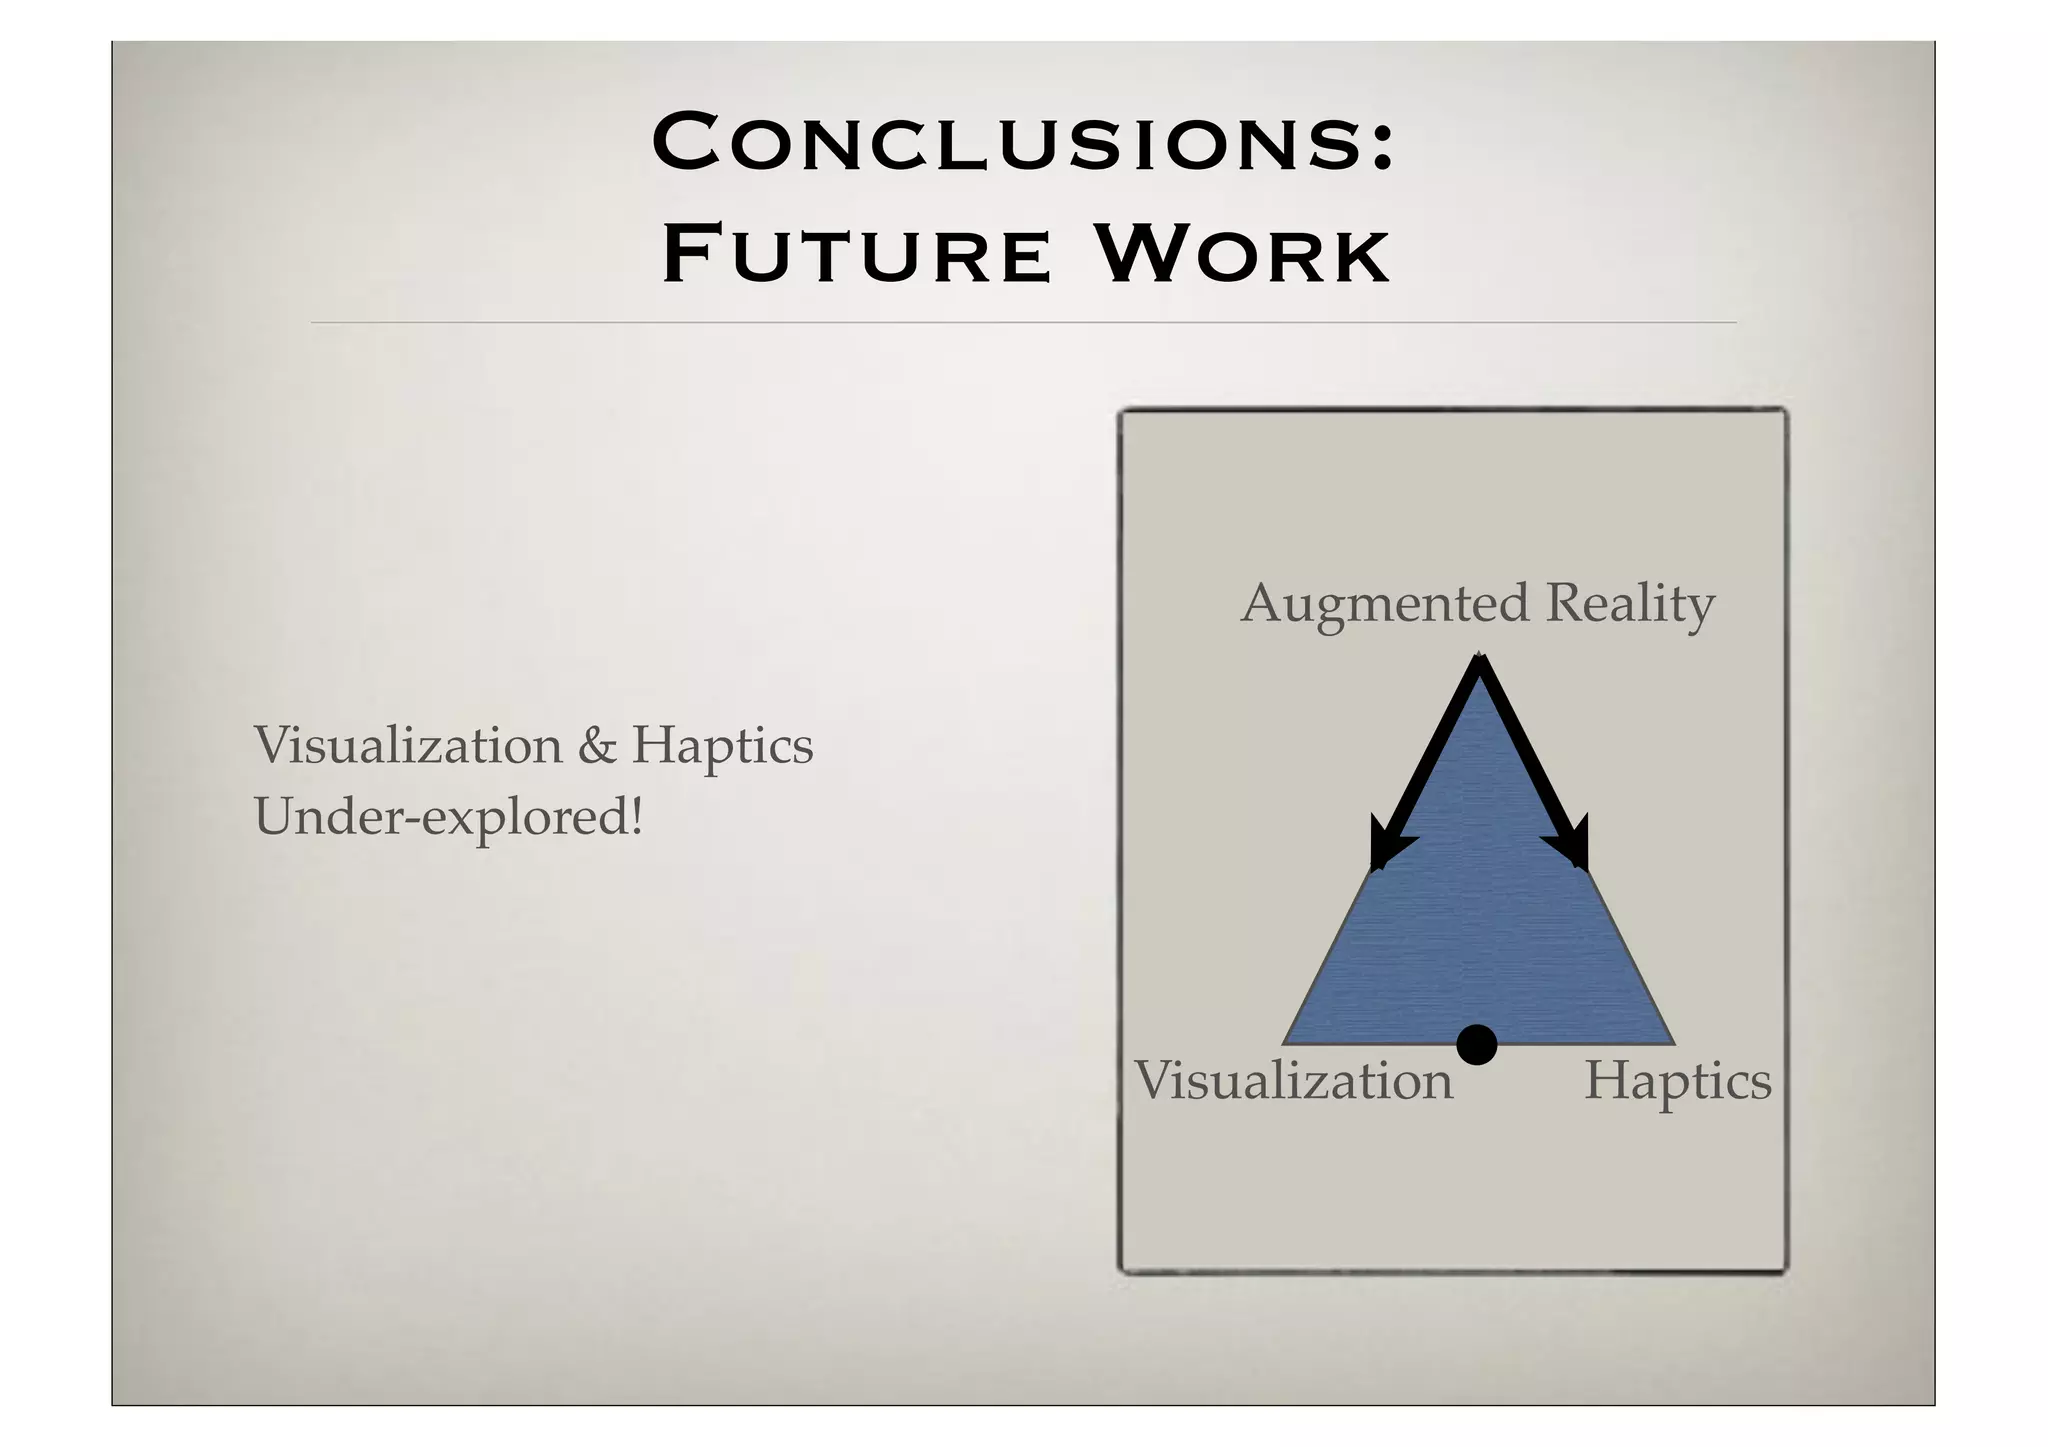
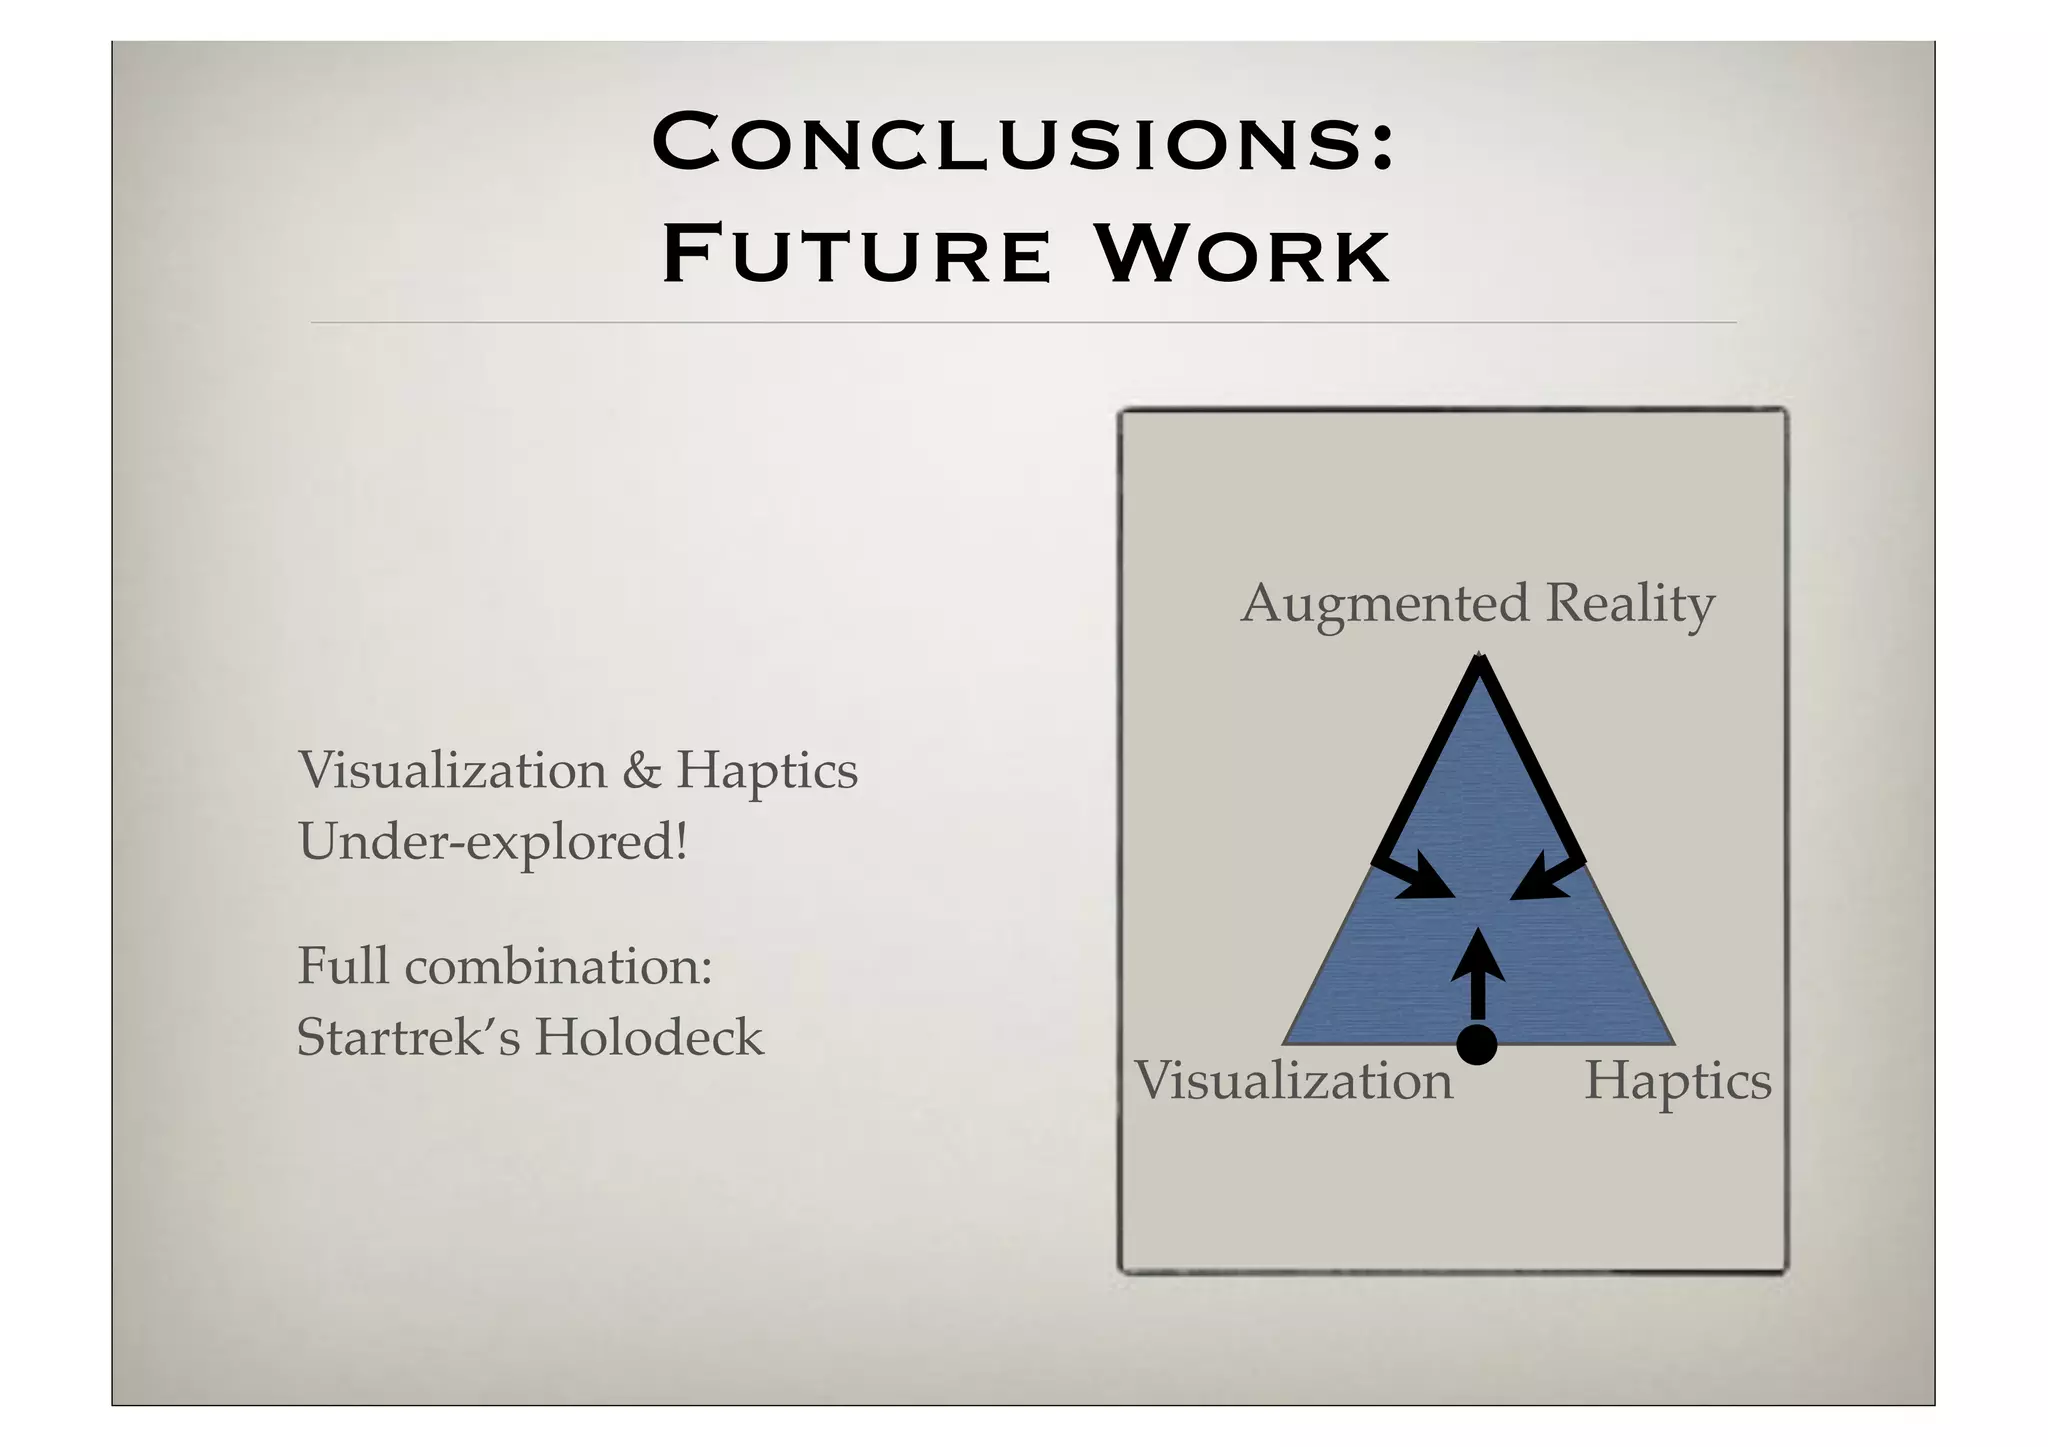
![Our Approach
Augmented Reality
Visualization:
“seeing the unseen”
[McCormick, 1988]
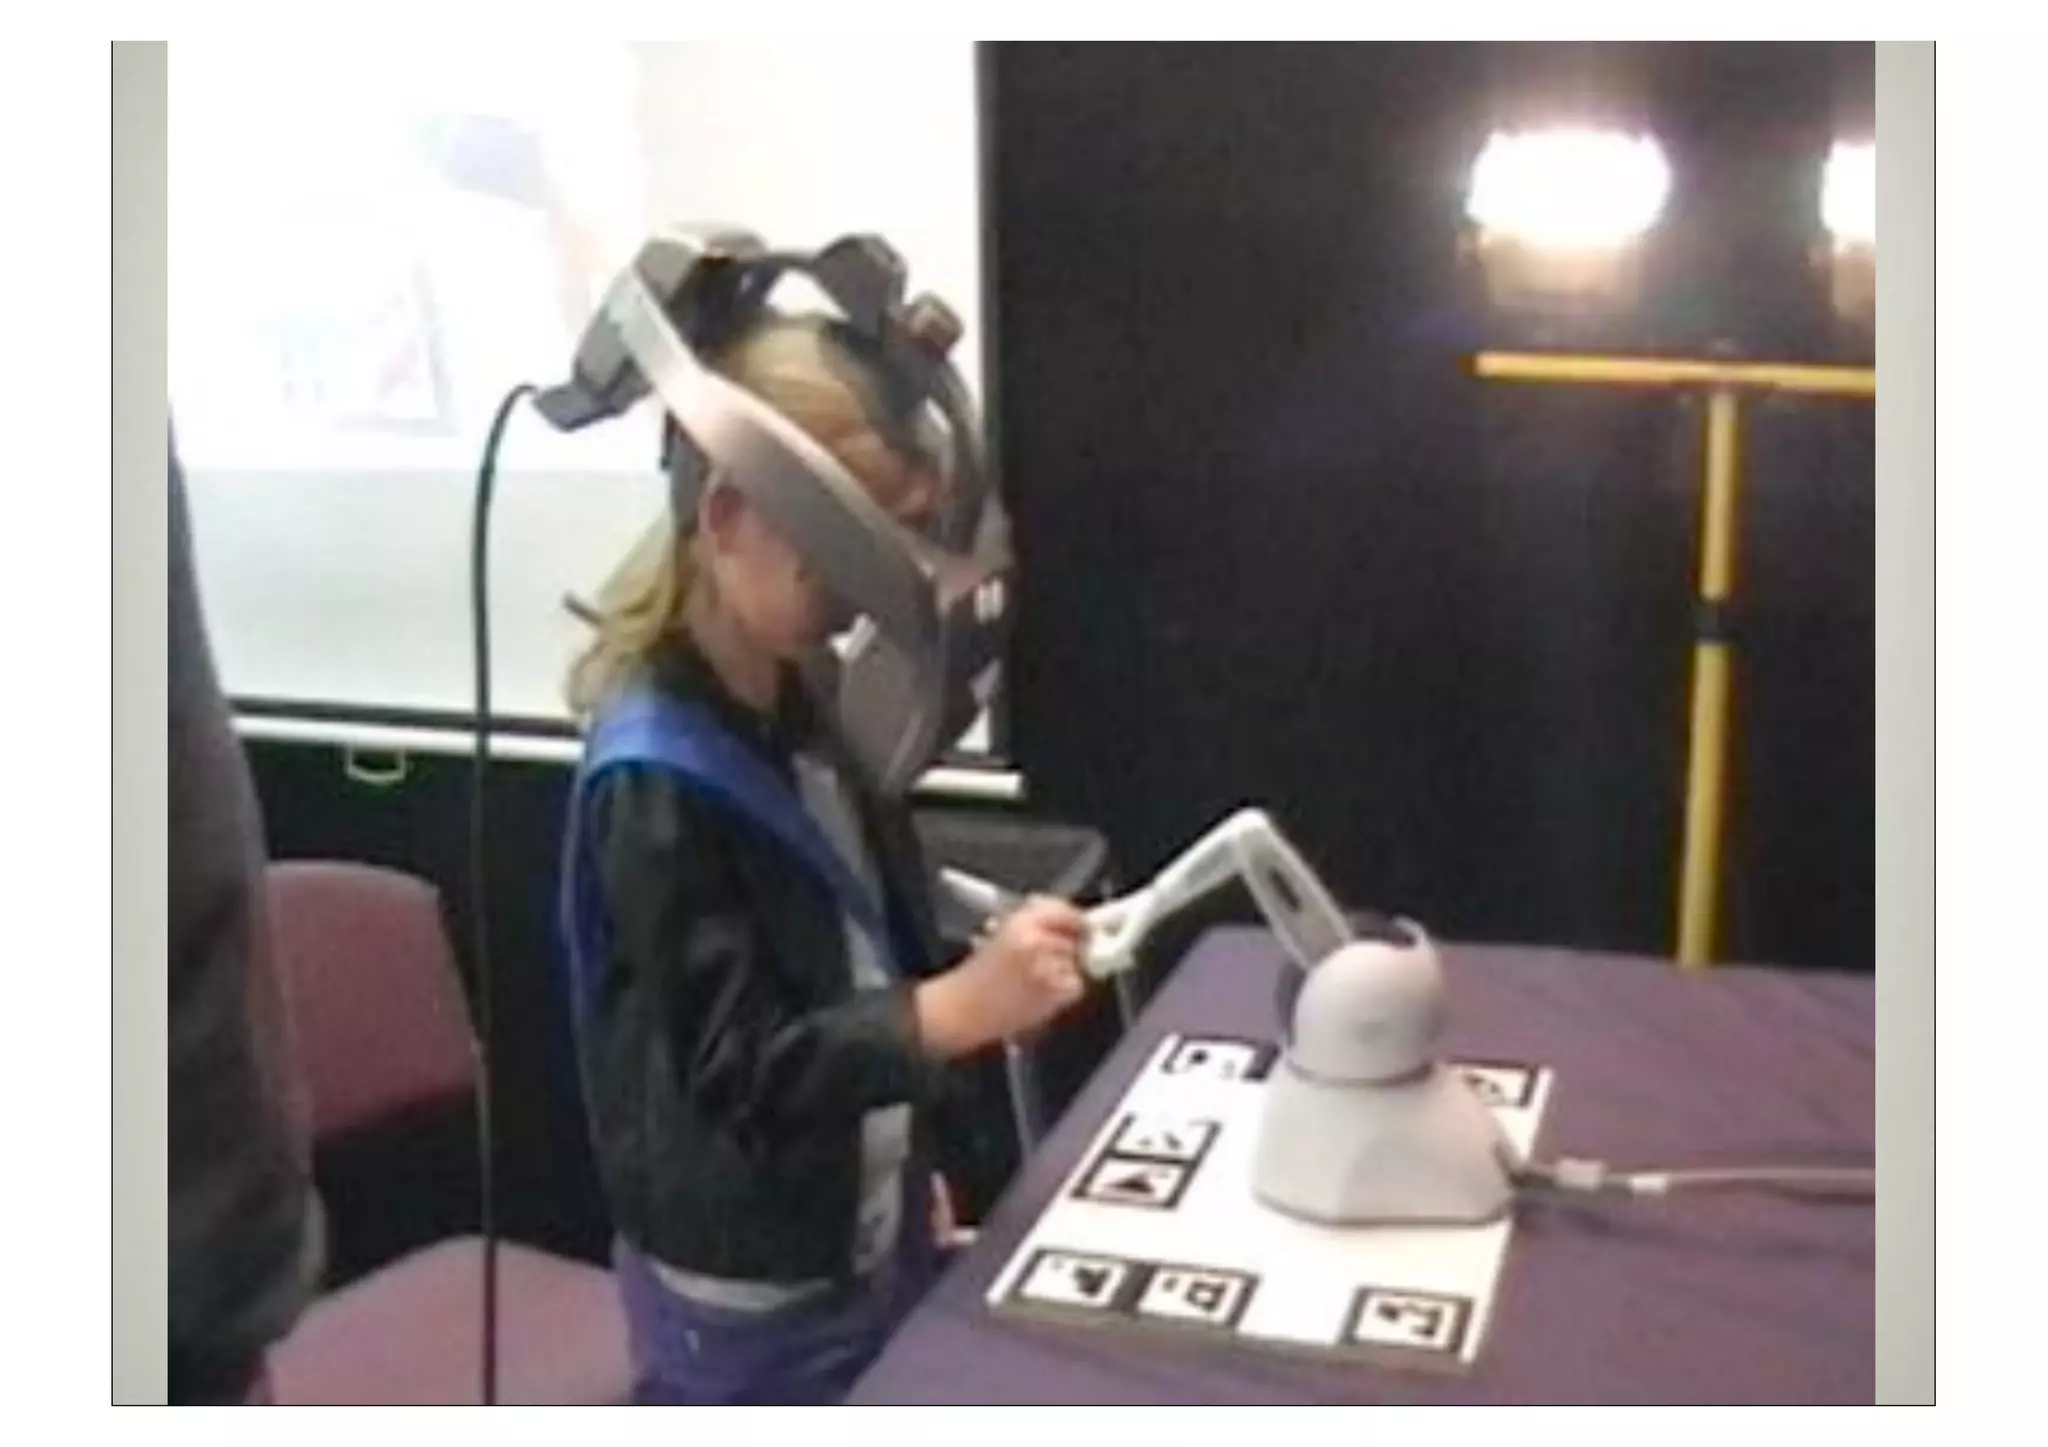
Haptics: AR for the
sense of touch
Visualization Haptics](https://image.slidesharecdn.com/keynote-vec-2012-120921034232-phpapp01/75/Keynote-Virtual-Efficiency-Congress-2012-12-2048.jpg)

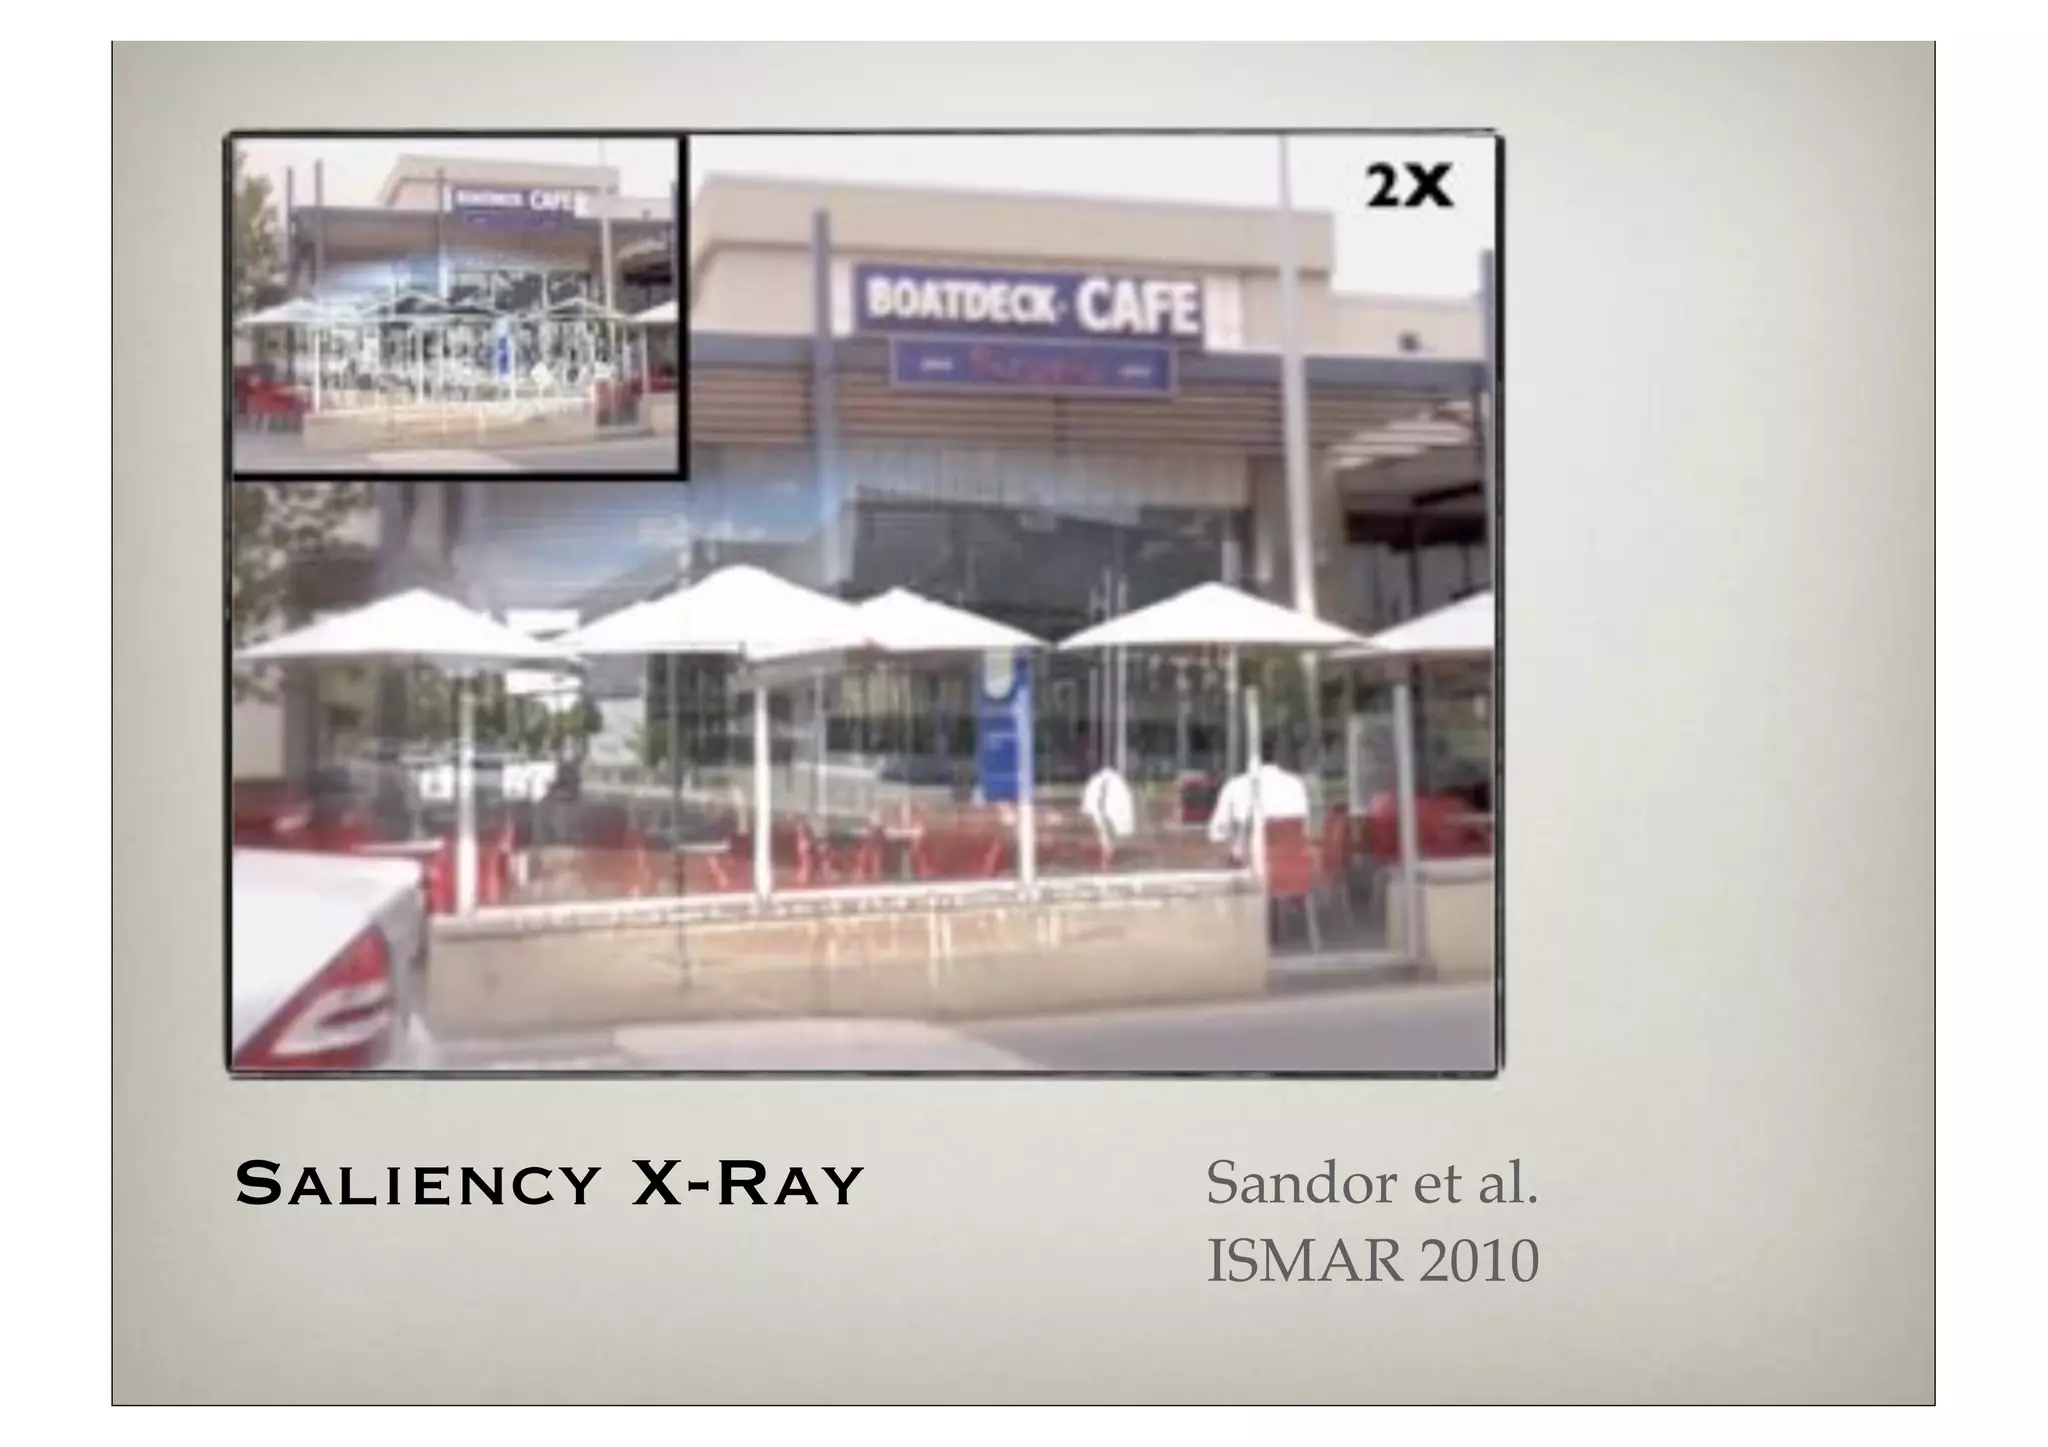
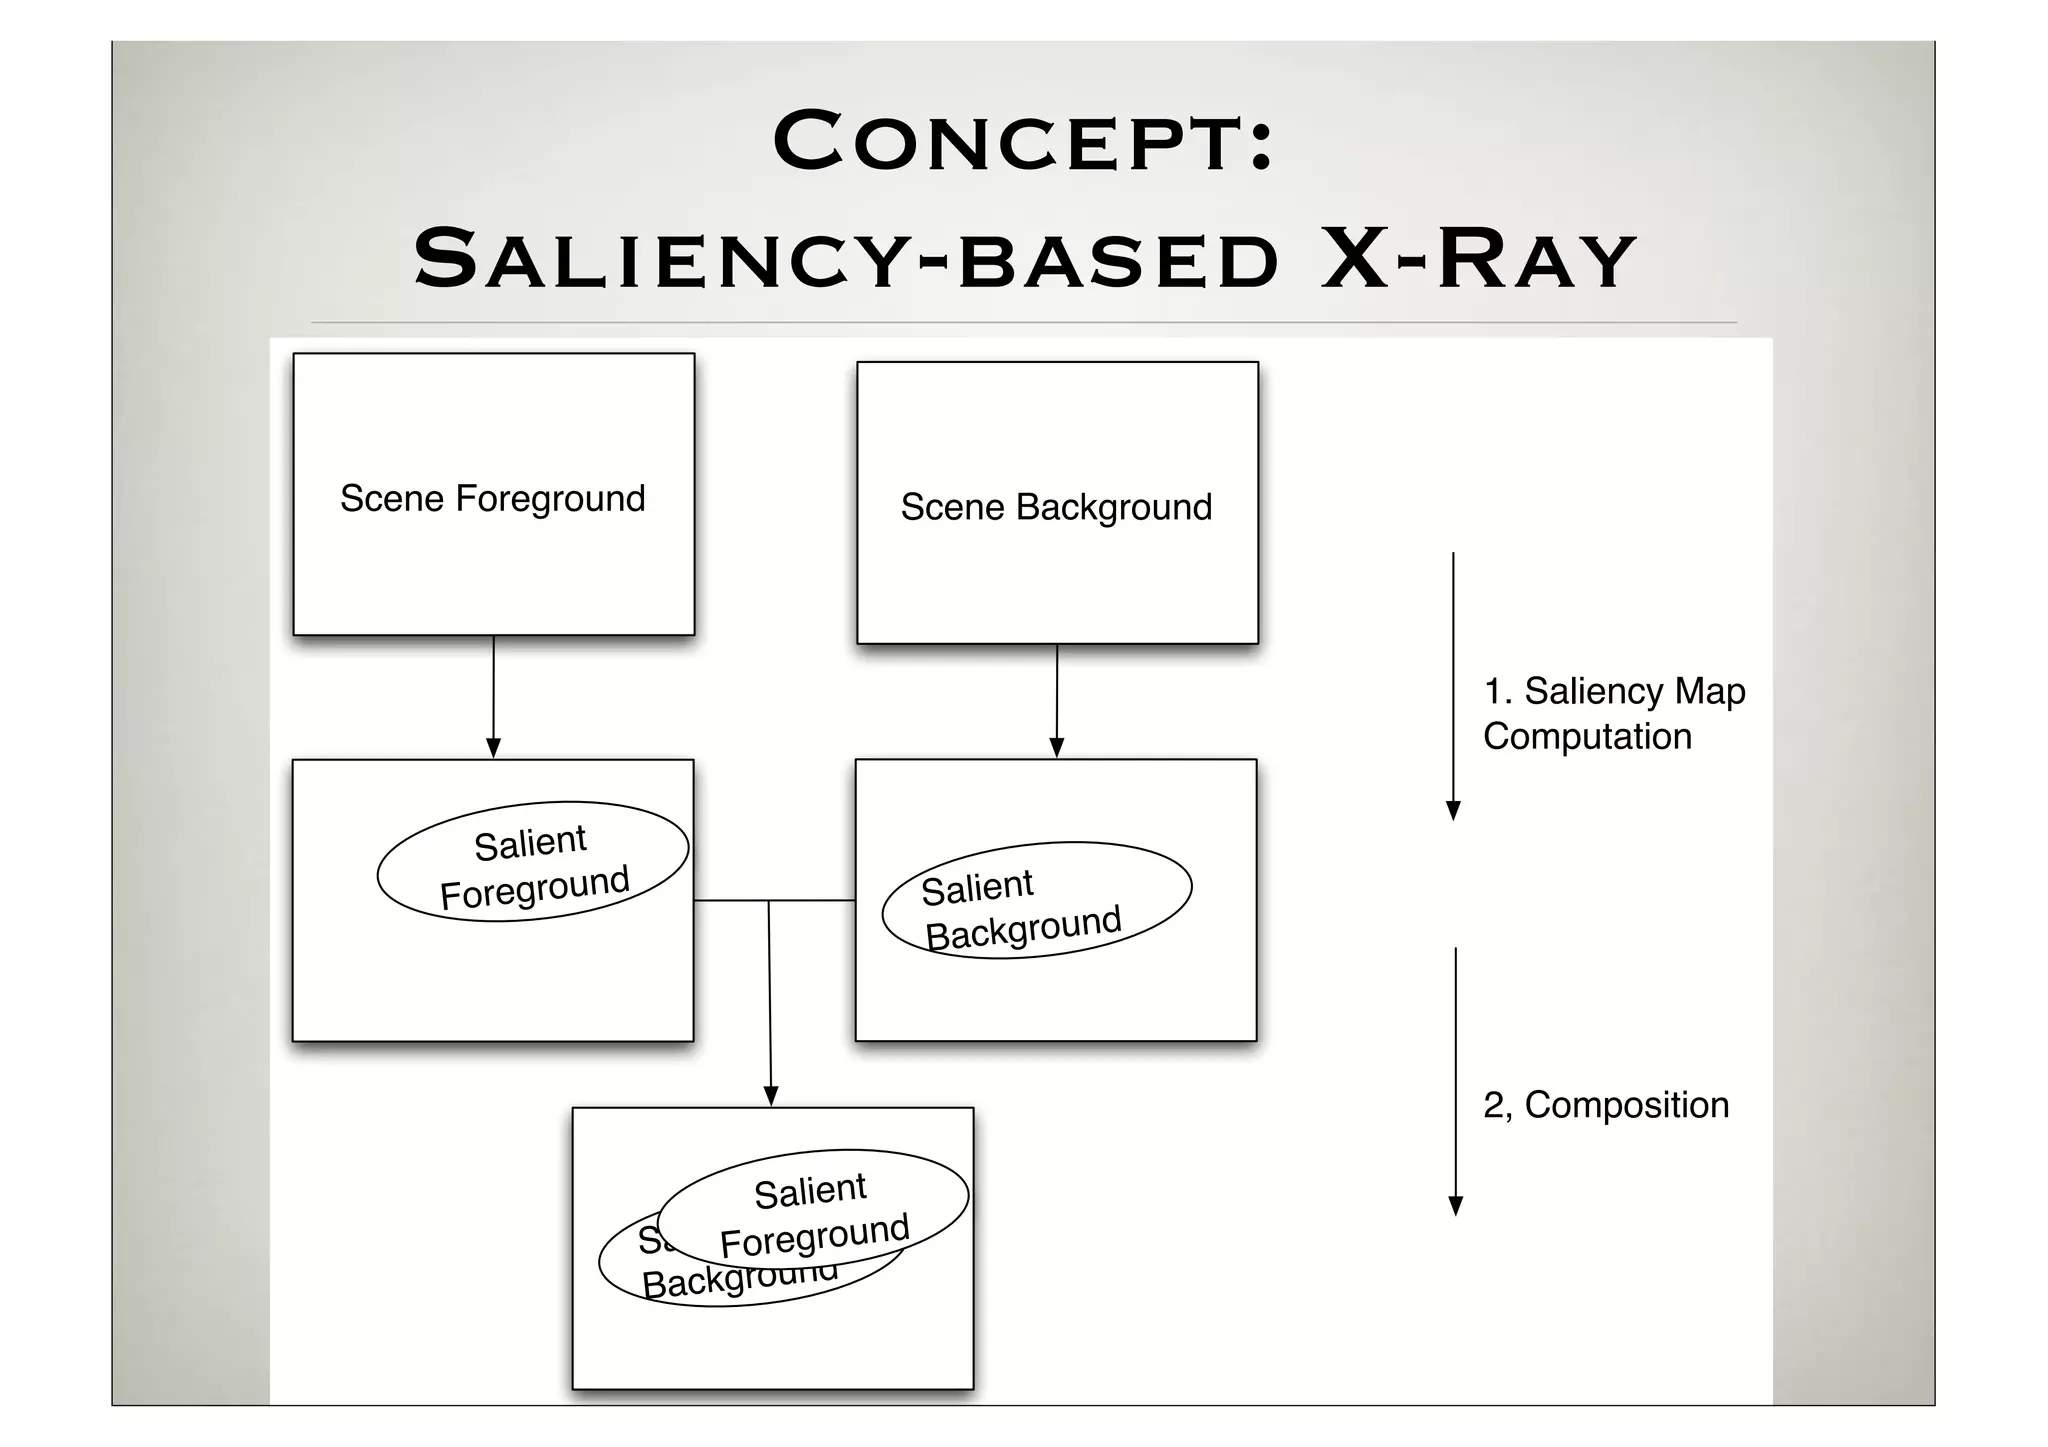
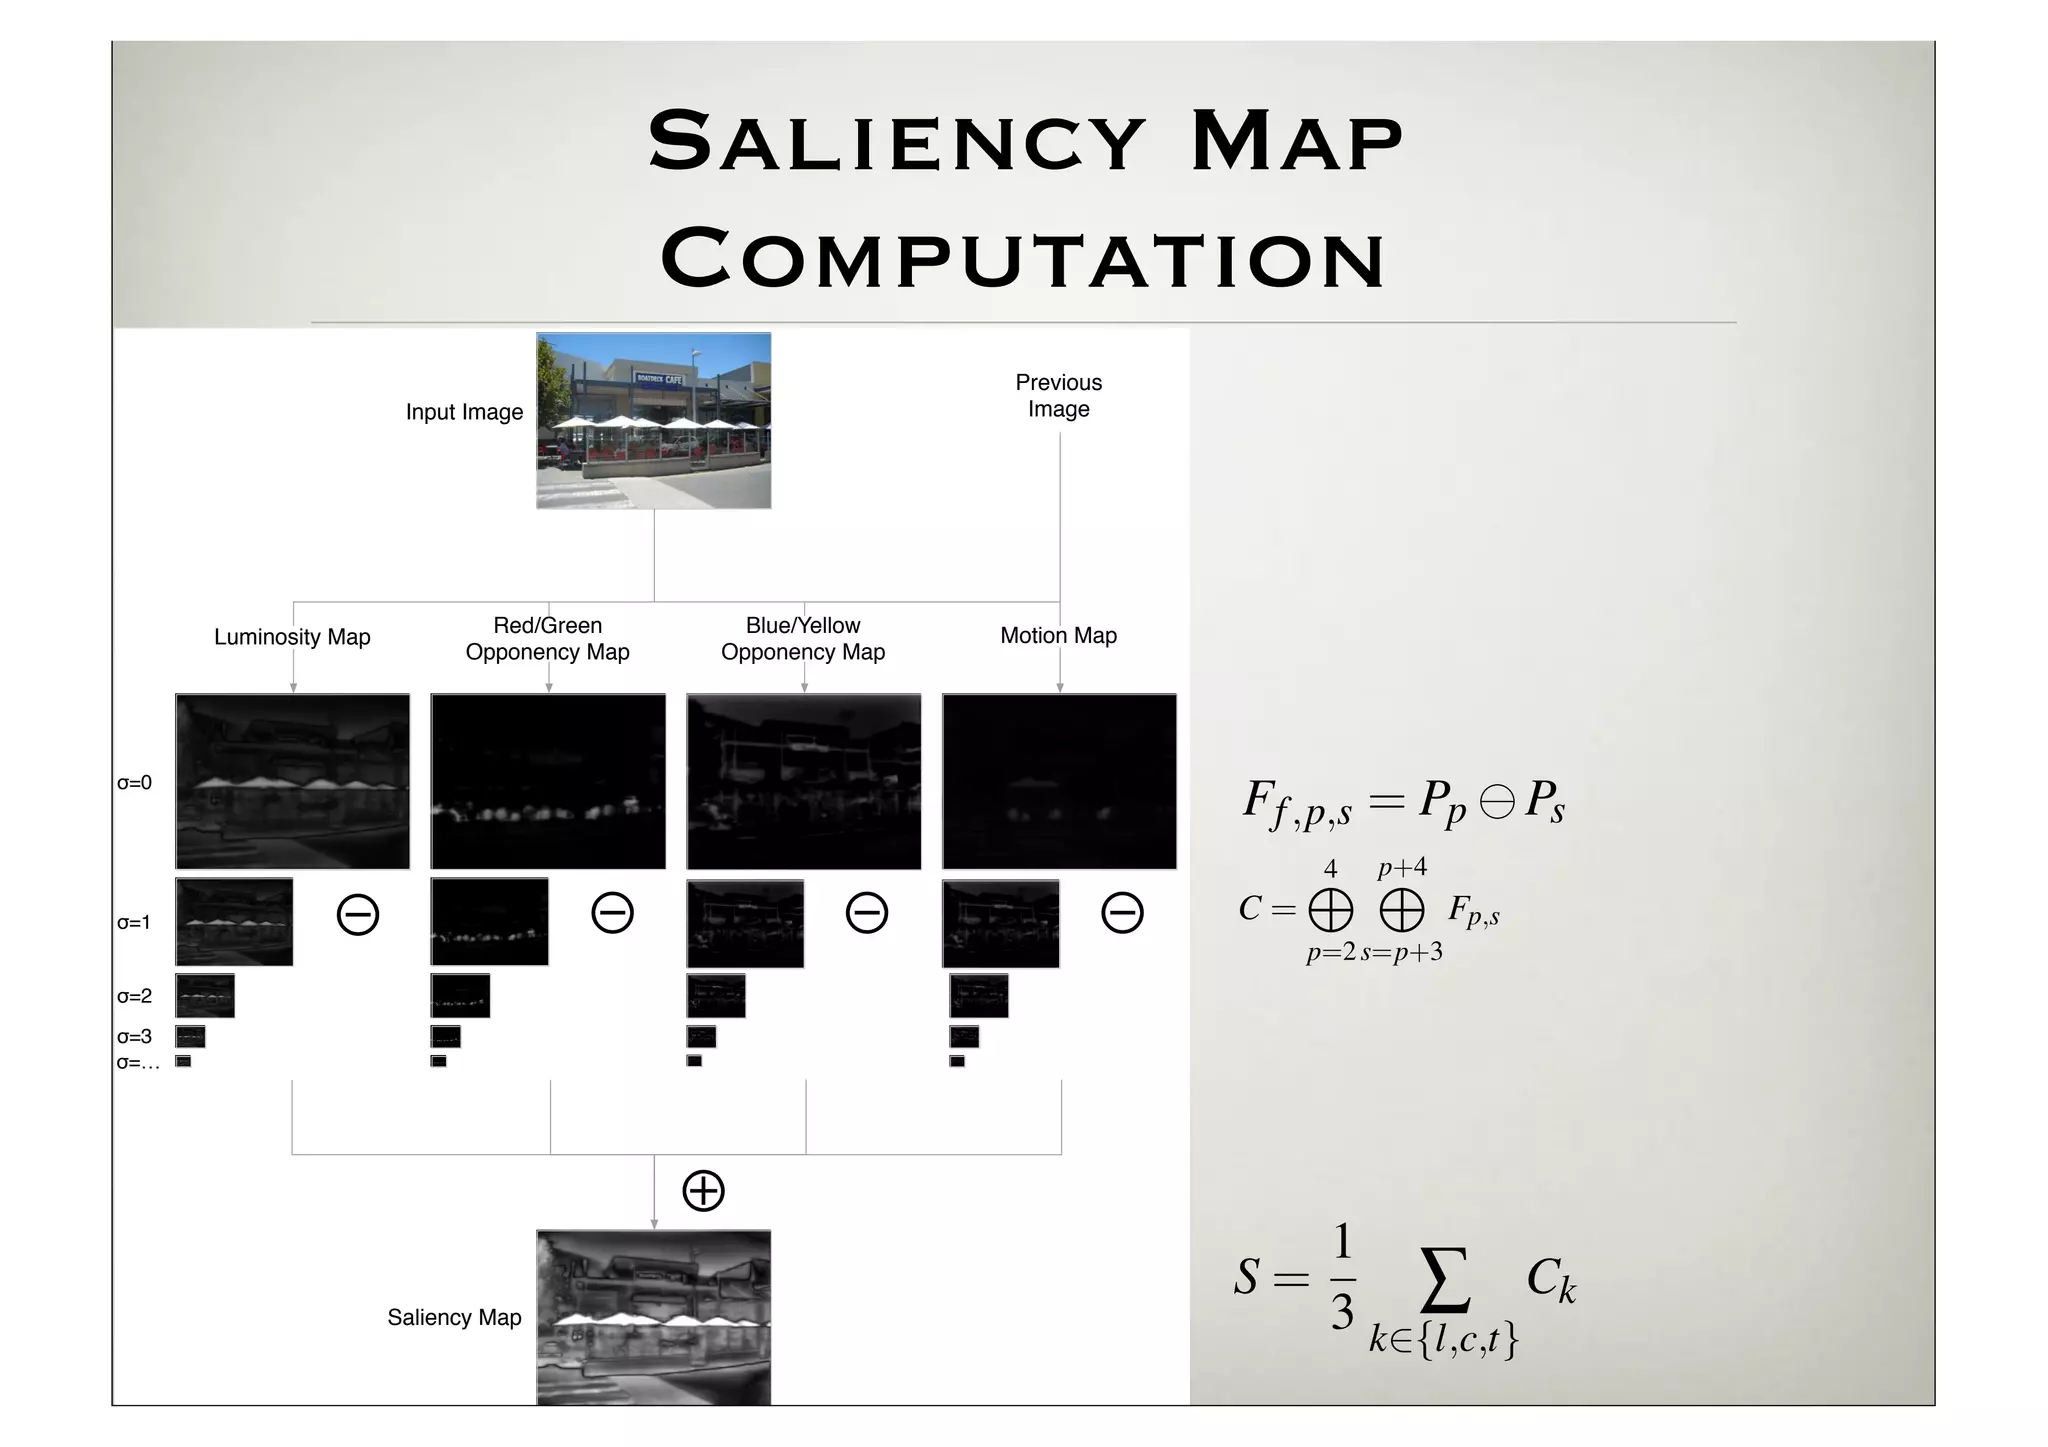
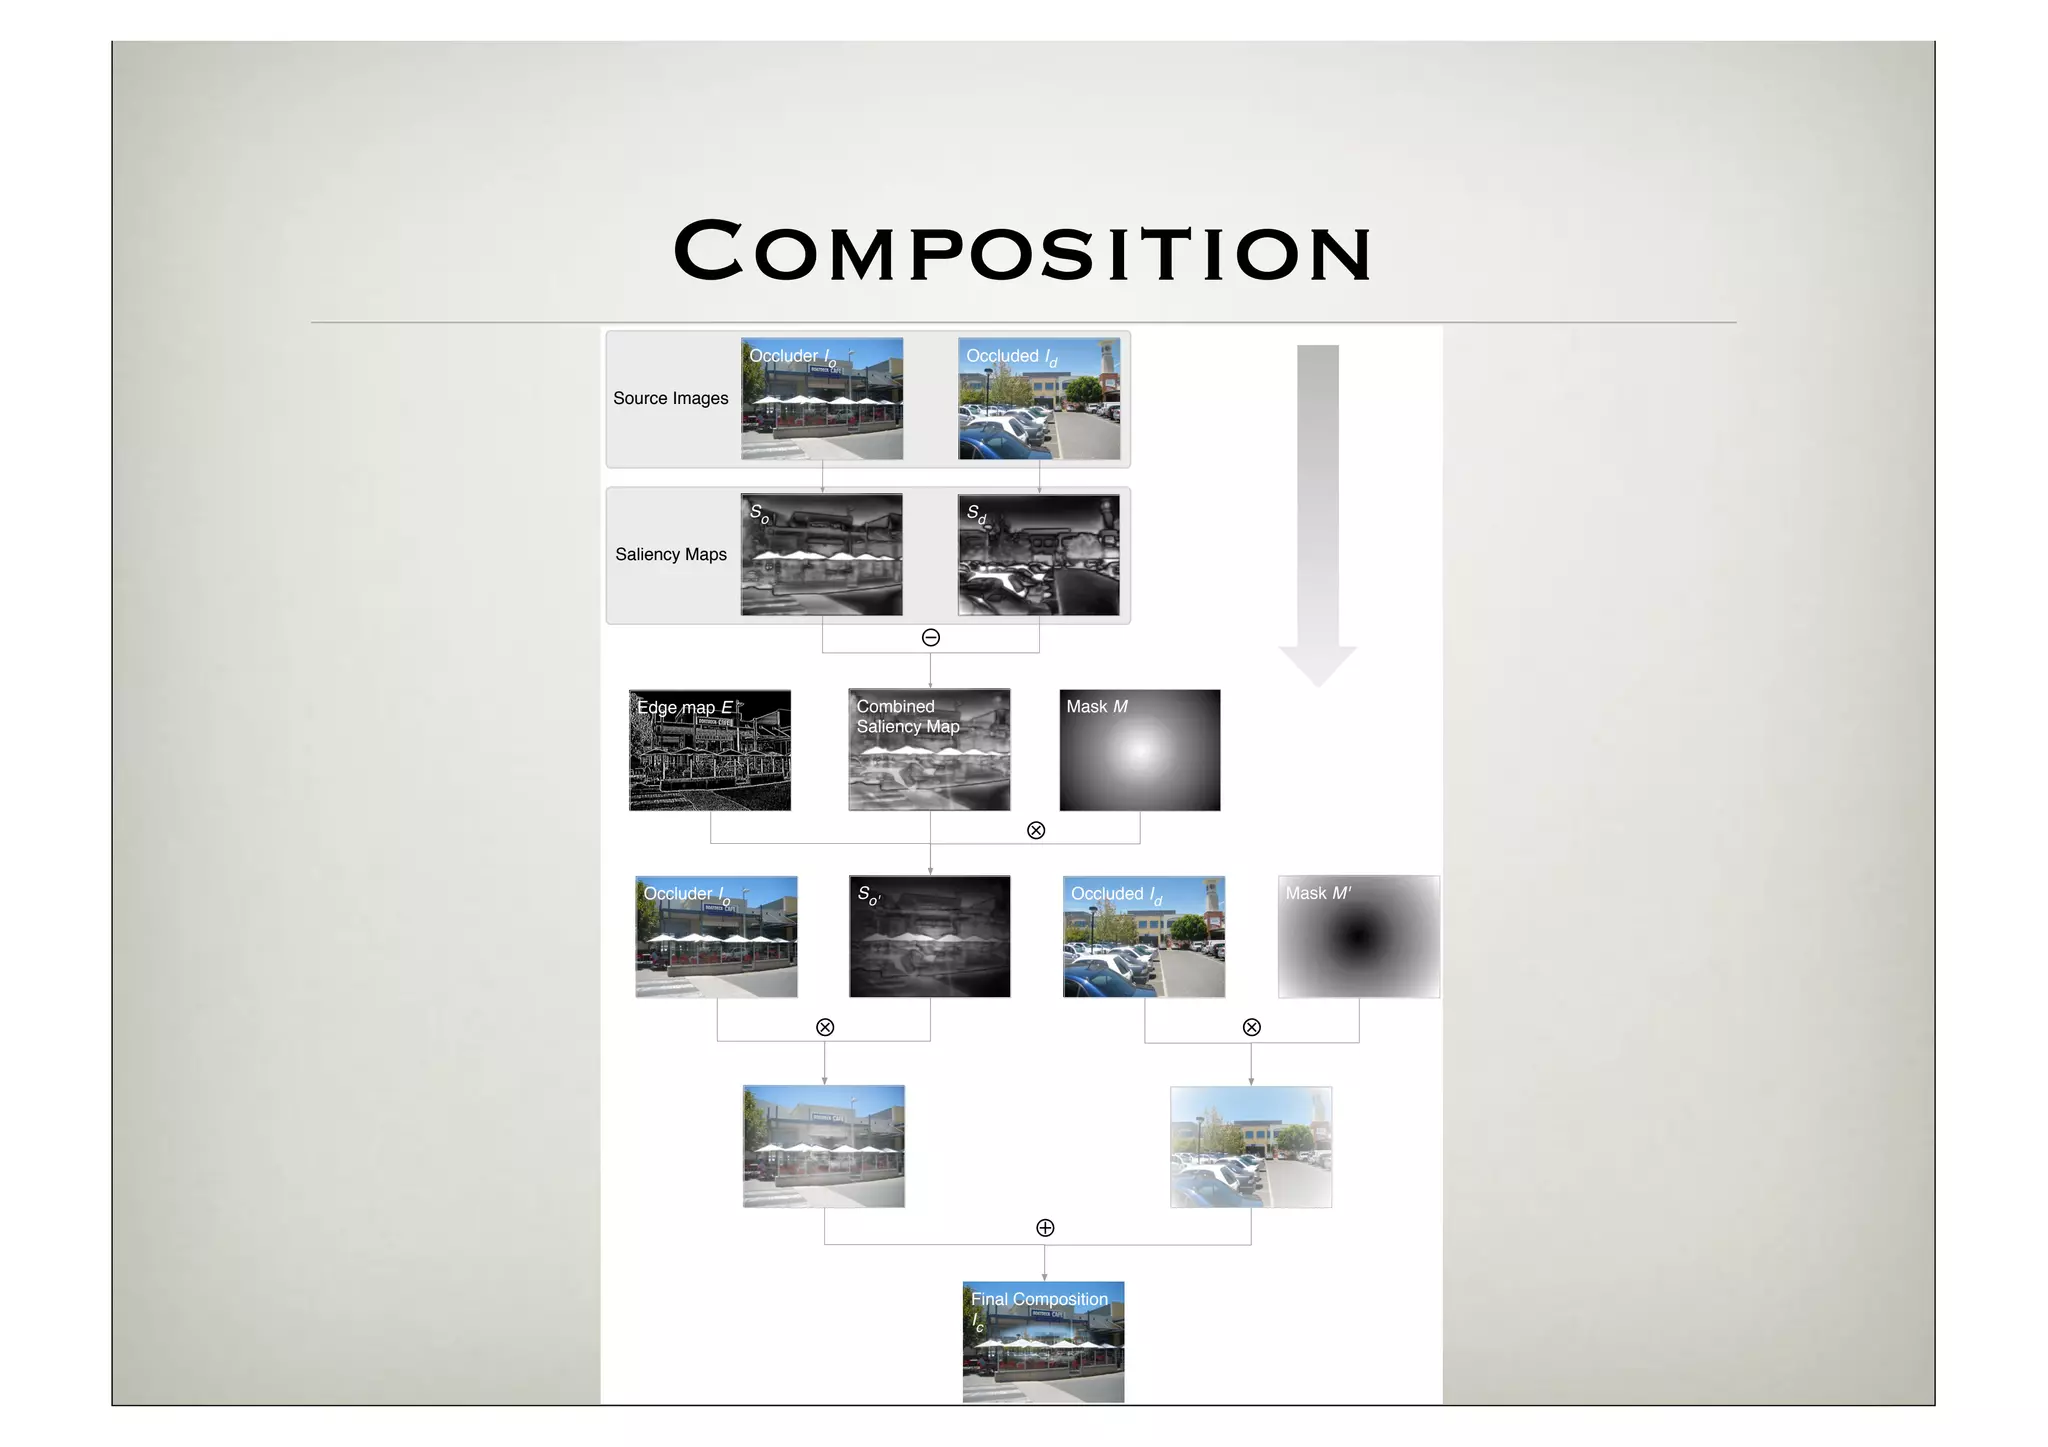
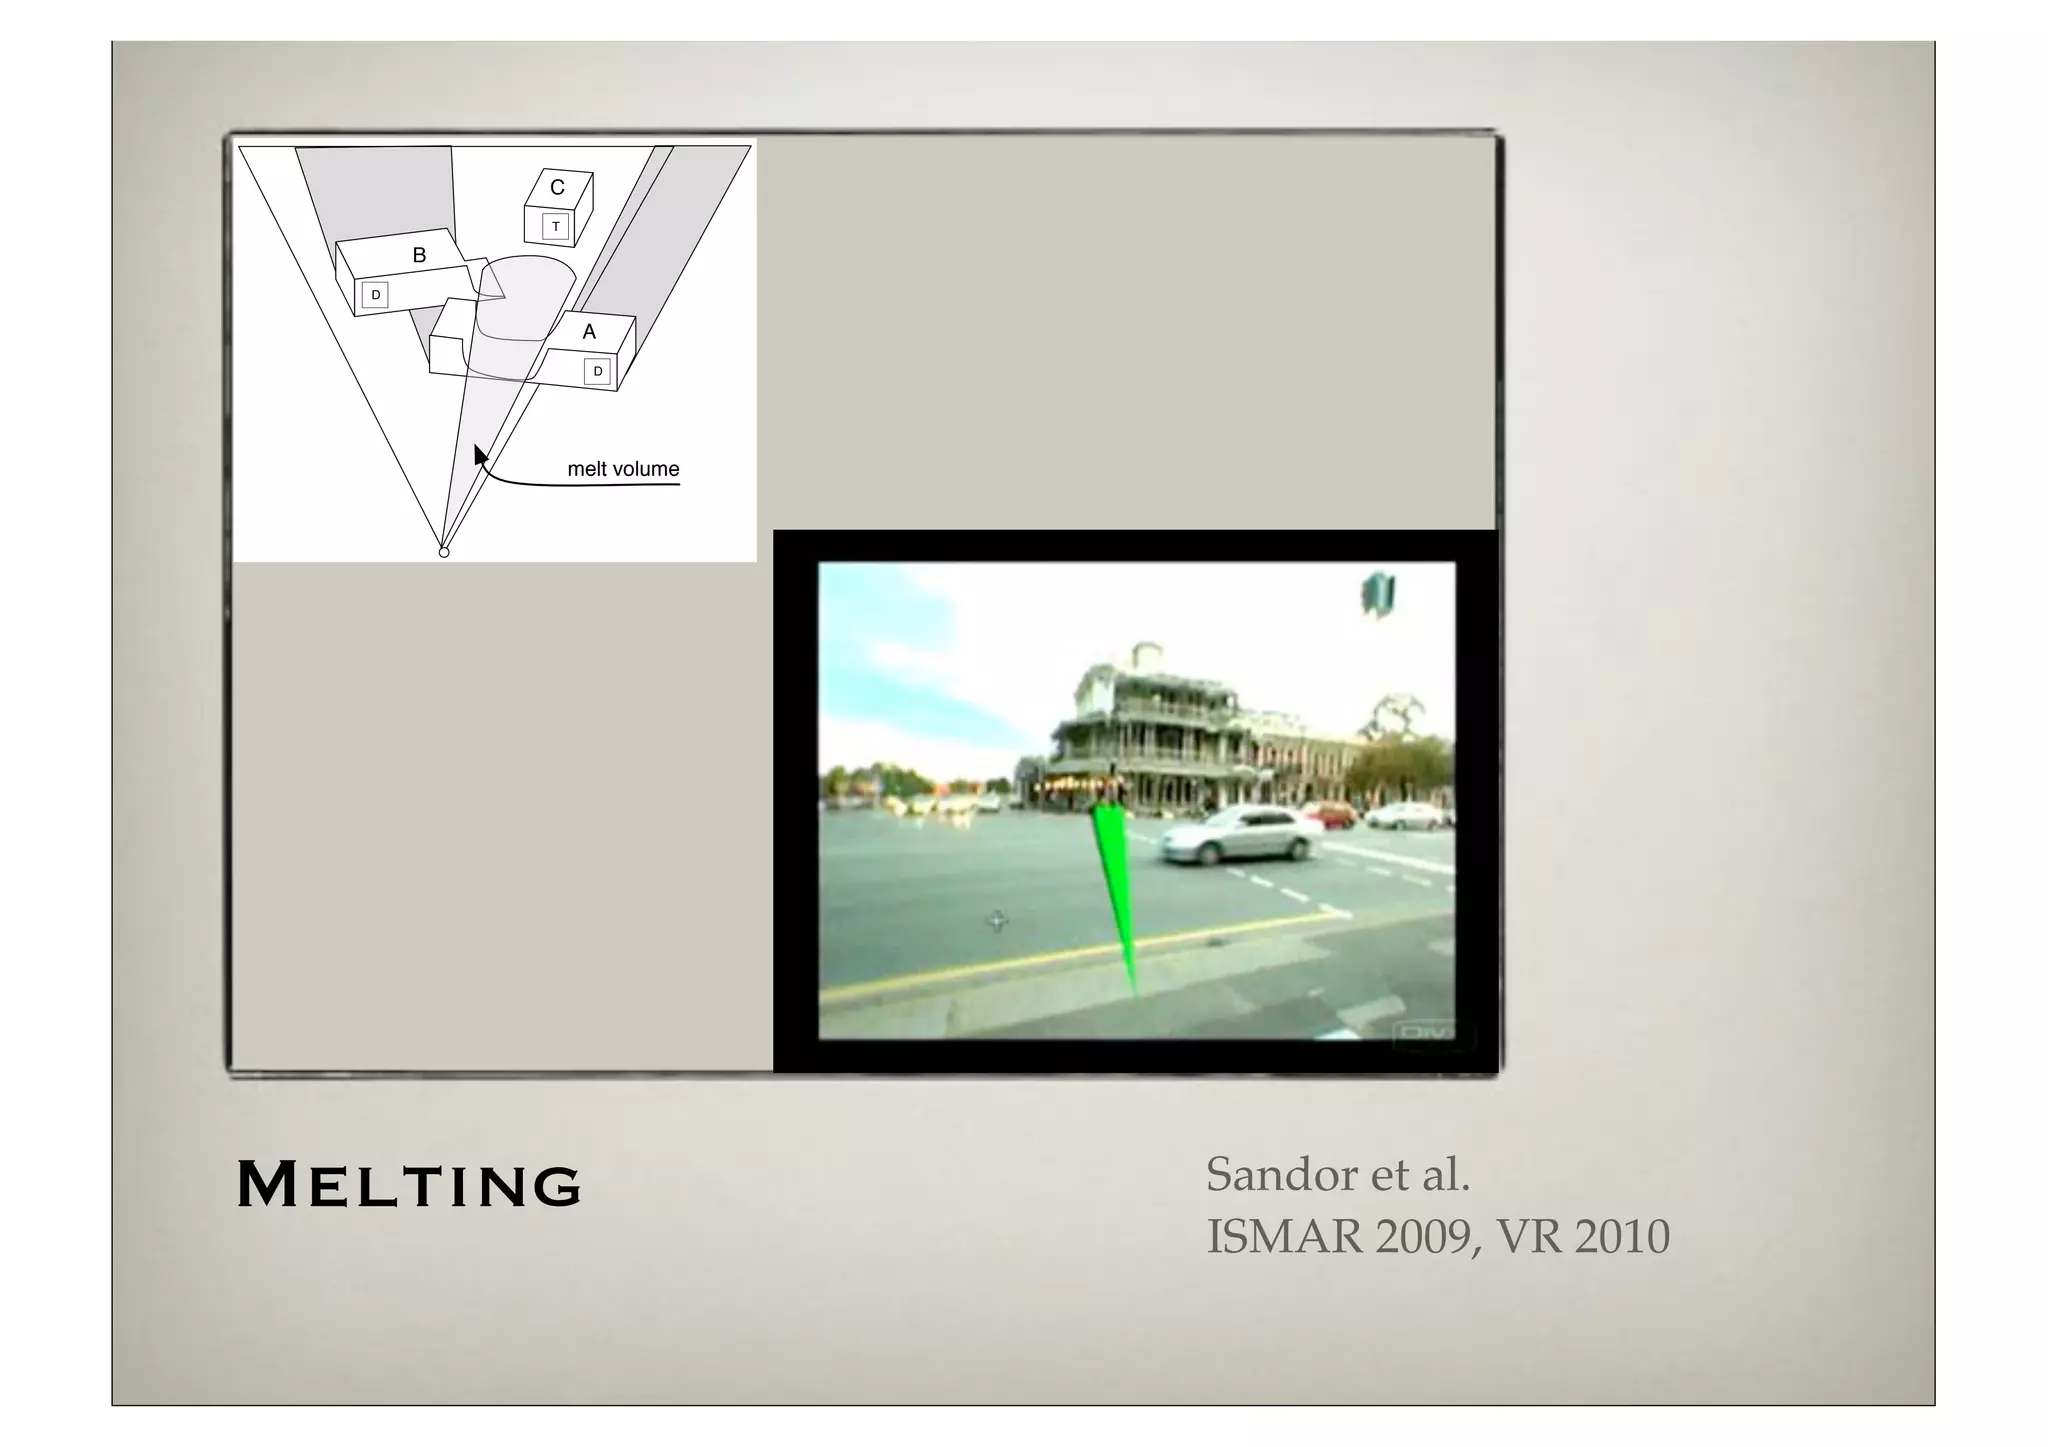
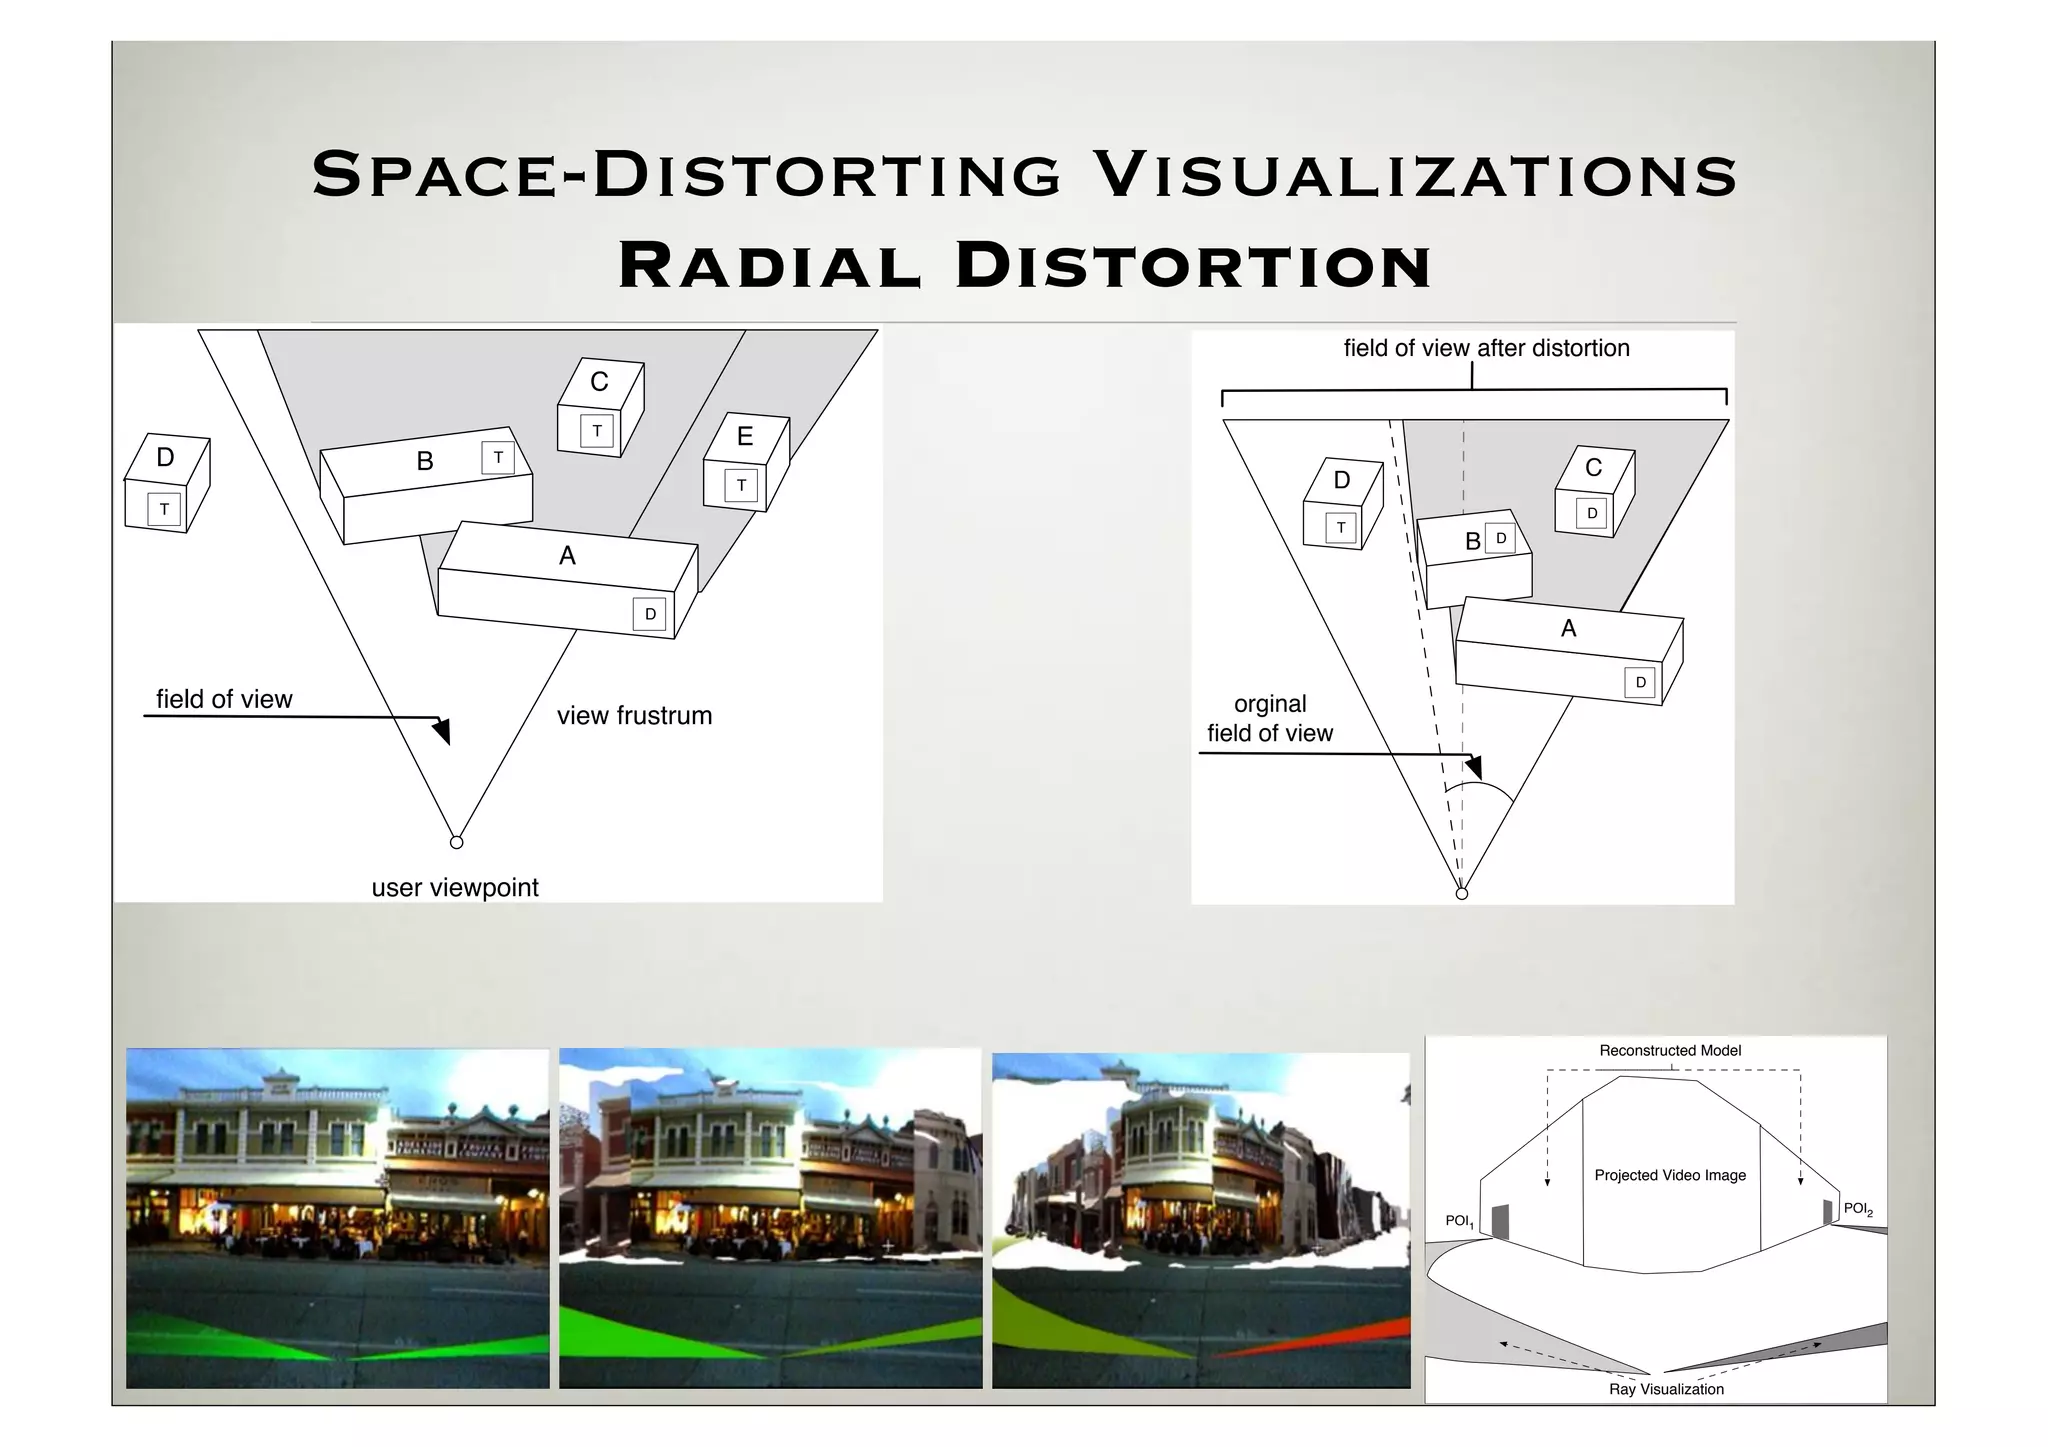
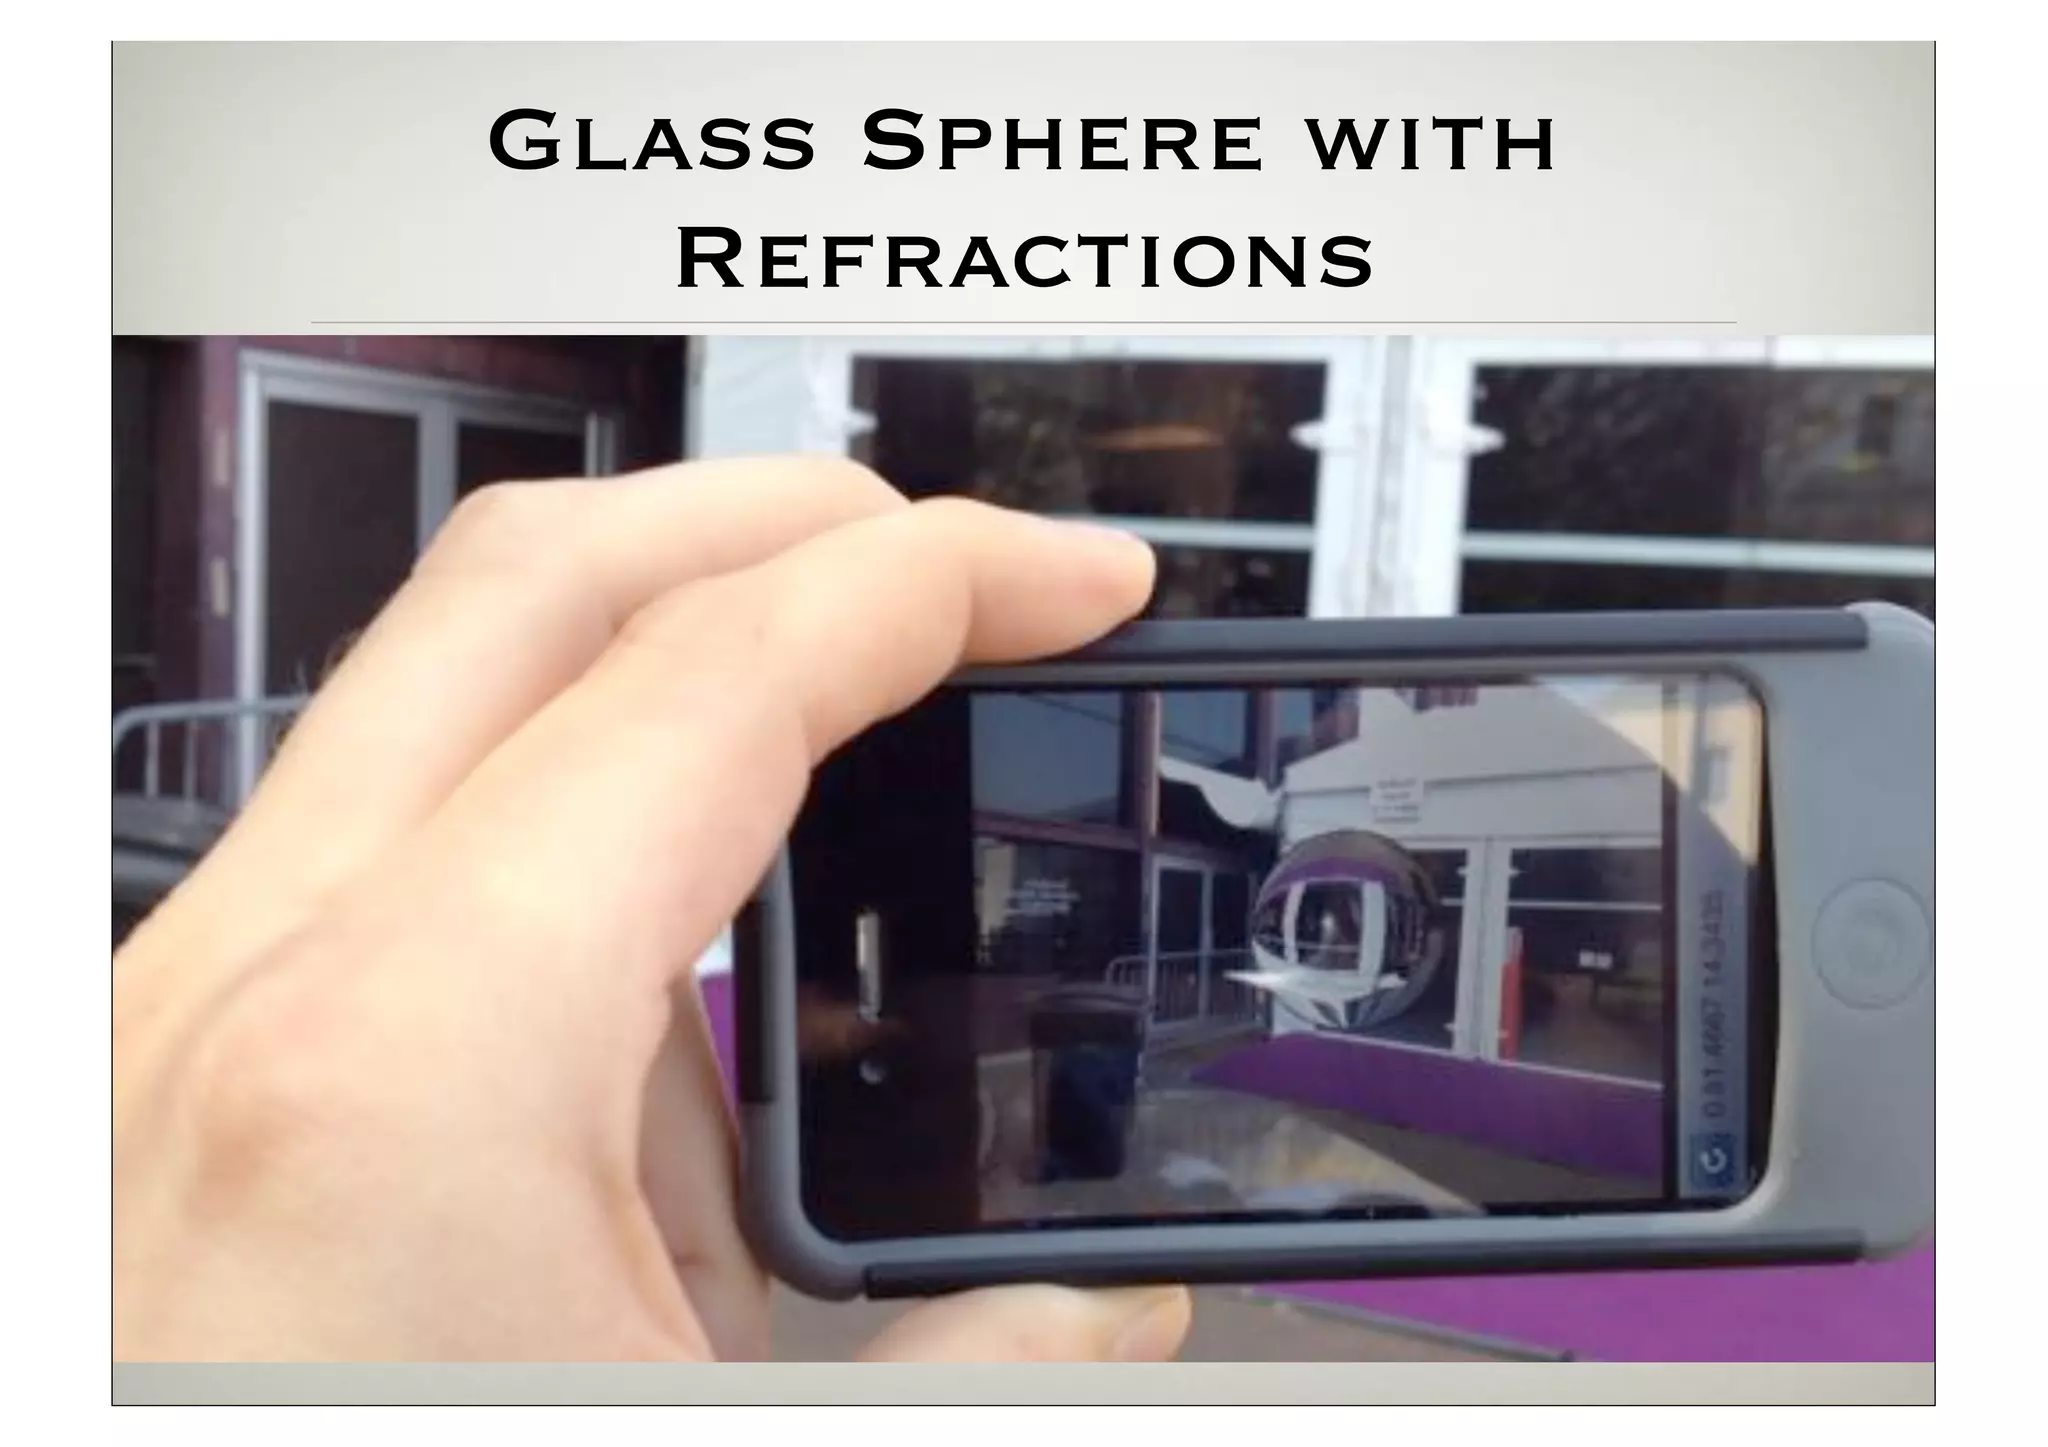
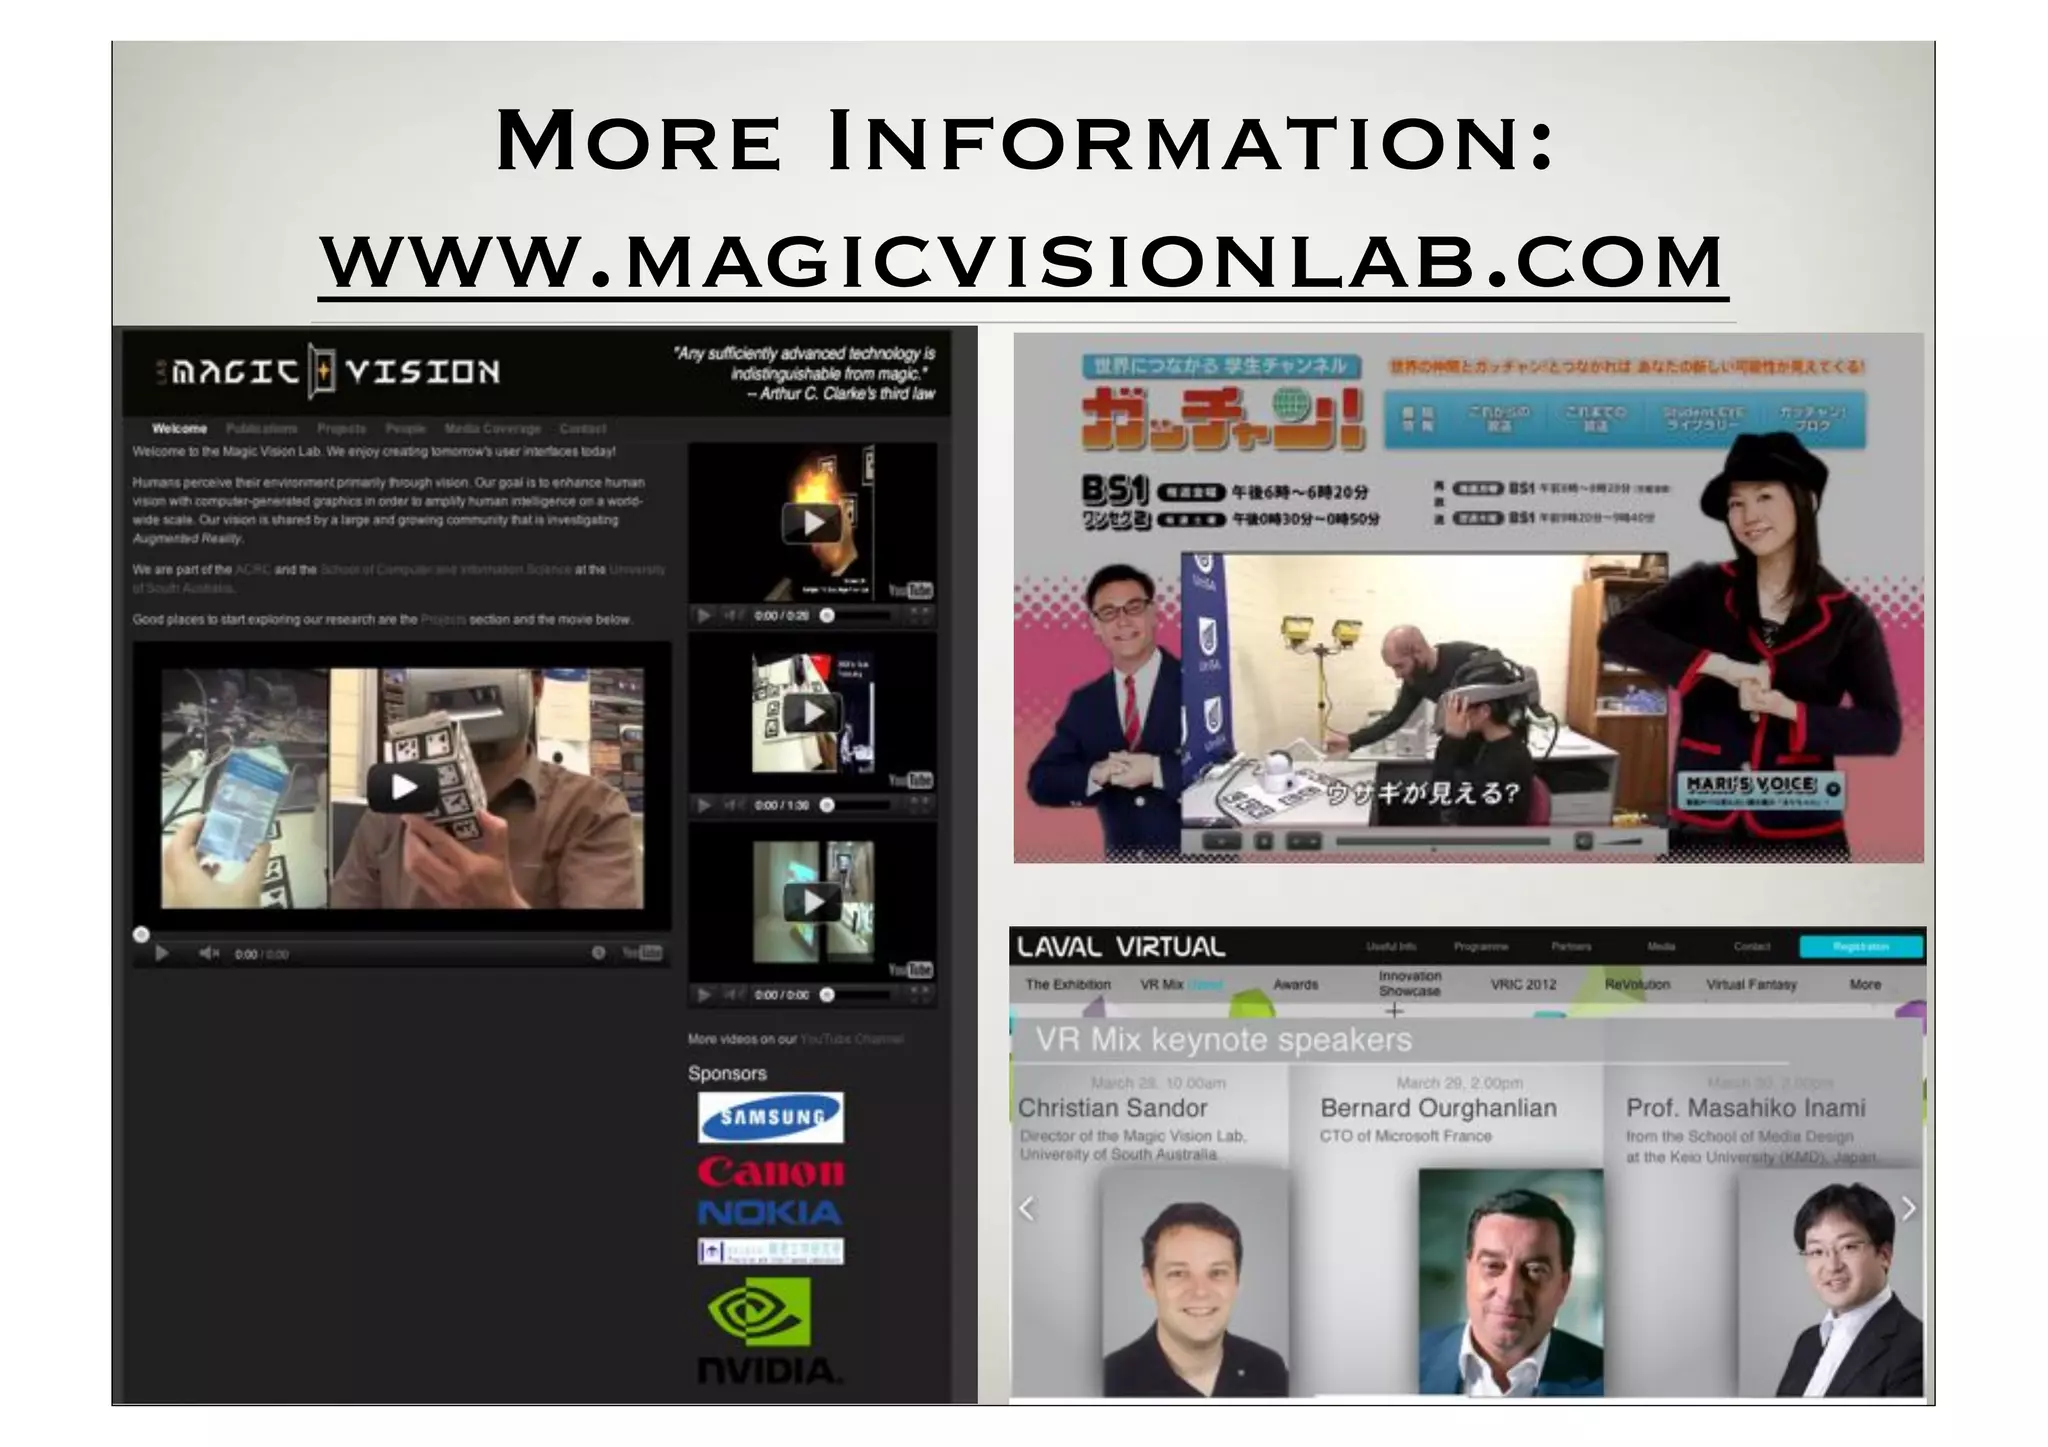
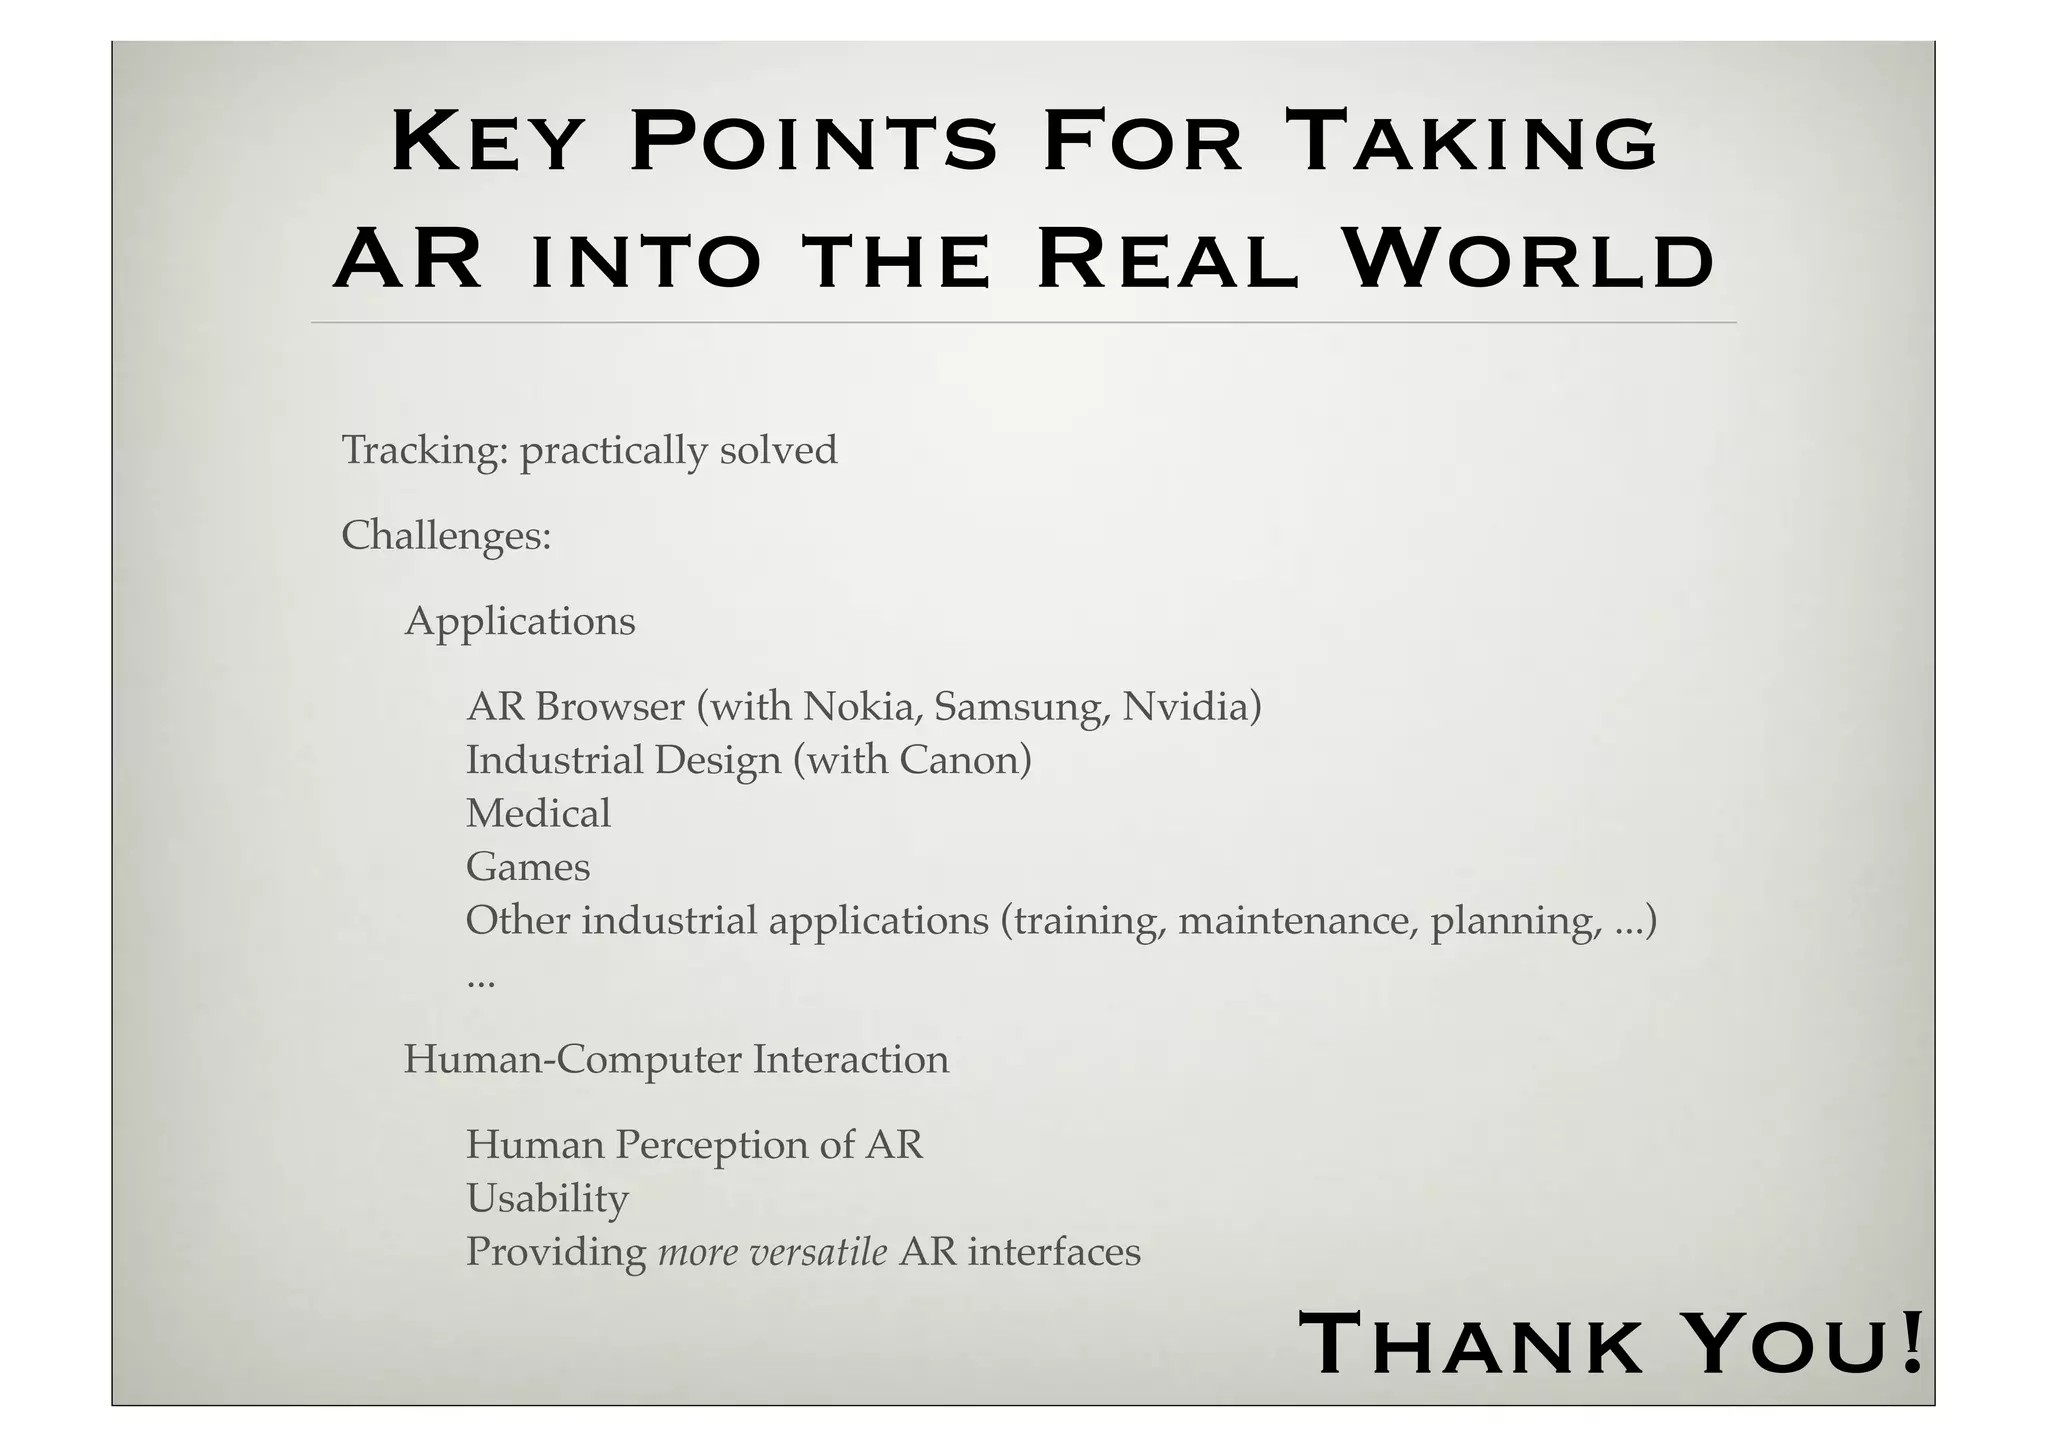

The document discusses the development and application of augmented reality (AR) technologies by Dr. Christian Sandor and colleagues, detailing the evolution of AR from laboratory settings to real-world applications. It highlights the challenges in user interaction, human-computer interfaces, and integration of visualization and haptics in AR. The research showcases advancements in real-time tracking and the potential of mobile augmented reality systems, emphasizing collaboration with industry partners to explore diverse applications in various fields.


![Coded Agents – with UiPath SDK + LangGraph [Virtual Hands-on Workshop]](https://cdn.slidesharecdn.com/ss_thumbnails/codedagentsdeck-251215155422-5497c599-thumbnail.jpg?width=640&height=640&fit=bounds)


