This document assesses the economic viability of furrow (surface) irrigation and sprinkler irrigation in Chaar-Ghare, Nepal. It finds that sprinkler irrigation requires less water than furrow irrigation but results in higher crop yields. Specifically:
- A study was conducted of different irrigation methods used to grow crops like tomatoes, onions, garlic, and corn in Chaar-Ghare.
- Furrow irrigation is currently most common but uses more water than sprinkler irrigation due to lower efficiency.
- The study calculated water requirements under different scenarios and found sprinkler irrigation requires around 1.5 times less water than furrow irrigation to grow the same crops.
- Based on the water usage and
A two-dimensional mathematical, model is developed to simulate the flow regime,
of the upper part of Dibdibba Formation. The proposed, conceptual model, which is
advocated to simulate the flow regime of aquifer is fixed for one layer, i.e. the activity
of the deeper aquifer is negligible. The model is calibrated using, trial and error
method. According to the calibration process, the hydraulic characteristics of the
upper aquifer has been identified the hydraulic conductivity in the study area ranged
(60-200) m/day while the specific, yield ranges, between, (0.08- 0.45).In this research,
the obtaining of the optimum management of groundwater flow by linked simulationoptimization
model. MODFLOW packages are used to simulate the flow in the system
of groundwater. This model is completed with an optimization model which is
depending on the Genetic Algorithm (GA) and Tabu Search (TS). Two management
cases (fixed well location and flexible well location with the moving, well option)
were considered by executing the model with adopting calibratedparameters. In the,
first case the objective function is converged to a maximum value of (3.35E+5 m3/day)
by using GA, while this function is closed to 4.00E+5 m3/day by using TS. The
objective function in second case converges to the maximum value (7.64E+05m3/day)
and (8.25E+05m3/day) when using GA and TS respectively. The choice option for the
optimal location of the wells in the second case leads to an increase of 106%
The Development of a Catchment Management Modelling System for the Googong Re...GavanThomas
A scenario assessment model to assist the end-user in determining priorities for a series of agreed management prescriptions that can be enacted through controls on existing landuse
Global custom-tailored machine learning of soil water content for locale spec...Agriculture Journal IJOEAR
Abstract—A novel approach to irrigation modeling is presented: the locale specific machine learning of soil moisture data. The merits of this new patent pending technique are clear when compared to existing methods, such as the AquaCrop program created by the Food and Agricultural Organization (FAO). From a case study on the comparative performance of AquaCrop and machine learning in the extrapolative modeling of soil moisture, AquaCrop performed with a mean squared error of 0.00165 whereas the machine learning received 0.00013, an order of magnitude lower. In addition, a novel algorithm, the ConserWater™ algorithm, has been created for the purpose of machine learning soil moisture with accuracy and efficiency. The performance of the algorithm is very superior when compared to other popular machine learning techniques, as applied to soil moisture. Finally, to allow this technology to reach agriculturalists at the grassroots level, the entire world has been machine learned and the resultant models have been encapsulated into a lightweight easy-to-use smartphone application.
Rainfall runoff is one of the important hydrological variables in determining land
and water resources application. Curve Number method is widely used and efficient
method to estimate the infiltration characteristic of the watershed in accordance with
the land use/land cover property and soil property. In this study to estimate the
rainfall runoff modeling in this study area with an area of 152.81 sq km using Soil
Conservation Service Curve Number (SCS-CN) method and GIS. The estimated
amount average annual rainfall 1322.29mm from 1999 to 2013.The runoff varied
from 285 mm–4053mm, which is corresponds to 61.6% of annual average rainfall of
Thiruvalur district. These details are used for better watershed management and
conservation purpose.
Presented by Birhanu Zemadim (IWMI) and Emily Schmidt (IFPRI) at the Nile Basin Development Challenge (NBDC) Science Workshop, Addis Ababa, Ethiopia, 9–10 July 2013
Comparative analysis of direct and four indirect methods for determination of...eSAT Journals
Abstract
This study focused on comparative analysis of five widely used methods for determining evapotranspiration, namely, Weighing lysimeter, Pan Evapotranspiration, Blaney – Morin Nigeria, Blaney – Criddle and Modified Hargreaves – Samani methods. Each of the five methods was used to estimate crop evapotranspiration of waterleaf (Talinum triangulare) in Umudike, Southeast Nigeria. The efficacy of these evapotranspiration methods is evaluated by comparing them with the Weighing lysimeter(direct method), which provides the most reasonable estimation of evapotranspiration and is one of the most reliable methods. The crop was irrigated daily and the daily data generated from the lysimeter were used to calculate the crop evapotranspiration (ETc) between the months of November/ December, 2013. Climatic data obtained for the same period were used to determine the crop evapotranspiration (ETc) using the Pan Evapotranspiration, Blaney – Morin Nigeria, Blaney – Criddle and Modified Hargreaves – Samani methods. The total crop evapotranspiration from the Lysimeter between November and December was 148.69 mm, while that of Pan Evapotranspiration (PE), Blaney – Morin Nigeria (BMN), Blaney – Criddle (BC) and Modified Hargreaves – Samani (MHS) were 152.42 mm, 151.22 mm, 147.76 mm and 135.58 mm, respectively. Test of hypothesis using z-Test indicates that there was no significant difference between the mean of the ET by lysimeter and that of each of the other four methods (Blaney - Criddle, Pan Evapotranspiration, Modified Hargreaves - Samani and Blaney - Morin Nigeria) as z-cal < z-critical at 5% level of significance for the crop growth period of 8th November to 12th December, 2013.
Keywords: Comparative analysis, Evapotranspiration methods, Crop evapotranspiration, Hydrologic cycle, Lysimeter
Optimization Analysis of Irrigation Water Using Linear Programpaperpublications3
Abstract: Irrigation water is a resource that is very strategic agriculture, the role of irrigation water has a very large dimensions. These resources not only affect productivity but also affects the spectrum utilization of agricultural commodities. Along with population growth, the demand for irrigation water to produce food (rice) will continue to increase. This is related to the fact that the setting and management of irrigation water are critical to improving agricultural productivity ..
Therefore we need a system of regulation and management of water resources so that irrigation water can be used optimally, including the provision of irrigation water that is tailored to their needs. Provision of irrigation water is the optimal amount of irrigation water supplied from the source through carrier channels (primary and secondary), tertiary canals, until the rice fields as needed.
In this study, the optimization is done by using a Linear Program. Value obtained from this optimization needs irrigation water as needed.
In addition to the optimization is done, to achieve high efficiency and the need for channel maintenance of existing irrigation facilities so not much irrigation water is wasted.
Development and evaluation of a weighable lysimeter to determine crop evapotr...eSAT Journals
Abstract
The development and evaluation of a weighable lysimeter to determine crop evapotranspiration is presented. A weighable lysimeter with a diameter of 31 cm and a depth of 37 cm was constructed. The lysimeter was evaluated by using it to estimate the crop evapotranspiration of waterleaf in Umudike in Southeastern Nigeria. The evapotranspiration (ETc) estimates by Pan Evapotranspiration, Blaney – Morin Nigeria, Blaney – Criddle and Modified Hargreaves – Samani methods were compared with the estimation of the weighable lysimeter which provides the most reasonable estimation of ETc and is one of the most reliable methods. The crop was irrigated daily and the daily data generated from the lysimeter were used to calculate the crop evapotranspiration (ETc Lysimeter) between the months of July/ August, 2013. Climatic data obtained for the same period were used to determine the crop evapotranspiration (ETc) using the Pan Evapotranspiration, Blaney – Morin Nigeria, Blaney – Criddle and Modified Hargreaves – Samani methods. The total crop evapotranspiration from the Lysimeter between July and August was 141.32 mm, while that of Pan Evapotranspiration (PE), Blaney – Morin Nigeria (BMN), Blaney – Criddle (BC) and Modified Hargreaves – Samani (MHS) were 147.72 mm, 136.81 mm, 131.61 mm and 132.52 mm, respectively. Test of hypothesis using z-Test indicates that there was no significant difference between the means of the ET by lysimeter and each of the other methods (Blaney - Criddle, Pan Evapotranspiration, Modified Hargreaves - Samani and Blaney - Morin Nigeria) for a 5% level of significance as z-cal < z-critical for the growth period of 15th July to 18th August, 2013.
Keywords: Weighable Lysimeter, Evapotranspiration, Waterleaf.
Runoff is one of the most significant hydrological variables used in most of the water resources applications. Physiographically the area is characterized by undulating topography with plains and valleys. The Soil Conservation Service Curve Numbers also known as hydrologic soil group method were used in this study. This method is adaptable and suitable approach for quick runoff estimation and is approximately easy to use with minimum data and it gives good result. From the study yearly rainfall and runoff were estimated easily. The study area covers an area of 466.02 km2, having maximum length of 36.5 km. The maximum and minimum elevation of the basin is 569 m and 341 m above MSL, respectively.
IJRET : International Journal of Research in Engineering and Technology is an international peer reviewed, online journal published by eSAT Publishing House for the enhancement of research in various disciplines of Engineering and Technology. The aim and scope of the journal is to provide an academic medium and an important reference for the advancement and dissemination of research results that support high-level learning, teaching and research in the fields of Engineering and Technology. We bring together Scientists, Academician, Field Engineers, Scholars and Students of related fields of Engineering and Technology
Streamflow simulation using radar-based precipitation applied to the Illinois...Alireza Safari
This paper describes the application of a spatially distributed hydrological model WetSpa (Water and Energy Transfer between Soil, Plants and Atmosphere) using radar-based rainfall data provide by the United States Hydrology Laboratory of NOAA's National Weather Service for a distributed model intercomparison project. The model is applied to the
river basin above Tahlequah hydrometry station with 30-m spatial resolution and one hour time--step for a total simulation period of 6 years. Rainfall inputs are derived from radar. The distributed model parameters are based on an extensive database of watershed characteristics available for the region, including digital maps of DEM, soil type, and land use. The model is calibrated and validated on part of the river flow records. The simulated hydrograph shows a good correspondence with observation (Nash efficiency coeffiecient >80%, indicating that the model is able to simulate the relevant hydrologic processes in the basin accurately.
This study explains the use of remote sensing data for spatially distributed hydrological modeling using the MIKE-SHE software used in Tarim River Basin CHINA
Comparative Study of End Moments Regarding Application of Rotation Contributi...IOSR Journals
Abstract: Analysis of portal frames involves lot of complications and tedious calculations by conventional
methods. To carry out such analysis is a time consuming task. The rotation contribution method i.e. Kani’s
Method & Moment Distribution Method for analysis of portal frames can be handy in approximate and quick
analysis so as to get the detailed estimates ready. In this work, these two methods have been applied only for
vertical loading conditions. This paper presents the analysis of portal frame, considering mainly the case of
single bay portal frame, which is the most common in practice. The Kani’s method is self correcting, that is, the
error, if any, in a cycle is corrected automatically in the subsequent cycles. The checking is easier as only the
last cycle is required to be checked. The convergence is generally fast. It leads to the solutions in just a few
cycles of iterations.
Leather Quality Estimation Using an Automated Machine Vision SystemIOSR Journals
In the presented work, it is proposed to design the feature vector of the parameters of leather
material in order to completely define the quality of the leather material. The proposed parameters are holes,
cracks, spots, cuts, and roughness etc.. The defects are localized according to their position on leather surface,
their size and shape. The histogram analysis method is proposed to be developed for use with very low-level
image features, such as color and luminance and is used as an image descriptor for color-matching
requirements. In the present scenario, it is observed that the leather quality is highly sensitive to surface finish
of the leather material. Manually it is not possible always to inspect each area of the leather surface under test
because of heavy lot of material and it is time consuming too. The main problem during the inspection is that
how to achieve the repeatable quality at regular interval. Therefore, in order to get the authentic leather
quality, it is required to have a set of features that could be given some numerical value so that the quality can
be justified in quantified manner. A machine vision system offers a fair solution in order to solve this problem.
In the proposed work, we propose to deduce some mathematical parameters besides size and location that are arranged in a vector so as to determine the leather quality
Analysis characteristics of power PV cells and wind turbine from power genera...IOSR Journals
This paper presents the implementation of a generalized photovoltaic model using Matlab Simulink
software package, which can be representative of PV cell, module, and array for easy use on simulation
platform. The proposed model is designed with a user-friendly icon and a dialog box like Simulink block
libraries. This makes the generalized PV model easily simulated and analyzed in conjunction with power
electronics for a maximum power point tracker. Taking the effect of sunlight irradiance and cell temperature
into consideration, the output current and power characteristics of PV model are simulated and optimized using
the proposed model. This enables the dynamics of PV power system to be easily simulated, analyzed, and
optimized.
For Wind Turbine modeling and simulation of wind driven electricity generation system or WECS (an
acronym for Wind Energy Conversion System) has been done. Our aim is to design and test a power 300W
capacity, operating at 3 m/s to 6 m/s , induction permanent magnet generator Matlab simulation. The different
components of a wind energy system namely the wind turbine, generator, rectifier, as per the scope of this
project following which the design steps and modeling of the system in Matlab simulation environment -
Simulink was undertaken
Novel Way to Isolate Adipose Derive Mesenchymal Stem Cells & Its Future Clini...IOSR Journals
Abstract: Adipose-derived stem cells (ADSCs), were isolated from discarded human fat tissue, obtained from csection with our recently modified methods, in Stem Cell & Regenerative Medicine Lab, VSBT. Here we develop
two methods to isolate Adipose derived mesenchymal stem cells with enzyme digestion and use of
phosphatidylcholine and deoxycholate. Surface protein expression was analyzed by flow cytometry to
characterize the cell phenotype. The multi-lineage potential of ADSCs was testified by differentiating cells with
adipogenic inducer. ADSCs can be cultured in vitro for up to one month without passage. Also, the flow
cytometry analysis showed that ADSCs expressed high levels of stem cell related surface marker CD105.
ADSCs have strong proliferation ability, maintain their phenotypes, and have stronger multi-differentiation
potential. The molecular basis of ADSC differentiation was studied using bioinformatics tools with an aim to
identify the key proteins involved in differentiation, such that they could be used as potential targets for drug
development for the treatment of obesity. The key proteins involved were found to be PPARG and C/EBPα. The
structures of the proteins were retrieved from MMDB (Molecular Modelling Database) and PDB (Protein Data
Bank) respectively. Key Words: Adipose-derived stem cells, Mesenchymal stem cells, Enzyme digestion, Phosphatidylcholine, Deoxycholate, PPARG, C/EBPα, etc.
A novel approach to design and fabrication of thermo-acoustic refrigerator us...IOSR Journals
The basic object of this paper is compression of refrigerant by the consumption of high amplitude
sound waves that results the generation thermal Energy. For generation of sound waves a loud speaker (or
common audio speaker) has been employed for creating high amplitude sound waves which compresses
refrigerant (helium) by the well Known thermodynamics process of heat absorption. A Thermo acoustic
refrigerator is fabricated with a cooler and loud speaker. The acoustic power produced by a loud speaker as a
sound waves reaches to heat the pump. The cooler works on a reverse Carnot cycle by incorporating a compact
acoustic network to create the travelling wave phasing necessary to operate. As the acoustic wave propagates
temperature difference occurs at the ends of stack, heat and cold is trap by the heat exchangers regenerator
from a cold heat exchanger to an ambient one. Instead of using co-axial topology network, the toroidal is used.
The design, construction and performance measurement of the cooler are also discussed. Finally, at 80 C a
coefficient of performance 7.0 is achieved.
The Performance Analysis of Private Conventional Banks: A Case Study of Bangl...IOSR Journals
This study attempts primarily to measure the financial performance of some selected private
commercial banks in Bangladesh for the period 2006-2011 and to identify whether any relationship exists
between a bank’s years of operation and its performance. For this purpose five banks have been selected from
different generations. The financial performances of these banks have been scrutinized from the following four
dimensions: (1) profitability (2) liquidity (3) credit risk and (4) efficiency. The study concluded that there is no
specific relationship between the generation of banks and its performance. The performances of banks are
dependent more on the management’s ability in formulating strategic plans and the efficient implementation of
its strategies. The study findings can be helpful for management of private commercial banks in Bangladesh to
improve their financial performance and formulate policies that will improve their performance. The study also
identified specific areas for each bank to work on which can ensure sustainable growth for these banks
The need for TVE is increasing as a result of so many factors: technological advancement,
globalization process, knowledge economy, changes in modes of production in the work place, growing
economic openness and competitiveness. TVE is very vital to the sustenance of technological development of
every nation in the present 21st century. For Nigeria to become developed greater emphasis must be placed on
technology education in order to improve on its quality for sustainable national development. This paper
discussed extensively on quality assuranceon TVE for sustainable national development in the 21st century. The
paper highlights on the concept of TVE and discusses on the status of TVE in Nigeria. Issues on sustainable
development and rationale for enhancing the quality of TVE in Nigeria in the 21st century were explained.
Conclusions were drawn and recommendations made amongst which are that: Government should introduce
sustainable financing scheme for TVE and increase the percentage of total expenditure on education to TVE and
also grant financial aids to trainees who are interested in pursuing TVE programs at whatever level and also
the involvement of major Nigerian stakeholders in the provision of workshop tools, equipment and other
infrastructural facilities for TVE graduates skills acquisition for sustainable national development.
Design and Analysis of Microstrip Antenna for CDMA Systems CommunicationIOSR Journals
This paper proposes a newly designed microstrip patch antennas (MSA) for wireless application
(CDMA Systems). The designed single antenna E-shaped patch antenna. Two parallel slots are in corporated
into the patch of a microstrip antenna to expand it bandwidth, and designed antenna operates in the frequency
range of 1.85 to 1.99 GHz. The antenna is designed using air as a dielectric substrate between the ground plane
and substrate patch antenna. IE3D is a full-wave electromagnetic simulator based on the method of moments
(MoM) technique. It has been widely used in the design of MICs, RFICs, patch antennas, wire antennas, and
other RF/wireless antennas. It can be used to calculate and plot the S parameters, VSWR, current distributions
as well as the radiation patterns. The results obtained for each patch were 2D and 3D view of patch, Directivity,
Gain, beam width and other such parameters, true and mapped 3D radiation pattern, and 2D polar radiation
pattern. The antenna successfully achieves the exhibit a broad impedance bandwidth of 27 % (at VSWR < 2)
with respect to the center frequency of 1.9 GHz is designed, fabricated, and finally measured on Spectrum
analyzer. The radiation pattern and directivity are also presented.. Gain maximum achievable is 3 dBi and good
return loss (S11 parameters) of -30 dB is achieved along with broadside radiation pattern.
Synthesis of 3-methoxy-6-phenyl-6, 6a-dihydro-[1] benzopyrano-[3, 4-b] [1] be...IOSR Journals
Abstract: The 3-methoxy-6-phenyl-6,6a-dihydro-[1]benzopyrano-[3,4-b][1]benzopyran has been synthesised according to eight-steps synthesis. The target compound was obtained using a synthetic route based on two key cyclisations steps including the platinum chlorides-catalysed of alkynones and intramolecular oxo-Michael addition.
Implementation of XOR Based Pad Generation Mutual Authentication Protocol for...IOSR Journals
In RF link, without security the messages exchange between the two devices are monitoring by an
eavesdropper. So the exclusive-OR (XOR) based pad generation protocol is used to safely transfer the data to
the other point with necessary security and it maintaining confidentiality. This protocol produce the cover
coding pad to mask the access password before the datas are transmitted. A specially designed pad generation
will be implemented in digital domain to solve the insecurity problem in data communication RF link. This
protocol developed under regulation of ISO 18000 – 6 type C protocol also known as EPC C1G2 RFID
protocol. The linear feed back shift register (LFSR) generate the pseudo random binary sequence (PRBS) and it
is used as data source to the pad generation function. The Xilinx 13.x software is used for synthesize and
modelsim SE6.0 is used for simulating the result. The pad generation algorithm has been implemented in FPGA
Spartan 3 PQ208-4 board to verify the result
Comparative Study and Analysis of Image Inpainting TechniquesIOSR Journals
Abstract: Image inpainting is a technique to fill missing region or reconstruct damage area from an image.It
removes an undesirable object from an image in visually plausible way.For filling the part of image, it use
information from the neighboring area. In this dissertation work, we present a Examplar based method for
filling in the missing information in an image, which takes structure synthesis and texture sysnthesis together.
In exemplar based approach it used local information from an image to patch propagation.We have also
implement Nonlocal Mean approach for exemplar based image inpainting.In Nonlocal mean approach it find
multiple samples of best exemplar patches for patch propagation and weight their contribution according to
their similarity to the neighborhood under evaluation. We have further extended this algorithm by considering
collaborative filtering method to synthesize and propagate with multiple samples of best exemplar patches. We
have to preformed experiment on many images and found that our algorithm successfully inpaint the target
region.We have tested the accuracy of our algorithm by finding parameter like PSNR and compared PSNR
value for all three different approaches.
Keywords: Texture Synthesis, Structure Synthesis, Patch Propagation ,imageinpainting ,nonlocal approach,
collabrative filtering.
“Relationship of Kinematic Variables with the Performance of Standing Broad J...IOSR Journals
Abstract: The purpose of investigation was to study the relationship of kinematics variables with the
performance of standing broad jump. Subjects were randomly selected from J.N.V. University, Jodhpur and
M.D.S. University, Ajmer. The criterion measure used for this study was the performance in standing broad
jump and selected kinematics variables. To analyze the raw data coefficient of correlation (r) were calculated
and results were compared with the help of Analysis of variance (ANOVA) technique where level of significance
was set at .05.
Evaluation of Irrigation Application Efficiency: Case Study of Chanchaga Irri...AZOJETE UNIMAID
Water is an integral issue needed to attain the desired targets but good quality water for irrigation purpose is gradually become scarce. The seasonal nature of rainfall can give rise to water stress at critical periods of growth. This research attempts to evaluate the irrigation application efficiency of Chanchaga irrigation scheme, Minna, Niger state. A hand auger was used to bore to a desired depth to remove samples of the moist soil. Samples of the moist soil removed was placed in a can, covered and taken to the laboratory. The specific gravity (apparent) of the soil particle and the depth of water applied were determined using volumetric method, water application efficiency is determined using Gravimetric Method of Soil Moisture Content (Pw) Determination. The moisture content of the field after irrigation water is applied falls between the ranges of 51.1% and 51.5%, with an average of 51.28%, in this case the average amount of water applied is about 4.68%, this shows a little increase in the moisture content of the soil in the field. It was concluded that the efficiency of water application obtained is adequate and a good result considering the available management practice in terms of system operation, monitoring and evaluation.
performance evaluation and characterization of wetted soil parameters of impr...IJEAB
Field study was conducted to evaluate the emission uniformity (EU), global coefficient of variation (CGv), emitter flow variation (Qvar) and distribution uniformity (DU), and determine the wetted radius (rw) on soil surface of improvised medi-emitters installed in a tomato field. Soil water content (SWC) at four layers was determined after different periods of irrigation. Radius of wetted soil surface was determined and predicted. Irrigation frequency had no significant effect on the average discharge rate of the medi-emitters throughout the growing cycle. Average Qvar and CGv were significantly (P=0.05) influenced by the frequency of application while the EU and DU did not significantly (P=0.05) differ among the treatments. There were significant differences in the average values of SWC in different soil layers under the different periods of irrigation. Both the observed and calculated rw on the soil surface were fitted with fourth order polynomial. The model performance parameters of MAE and RMSE between the calculated and observed radii were low, indicating good prediction. Medical infusion set can successfully replace the more expensive conventional emitters for drip irrigation system.
Data Preparation for Assessing Impact of Climate Change on Groundwater RechargeAM Publications
Climate change is a change in the statistical properties of the climate system when considered over long
periods of time. It significantly affects the various components of hydrological cycle like temperature, precipitation,
evapotranspiration and infiltration. All these components together affect the rate of groundwater recharge. So
understanding the effects of climate change on groundwater recharge is the need of time for the management of
groundwater resources. This paper presents the data preparation initiatives and a suitable methodology that can be
used to characterize the effect of climate change on groundwater recharge. The method is based on the hydrologic
model Visual HELP which can be used to estimate potential groundwater recharge at the regional scale. The success
of Modeling depends on the accuracy of data and the mode of collecting the data. Therefore, identifying the data
needs of a particular modeling study, collection/monitoring of required data and preparation of data set form an
integral part of any groundwater modeling exercise. The main objective of this paper is to describe the exact data
required and its preparation to simulate the groundwater recharge using HELP Model Software for Yavatmal as a
study area situated in Maharashtra state, India. The impact of climate change as a pilot study is modeled by using
computer software HELP (Hydrologic Evaluation of Landfill Performance). The initiatives for data preparation
presented herein may be useful to the researchers in this field.
Watershed management practices and hydrological modelling under changing clim...africa-rising
Poster prepared by B.Z. Birhanu, F.Kizito, K.Traore, O. Cofie and R. Tabo for the Africa RISING Science for Impact Workshop, Dar es Salaam, 17-19 January 2017
THE APPLICATION OF MATHEMATICAL MODELS IN MANAGEMENT OF AQUIFERAnonymouslVQ83F8mC
Before feeling water -shortage crisis human has understood the importance of water From the
religious texts. Considering recent conditions of the world the water will replace most recent
boundaries, at future. Imamzadeh Jaafar plain is located 5 kilometers northeast of Gachsaran, south
of Kohgilooye and Boerahmad province. The plain has 61km 2 area extents and contains two,
alluvial and carbonate aquifers. These aquifers supply the water needs, agricultural, industrial and
domestic. Highly exploitation and transportation of groundwater resources, especially by National Oil
Company, caused highly drawdown in alluvial aquifer, 1.85m in a 5 years period from 1361 to
1365 as reported by Mahab Ghods Consulting Engineers. There are two artificial recharge
projects, 1 flood spreading system and 1 recharge ponds system, in the plain. To present the future
water resources management program the hydrogeological behaviors of the alluvial aquifer and the
effects of artificial recharge must be evaluated. edrock, hydrodynamic coefficients, topography, water
resources and were collected, field surveys were performed and required maps were prepared. Using
conceptual model and MODFLOW PMWIN code the mathematical model of the plain was
calibrated against water year 1380 -81 and then verified against water year 1384 - 85. The verified
model was used to predict future conditions of aquifer. The results implied the rapid response of
aquifer to precipitation due to high aquifer ransmissivity, positive water budget at year 1385
comparing year 65, change of direction of groundwater flow from plain outlet to the center of
plain in response to highly exploitation at the center of plain, water level in the wells located
downward the flood spreading system will raise as 1 to 6m and water level in t he wells located
downward the recharge pond system will lower as 1 to 4m.
THE APPLICATION OF MATHEMATICAL MODELS IN MANAGEMENT OF AQUIFERamsjournal
Before feeling water -shortage crisis human has understood the importance of water From the
religious texts. Considering recent conditions of the world the water will replace most recent
boundaries, at future. Imamzadeh Jaafar plain is located 5 kilometers northeast of Gachsaran, south
of Kohgilooye and Boerahmad province. The plain has 61km 2 area extents and contains two,
alluvial and carbonate aquifers. These aquifers supply the water needs, agricultural, industrial and
domestic. Highly exploitation and transportation of groundwater resources, especially by National Oil
Company, caused highly drawdown in alluvial aquifer, 1.85m in a 5 years period from 1361 to
1365 as reported by Mahab Ghods Consulting Engineers. There are two artificial recharge
projects, 1 flood spreading system and 1 recharge ponds system, in the plain. To present the future
water resources management program the hydrogeological behaviors of the alluvial aquifer and the
effects of artificial recharge must be evaluated. edrock, hydrodynamic coefficients, topography, water
resources and were collected, field surveys were performed and required maps were prepared. Using
conceptual model and MODFLOW PMWIN code the mathematical model of the plain was
calibrated against water year 1380 -81 and then verified against water year 1384 - 85. The verified
model was used to predict future conditions of aquifer. The results implied the rapid response of
aquifer to precipitation due to high aquifer ransmissivity, positive water budget at year 1385
comparing year 65, change of direction of groundwater flow from plain outlet to the center of
plain in response to highly exploitation at the center of plain, water level in the wells located
downward the flood spreading system will raise as 1 to 6m and water level in t he wells located
downward the recharge pond system will lower as 1 to 4m.
Neuro-symbolic is not enough, we need neuro-*semantic*Frank van Harmelen
Neuro-symbolic (NeSy) AI is on the rise. However, simply machine learning on just any symbolic structure is not sufficient to really harvest the gains of NeSy. These will only be gained when the symbolic structures have an actual semantics. I give an operational definition of semantics as “predictable inference”.
All of this illustrated with link prediction over knowledge graphs, but the argument is general.
JMeter webinar - integration with InfluxDB and GrafanaRTTS
Watch this recorded webinar about real-time monitoring of application performance. See how to integrate Apache JMeter, the open-source leader in performance testing, with InfluxDB, the open-source time-series database, and Grafana, the open-source analytics and visualization application.
In this webinar, we will review the benefits of leveraging InfluxDB and Grafana when executing load tests and demonstrate how these tools are used to visualize performance metrics.
Length: 30 minutes
Session Overview
-------------------------------------------
During this webinar, we will cover the following topics while demonstrating the integrations of JMeter, InfluxDB and Grafana:
- What out-of-the-box solutions are available for real-time monitoring JMeter tests?
- What are the benefits of integrating InfluxDB and Grafana into the load testing stack?
- Which features are provided by Grafana?
- Demonstration of InfluxDB and Grafana using a practice web application
To view the webinar recording, go to:
https://www.rttsweb.com/jmeter-integration-webinar
Kubernetes & AI - Beauty and the Beast !?! @KCD Istanbul 2024Tobias Schneck
As AI technology is pushing into IT I was wondering myself, as an “infrastructure container kubernetes guy”, how get this fancy AI technology get managed from an infrastructure operational view? Is it possible to apply our lovely cloud native principals as well? What benefit’s both technologies could bring to each other?
Let me take this questions and provide you a short journey through existing deployment models and use cases for AI software. On practical examples, we discuss what cloud/on-premise strategy we may need for applying it to our own infrastructure to get it to work from an enterprise perspective. I want to give an overview about infrastructure requirements and technologies, what could be beneficial or limiting your AI use cases in an enterprise environment. An interactive Demo will give you some insides, what approaches I got already working for real.
The Art of the Pitch: WordPress Relationships and SalesLaura Byrne
Clients don’t know what they don’t know. What web solutions are right for them? How does WordPress come into the picture? How do you make sure you understand scope and timeline? What do you do if sometime changes?
All these questions and more will be explored as we talk about matching clients’ needs with what your agency offers without pulling teeth or pulling your hair out. Practical tips, and strategies for successful relationship building that leads to closing the deal.
Dev Dives: Train smarter, not harder – active learning and UiPath LLMs for do...UiPathCommunity
💥 Speed, accuracy, and scaling – discover the superpowers of GenAI in action with UiPath Document Understanding and Communications Mining™:
See how to accelerate model training and optimize model performance with active learning
Learn about the latest enhancements to out-of-the-box document processing – with little to no training required
Get an exclusive demo of the new family of UiPath LLMs – GenAI models specialized for processing different types of documents and messages
This is a hands-on session specifically designed for automation developers and AI enthusiasts seeking to enhance their knowledge in leveraging the latest intelligent document processing capabilities offered by UiPath.
Speakers:
👨🏫 Andras Palfi, Senior Product Manager, UiPath
👩🏫 Lenka Dulovicova, Product Program Manager, UiPath
Connector Corner: Automate dynamic content and events by pushing a buttonDianaGray10
Here is something new! In our next Connector Corner webinar, we will demonstrate how you can use a single workflow to:
Create a campaign using Mailchimp with merge tags/fields
Send an interactive Slack channel message (using buttons)
Have the message received by managers and peers along with a test email for review
But there’s more:
In a second workflow supporting the same use case, you’ll see:
Your campaign sent to target colleagues for approval
If the “Approve” button is clicked, a Jira/Zendesk ticket is created for the marketing design team
But—if the “Reject” button is pushed, colleagues will be alerted via Slack message
Join us to learn more about this new, human-in-the-loop capability, brought to you by Integration Service connectors.
And...
Speakers:
Akshay Agnihotri, Product Manager
Charlie Greenberg, Host
Builder.ai Founder Sachin Dev Duggal's Strategic Approach to Create an Innova...Ramesh Iyer
In today's fast-changing business world, Companies that adapt and embrace new ideas often need help to keep up with the competition. However, fostering a culture of innovation takes much work. It takes vision, leadership and willingness to take risks in the right proportion. Sachin Dev Duggal, co-founder of Builder.ai, has perfected the art of this balance, creating a company culture where creativity and growth are nurtured at each stage.
UiPath Test Automation using UiPath Test Suite series, part 3DianaGray10
Welcome to UiPath Test Automation using UiPath Test Suite series part 3. In this session, we will cover desktop automation along with UI automation.
Topics covered:
UI automation Introduction,
UI automation Sample
Desktop automation flow
Pradeep Chinnala, Senior Consultant Automation Developer @WonderBotz and UiPath MVP
Deepak Rai, Automation Practice Lead, Boundaryless Group and UiPath MVP
UiPath Test Automation using UiPath Test Suite series, part 4DianaGray10
Welcome to UiPath Test Automation using UiPath Test Suite series part 4. In this session, we will cover Test Manager overview along with SAP heatmap.
The UiPath Test Manager overview with SAP heatmap webinar offers a concise yet comprehensive exploration of the role of a Test Manager within SAP environments, coupled with the utilization of heatmaps for effective testing strategies.
Participants will gain insights into the responsibilities, challenges, and best practices associated with test management in SAP projects. Additionally, the webinar delves into the significance of heatmaps as a visual aid for identifying testing priorities, areas of risk, and resource allocation within SAP landscapes. Through this session, attendees can expect to enhance their understanding of test management principles while learning practical approaches to optimize testing processes in SAP environments using heatmap visualization techniques
What will you get from this session?
1. Insights into SAP testing best practices
2. Heatmap utilization for testing
3. Optimization of testing processes
4. Demo
Topics covered:
Execution from the test manager
Orchestrator execution result
Defect reporting
SAP heatmap example with demo
Speaker:
Deepak Rai, Automation Practice Lead, Boundaryless Group and UiPath MVP
Generating a custom Ruby SDK for your web service or Rails API using Smithyg2nightmarescribd
Have you ever wanted a Ruby client API to communicate with your web service? Smithy is a protocol-agnostic language for defining services and SDKs. Smithy Ruby is an implementation of Smithy that generates a Ruby SDK using a Smithy model. In this talk, we will explore Smithy and Smithy Ruby to learn how to generate custom feature-rich SDKs that can communicate with any web service, such as a Rails JSON API.
1. IOSR Journal of Mechanical and Civil Engineering (IOSR-JMCE)
e-ISSN: 2278-1684,p-ISSN: 2320-334X, Volume 12, Issue 4 Ver. I (Jul. - Aug. 2015), PP 59-65
www.iosrjournals.org
DOI: 10.9790/1684-12415965 www.iosrjournals.org 59 | Page
Assessment of Economic Viability of Different Irrigation
Methods: A Case Study of Chaar-Ghare, Lalitpur, Nepal
Subik Shrestha and Khet Raj Dahal
Kantipur Engineering College, Dhapakhel, Lalitpur, Nepal
Abstract: In the Chaar-Ghare village of Chapagaun, Lalitpur, Nepal, furrow irrigation is a primary source of
water for growing crops. A study was conducted in order to know the economic viability of surface (furrow) and
sprinkler irrigation during the period of 2013-2014 in Chaar-Ghare, ChapagaunVillage Development
Committee (VDC), Lalitpur. A topographic survey of Chaar-Ghare area was conducted. The crops Solanumly
copersicum (tomato), Alliumcepa (onion), Allium sativum (garlic), Zeamays (corn) were chosen for economic
analysis. The case of water requirement was analyzed in three scenario of optimistic, pessimistic and normal in
the significant level of 5% with the hydrological parameters, which were normally distributed. It was found that
the lowest water requirement was for Zeamays (17400 cu. m) and Alliumcepa (32375cu. m) and the next was
Allium sativum (33135 cu.m).The highest water requirement was for Solanumly copersicum with water
requirement of 210345cu. m. The study concluded that sprinkler irrigation was almost one and half fold
economical than the furrowirrigation.
Key words: Chaar-Ghare, Furrow Irrigation, Sprinkler Irrigation,Water Requirement, and Economic Return
I. Introduction
Irrigation is the art of applying water artificially to the field in accordance to the crop requirement
throughout the cropping period for the full fledge nourishment of the plant for better yield ability (NARC,
2011). The need of food is inevitable till the cycle of life exist on the planet. Time and modernization are
paramount parameter related with each other and have brought today’s burning issues of climate change which
demands a better irrigation system where we can optimize the use of water and Irrigation Engineers, while
designing an irrigation system that tries to maximize Irrigation Efficiency (IE) and economic return. The
rational use of water is another thing for optimization we either follow consumptive use or conjunctive use of
water. From our traditional cultivation method of surface irrigation to today’s modern method of irrigation, we
are assessing the economic viability of different irrigation methods (Ortiz Romero et al., 2006).
Government policy makers are usually interested in achieving higher yield for a unit of water applied
and consequently interested in more economic return. It is obvious that water used in surface irrigation is more
than that used in sprinkler irrigation but the question is how much of water in excess. We surveyed on different
literatures and found, the average efficiency of surface irrigation in the inner mountain west is probably less
than 50 percent as compared to the higher sprinkler efficiency of 70 percent (Robert, 2001), using raingun
sprinkler irrigation system, 30.8% and28.3% higher water use efficiency and 21.1% and 9.0% more water
application efficiency was achieved as compared to basin and furrow irrigation system, respectively (Rana et
al.,2006).A good irrigation system should give a better return, and the general prosperity of farmer is based on
the yield of crops. About 5.64% and 1.71% more yield was obtained in raingun sprinkler irrigation system as
compared to basin and furrow irrigation systems, respectively (Rana et al., 2006). Irrigation Water Used
Efficiency (IWUE) (t/ha/mm), is defined as the ratio of crop yield to seasonal irrigation water in mm including
rain (Howell, 1994). Both IE and IWUE can be increased by practicing deficit irrigation in part of field
receiving the minimum water application depth (Al-Jamal et al., 2001). The most economical deficit irrigation
level depends on the uniformity of application of the irrigation water and the associated cost of the irrigation
water, any cost of remediation treatment on the drainage water, and the value of a unit of the crop (Wu, 1998).
Previous research shows a higher IWUE for sprinkler systems (from 0.0044 to 0.0659 t ha-1
mm-1
) compared
with furrow irrigation ( from 0.0086 to 0.056 t ha-1
mm-1
) (Sammis, 1980; Bogle et al., 1989).When growing
Allium Cepas has also shown higher IWUE values sprinkler irrigation (0.049 t ha-1
mm-1
) compared furrow
irrigation (0.044 t ha-1
mm-1
) is seen (Ellis et al., 1986).
Farmers are usually interested in the economic return per unit of the water applied. Consequently,
deficit irrigation is not economical at current water cost in US (McGuckin et al., 1987), but changing from
furrow to sprinkler irrigation which can increase both IE and IWUE is economical for high value crop.
The major interest of this research paper lies in exploring the net profit per cubic meter of water for
surface and sprinkler irrigation.
2. Assessment of Economic Viability of Different Irrigation Methods: A Case Study Of chaar….
DOI: 10.9790/1684-12415965 www.iosrjournals.org 60 | Page
II. Material And Methods
Study Area
Chaar-Ghare area is a small remote area of Chaar-Ghare, which lies in Chapagaun VDC,Lalitpur
district of Nepal with bounding coordinates of maximum 27°35'28.6210", 085°19'08.9770" and minimum
27°35'14.5194", 085°18'50.5572" (Fig. 1). The rain and canal fed irrigation system, serves 264.4 Ha areas in
total extending up to Thecho of Lalipur district. The study was limited to gross command area of 9.27 ha having
cultivable command area of 9 ha (www.googleearth.com).
Fig. 1: Study area
Data collection technique at preliminary design stage was through focused group discussion (FGD) in
Chaar-Ghare (Fig. 1). It provided basic information for further design. FGD also helped to know the problems
regarding water and its quality with their annual yield and market economics. The discharge of canal and field
properties like field capacity and wilting point were measured. The discharge measurement technique was leaf
floatation in a straight and uniform section of length 7.5m and cross-sectional dimension of 1.38m width and
0.3m depth while for field capacity and wilting point, soil sample were collected after 24 hours of rain had
stopped and also after 10 days. Samples were weighted separately and fed to oven for 24 hours and weighted
again to get dry weight. Weight of water in soil sample divided by weight of dry soil gives the water content
which are field capacity and wilting point respectively. Other necessary data for calculating crop water
requirement was collected from Department of Hydrology and Meteorology(DHM),Nepal,which was of 20 year
long time series. The data was first analyzed if they follow normal distribution. The central limit theorem was
also applied and concluded they do follow normal distribution of probability. The formula used for this study
was:
Normal distribution (z) =
Variable −mean
Standard Ddeviation
Figure 2: Normal distribution graph at 95% confidence level
3. Assessment of Economic Viability of Different Irrigation Methods: A Case Study Of chaar….
DOI: 10.9790/1684-12415965 www.iosrjournals.org 61 | Page
For 5% level of significance z = ± 1.96 which is multiplied by standard deviation and added to mean to find the
variable value.
FAO Eto calculator was used for calculatingPotentialEvapotranspiration which feds the parameters like
Temperature(Max and Min), relative Humidity(Max and Min), wind velocity at 2 m above the ground surface
and solar radiation. The obtained Eto was multiplied by Crop Coefficients (Kc) (listed by FAO) to get water
requirement in millimeter/day. It was checked by manual method of calculating Eto of Penman Monteith and
was found almost the same. Crop water was analyzed in different scenario of Optimistic, The Normal and The
Pessimistic with the significant level of 5% as the data follows Normal distribution of Probability. And the
rainwater was again analyzed in to effective rain water at different former explained scenarios. The formula
used for this study was:
Eto=
0.408∆ Rn −G +γ
900
T+273
u2(es −ea )
∆ + γ(1+0.34u2)
Where,
Eto Potential Evapotranspiration
Rn Net Radiation at crop surface
G Soil heat flux density
T Mean daily air temperature at 2m above the ground surface
U2 Wind velocity at 2m above the ground surface
Es Saturation vapor pressure
Ea Actual vapor pressure
∆ Slope vapor pressure curve
Γ Psychrometric Constant
And the effective rainfall (Pe) was calculated using the following formulae:
Pe = 0.8 P - 25 if P > 75 mm/month
Pe = 0.6 P - 10 if P < 75 mm/month
Topographic survey of Chaar-Ghare area was conducted by Total Station (Topcon). The arbitrary
coordinate of 1000, 1000, 1000 (N,E,Z) was given for the bench mark (BM) and detailing was carried out. The
recorded data were plotted using Digital Terrain Modelling(DTM) with the contour interval of 0.5m. The
optimal alignment (Cut = Fill) for canal was plotted at Topo-map and longitudinal and cross section was
extracted from plotted alignment with vertical and horizontal scale of 1:1000 both. GIS map was prepared with
the help of Google Earth control points and were marked at the required boundary of Chaar-Ghare and was
mounted to Arc GIS.
Canal section was designed by using the Lacey’s Formula and special considerations (as suggested by
Irrigation Manual of Government of Nepal) were also undertaken (Fig. 2). The field was divided in to 3 parts (2
ha, 3 ha, and 4 ha)and canal section was designed for 4 ha land.For preventing seepage and percolation losses
the canal section was lined brick masonry. The canal section was kept constant throughout the length. The canal
section was 1.2m wide and 0.8 m deep including 0.15m freeboard.
For every 10 m, cross-section of ground level was prepared with required formation level and canal
section. The cascade was provided wherever necessary with concrete floor. At the 4 ha area a PVC pipe, 30cm
diameter was provided. It was found more economical than others considering the annual maintenance and
replacement cost.
Usually furrows are aligned down the main slope of land and supplied form head ditch. A tail ditch at
the end of the run collects water for reuse at lower levels.
Cross slope: It is not essential for furrows to run down the main slope. Cross-slope are used or row
crops on the land slopes of up to 12% (Withers and Vipond, 1974).
Corrugation: A form of furrow, shallow and broadly spaced, is used to irrigate pasture and small grain
crops, and as such is called a corrugation. The system is down slope on land from 0.4% to 8%, and cross slope
up to 12%. Land levelling on the steeper slopes can be limited to the removal of minor irregularities by land
plane (Withers and Vipond, 1974).
The water rotation for field was divided in such a way that the frequency of frequently water requiring
plant would not get disturbed. The water was not allowed to deplete more than Optimum Moisture Content
(OMC), so water division and distribution was made with reference to Allium Cepa.
4. Assessment of Economic Viability of Different Irrigation Methods: A Case Study Of chaar….
DOI: 10.9790/1684-12415965 www.iosrjournals.org 62 | Page
Figure 3: Furrow Irrigation and its wetting pattern (FAO, 1988)
Sprinkler is versatile method of applying water to any crop (except field crops like paddy), soil and
topographic condition. It is particularly useful in areas where there is a shortage of water; hill slopes are steep
and can erode with other methods of irrigation.
In sprinkler irrigation, surface ditches and prior land preparation are not necessary, but it was to get the
required head through gravity (Fig. 4). It was known earlier that for medium head of 20 -50 m, the sprinkler
work good with uniformity of coverage, which wasaffordable and suitable for most of the terrains and
eventually it was found the head of 20 meter withallowable head variance of 4m. The lateral of 63mm and
distributaries of 75 mm were selected and grid of each sprinkler was selected on the basis of wind direction.
Pressure and wetted land overlapping and canopy effect, 15m *15m was selected with 5 sprinklers in each
lateral of 2 m riser. Water hydrant was kept at each 15 meter interval and distributaries were kept at center of
field acquiring both sides. The filed size was 110m wide and 180 m long. The field was again divided in former
3 parts and water for larger field crop was selected. Required numbers of portable lateral was calculated, and 40
laterals were found to be required. All material in sprinkler was made from Poly Vinyl Chloride (PVC).
Figure 4: Lateral and Distributary Distribution
Agricultural considerations for better productivity regarding soil and their compatibility with crops,
access to scheme in terms of provisions of input and marketing of produce, provision of facilities for agro-
processing, the possibility of crop diversification in future was carried out simultaneously.
III. Results And Discussion
Surface Irrigation (Furrow Irrigation)
Many agricultural crops can be grown in beds separated by furrows. When irrigation is required, water
can be run into the furrows. This system works well if the furrow hydraulics are correct for uniformity along the
run and if water movement within the soil is predominantly horizontal into the plant root zone.It may be
undesirable for water to rise within the bed by capillarity until the ground surface is wet. Compared to other
surface irrigation practices, there is less open water surface and therefore less evaporation from furrow, the risk
of pudding soil is reduced, and farmers can work on the field sooner after the end of water application.Corrected
5. Assessment of Economic Viability of Different Irrigation Methods: A Case Study Of chaar….
DOI: 10.9790/1684-12415965 www.iosrjournals.org 63 | Page
mean discharge was found 0.161 cumecs with field capacity (FC) 0.331 and permanent wilting point (PWP)
0.123.
Eto was found 0.95 mm/day for the month of December (Minimum) and 5.73 mm/day for month of May
(Maximum). Such variation was due to higher Temperature, lower percentage of Relative Humidity in the
month of May than that of December.
Figure 5: Potential Evapotranspiration
Separate calculation on the basis of the cropping period of plants which can be sown together in largest
partitioned land of 4 ha. The water requirement for evapotranspiration is calculated and according to soil
characteristic (Loamy Clay) the seepage and percolation loss was 5mm/day(FAO, 1982, 1997, 1998) while the
water requirement for plant andthe frequency of irrigation were also calculated simultaneously. The combine
discharge of plants that can be planted together were computed and then multiplied by land area to be sown
giving the quantity of water in cum/month and the canal was designed for that discharge. The corrected
discharge of the stream was found 0.161 cumecs.
Sprinkler Irrigation
Sprinkler system typically comprises of a water source, a piped conveyance network and a means of
ejecting water into the air to fall as spray or gun. The system requires relatively high pressure to operate or a
high head, which could be provided through gravity or pumping (UNDP, 1998).
Comparison of surface (furrow) irrigation with sprinkler irrigation
After the calculation of all field data, an overall result was obtained. The result and comparison is presented in
the table (Table 1).
Table 1: Comparison of surface (furrow) irrigation with sprinkler irrigation
S.N. Parameter Surface irrigation Sprinkler Irrigation
1 Crops Solanumlycopersicum (tomato), Alliumcepa
(onion), Alliumsativum (garlic), Zeamays (corn)
Solanumlycopersicum (tomato), Alliumcepa
(onion), Alliumsativum (garlic), Zeamays
(corn)
2 Water requirement 293617 m3
232741 m3
3 Yield , kg Solanumlycopersicum 93787 Solanumlycopersicum 95832
Allium sativum 10878 Allium sativum 11979
Zea mays 6970 Zea mays 7986
Allium cepa 7151 Allium cepa 7872
4 Total return NRs. 5503200 USD 56155 NRs. 5772750 USD 58905
5 Structure cost NRs.6938965.94 USD 72280 NRs. 1390600 USD 14485
6 Useful life Canal 60 years Tank 60 years
HDPE pipe 5 years Sprinkler 12 years
7 Return/m3
of water NRs.14.52 USD 0.15 NRs. 23.68 USD 0.24
6. Assessment of Economic Viability of Different Irrigation Methods: A Case Study Of chaar….
DOI: 10.9790/1684-12415965 www.iosrjournals.org 64 | Page
Form the calculation for surface irrigation, Yield for Paddy was 107.811 ton in 9 ha with water requirement of
1858.9 mm and the IWUC was 0.019 t/ha/mm similarly or Solanumlycopersicum = 0.05,
Zeamays=0.057,Alliumcepa= 0.08 t/ha/mm and in case of sprinkler irrigation,Solanumlycopersicum=0.053,
Zeamays=0.059, Alliumcepa=0.082 and Alliumsativum =0.062 t/ha/mm, which was quietly satisfied with other
literatures too.
The water requirement was calculated on the basis of water used by plant throughout its development stages and
is presented in figure 5 for bothsurface and sprinkler irrigation respectively. The yield data were collected on the
basis of 2 years survey with their local market selling rate. Sprinkler system typically comprises of a water
source, a piped conveyance network and a means of ejecting water into the air to fall as spray or gun. The
system requires relatively high pressure to operate or a high head, which may be provided through gravity or
pumping (UNDP, 1998).
Figure 6: Water requirement for Furrowand Sprinkler irrigation
This bar chart compares the amount of water requirement per year bySolanumlycopersicum, Alliumsativum,
Zeamays and Alliumcepa.The water requirement was calculated based on the pessimistic scenario of water
available and hydrological parameters.
It could be clearly seen for furrow irrigation that the lowest water requirement is for Zeamays (17400 cu. m) and
Alliumcepa (32375cu. m) the next isAlliumsativum (33135 cu.m).The highest water requirement is for
Solanumlycopersicumwith water requirement of 210345cu. m.
It could be clearly seen for sprinkler irrigation that the lowest water requirement is for Zeamays (14536 cu. m)
and Alliumsativum (18080cu. m) the next isAlliumcepa (22735cu.m). The highest water requirement is for
Solanumlycopersicum with water requirement of 177390cu. m.
Figure 7: Yield of crops for Furrow and Sprinkler irrigation
The yield was calculated through field survey and it is presented in Figure 7. This bar chart (Fig. 7)
compares the crop yield in kg per year per hector for Solanumlycopersicum, Alliumsativum, Zeamays and
7. Assessment of Economic Viability of Different Irrigation Methods: A Case Study Of chaar….
DOI: 10.9790/1684-12415965 www.iosrjournals.org 65 | Page
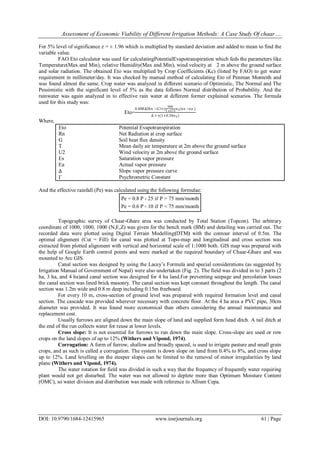
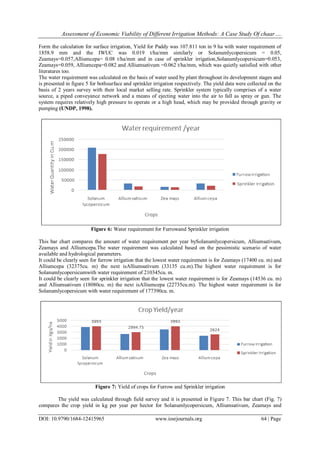
Alliumcepa. It could be clearly seen for Furrow Irrigation that the lowest yield was of Alliumcepa (2383kgs/ha)
and Alliumsativum(2719kgs/ha), the next was Zeamays (3485kgs/ha). The highest yield was of
Solanumlycopersicum with yield of 3907kgs/ha.
While for Sprinkler Irrigation, it could be clearly seen that the lowest yield was of Alliumcepa
(2624kgs/ha) and Alliumsativum (2994kgs/ha). The highest yield was of Solanumlycopersicum with yield of
3933kgs/ha and Zeamaysof 3933kgs/ha.
IV. Conclusions
For assessing economic viability,the study found out the cost of the irrigation structures such as canal,
cascade, and outlet (for surface irrigation). And for sprinkler: distributaries, laterals, hydrant, and tank.
Similarly, the corresponding yield of the nine ha fieldwas found out. Last but not the least, the study found out
the water required for each crop to be grown in that corresponding 9 ha of field (Chaar-Ghare) and also the
percolation and seepage losses. Thus, the study concluded to introduce various techniques of irrigation to the
farmers which could help them to increase their agricultural productivity with consumptive use of water. The
profit per cubic meter of water was found to be NRs. 14.52 and NRs. 23.68 for surface and sprinkler irrigation
respectively. In this way, the study showed that sprinkler irrigation is almost one and half fold economical and
profitable thansurface irrigation.
Acknowledgement
All the irrigators’ community of Chaar-Ghare helped us during field survey. Mr. Uday Bilas Panta,
Mr.Deewakar Rai, Mr. Safal Lal Joshi, Mr. Ashish Khadka, and Mr. Vivek Gyawali participated in field
survey. Similarly, Prof. Dr. Shanti Nath Shrestha and Dr. Narayan Kumar Shrestha guided us during field work.
Thus, we would like to acknowledge all of them for their contribution.
References
[1]. Al-Jamal, M.S., Ball,S., Sammis,T.W., 2001. Comparison of sprinkler, trickle and furrow irrigation efficiencies for Allium Cepa
production. Agric. Water Manage. 46:253-266.
[2]. Armon, R., Gold,D.,Brodsky,M.,Oron,G., 2002. Surface and subsurface irrigation with effluents of different qualities and presence
of cryptosporidium oocysts in soil and on crops. Water Science & Technology 46 (3): 115–122.
[3]. Bassoi, L.H., Hopmans, J.W.,de C. Jorge, L.A., de Alencar, C.M.,Silva,J., 2003. Grapevine root distribution in drip and
microsprinkler irrigation. Sci. Agric. (Piracicaba, Braz.) 60:377-387.
[4]. Bekele, S.,Tilahun,K., 2007.Regulated deficit irrigation scheduling of Allium cepa in a semiarid region of Ethiopia. Agric. Water
Manage. 89:148-152.
[5]. Bogle, C.R., Hartz, T.K., Nunez, C., 1989.Comparison of subsurface trickle and furrow irrigation on plasticmulched and bare soil
for Solanumlycopersicumproduction.J. Am. Soc. Hort. Sci. 114 (1)
[6]. Bozkurt, Y., Yazar, A., Gencel, B., Sezen, M.S., 2006. Optimum lateral spacing for drip-irrigated Zea mays in the Mediterranean
Region of Turkey. Agriculture Water Management 85:113-120.
[7]. Bryla, D.R., Dickson, E.,Shenk, R., Johnson, R.S., Crisosto, C.H., Trout,T.J., 2005. Influence of irrigation method and scheduling
on patterns of soil and tree water status and its relation to yield and fruit quality in peach. HortScience 40:2118-2124.
[8]. Burguete, J., Zapata, N., García-Navarro,P.,Maïkaka, M., Playán, E., Murillo,J., 2009.Fertigation in furrows and level furrows
systems. I. Model description and numerical test. J. Irrig. Drain. Eng. 135:401-412.
[9]. Burguete, J., Zapata, N., García-Navarro,P.,Maïkaka, M., Playán, E., Murillo,J. 2009b.Fertigation in furrows and level furrows
systems. II. Field experiments, model calibration, and practical applications. J. Irrig. Drain. Eng. 135:413-420.
[10]. DHM, 2013.Official records of hydro-meteorology, Kathmandu
[11]. Ellis, J.E., Kruse, E.G., McSay, A.E., Neale, C.M.U., Horn, R.A., 1986.A comparison of ®ve irrigation methods on Allium Cepas.
Hort. Sci. 21 (6), 1349-1351.
[12]. Erich, T. and Prayag, R.J., 1992. "Historical Hiti and Pokhari: Traditional Solutions to Water Scarcity in Patan"
[13]. FAO, 1997. Crop water requirement, Irrigation and Drainage Paper
[14]. FAO, 1982. Mechanized Sprinkler Irrigation. FAO Irrigation and Drainage Paper 35, 409 p.
[15]. FAO, 1998. Crop Evapotranspiration. FAO Irrigation and Drainage Paper 300 p.
[16]. Howell, T., 1994.Irrigation engineering, evapotranspiration. In: Arntzem, C.J., Ritter, E.M. (Eds.), Encyclopaedia of Agricultural
Science. Vol. 2, pp. 591-600.
[17]. McGuckin, J.T., Mapel, C., Lansford, R., 1987. Optimal control of irrigation scheduling using a random time frame. Am. J. Agric.
Econ. 69, 123-133.
[18]. NARC, 2011. Yearly development report, Vegetable Development Directorate, Khumaltar, Lalitpur
[19]. Ortiz Romero, J.N., Martínez, J., Martínez, R., Tarjuelo,J.M, 2006. Set sprinkler irrigation and its cost. J. Irrig. Drain. Eng. 132:445-
452.
[20]. Rana, M. A.,Arshad,M., Masud,J., 2006.Effect of Basin, Furrow and Raingun Sprinkler Irrigation Systemson Irrigation Efficiencies,
Nitrate-Nitrogen Leaching and Yield of Sunflower
[21]. Robert, W. H., 2001. Management of sprinkler irrigation system
[22]. Sammis, T.W., 1980. Comparison of sprinkler, trickles, subsurface and furrow irrigation methods for row crops. Agron. J. 72, 701-
704.
[23]. UNDP, 1998. PSD Manual, Part –I
[24]. Withers and Vipond, 1974. Irrigation Design and Practice
[25]. Wu, I.P., 1988. Linearized water application function for drip irrigation schedules. Trans. ASAE 31 (6), 1743-1749.