Downloaded 49 times


![Variable Parameter File Range Default
Value
Calibrated
Value
Flow SFTMP .bsn 1.0 1.5
SMTMP .bsn 0.5 -2.5
SMFMN .bsn 4.5 1.5
SNOCOVMX .bsn 1.0 25
ESCO .bsn, .hru [0,1] 0.95 0.90
SURAG .bsn 4.0 1.0
SHALLIST .gw 0.5 600
ALPHA_BF .gw [0,1] 0.048 0.4
QWQMN .gw [0,1,000] 0.00 150
GW_REVAP .gw [0.02,0.2] 0.02 0.055*
REVAPMN .gw 1.0 125
Default and Calibrated Values of SWAT-T calibration
parameters for Flow
* : Hru 15-22](https://image.slidesharecdn.com/erosionandrunoffevaluation-140812152115-phpapp01/75/Erosion-and-runoff-evaluation-38-2048.jpg)
![Variable Parameter File Range Default
Value
Calibrated
Value
Sediment USLP_P .mgt [0,1] 1.0 0.70
USLE_K .sol [-25,25] 0.43 0.28
USLE_C Crop.dat for corn & soybean were adjusted according to
the values given by Alberts et al. 1984
CH_EROD .rte [0,1] 0.0 0.6
CH_COV2 .rte [0,1] 0.0 0.6
ADJ_PKR .bsn 0.0 0.8
PRF .bsn 1.0 0.8
SPCON .bsn [0.0001,0.01] 0.0001 0.0055
SPEXP .bsn [1,2] 1.0 1.25
Default and Calibrated Values of SWAT-T calibration
parameters for Sediment](https://image.slidesharecdn.com/erosionandrunoffevaluation-140812152115-phpapp01/75/Erosion-and-runoff-evaluation-39-2048.jpg)
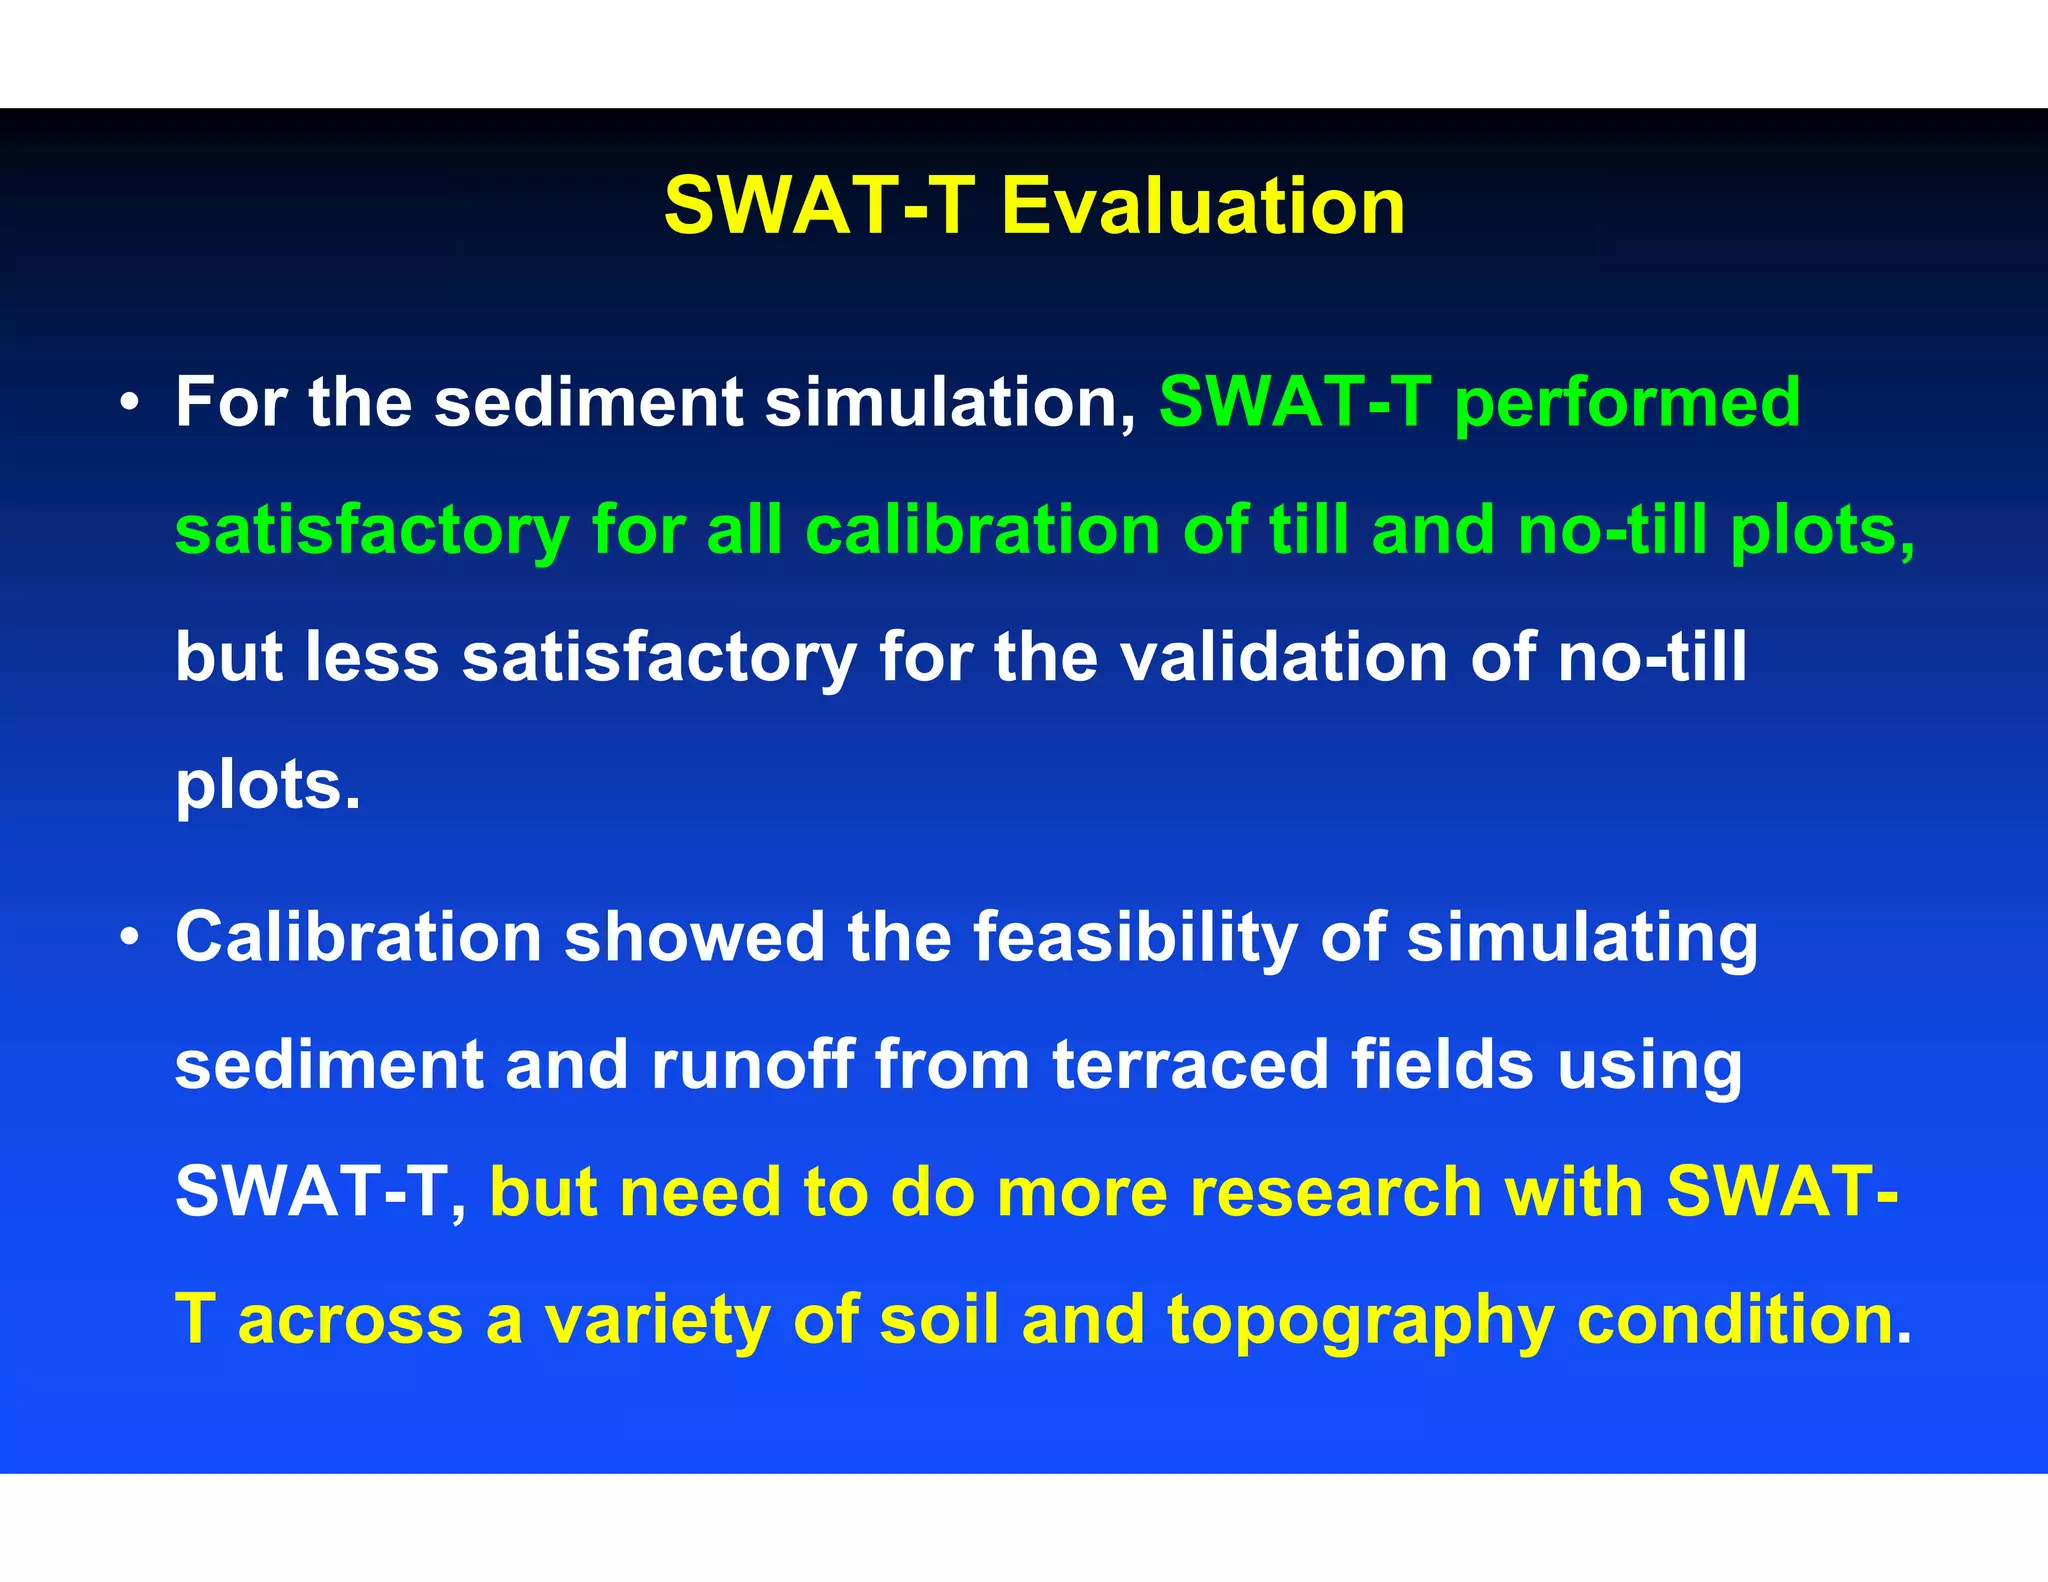


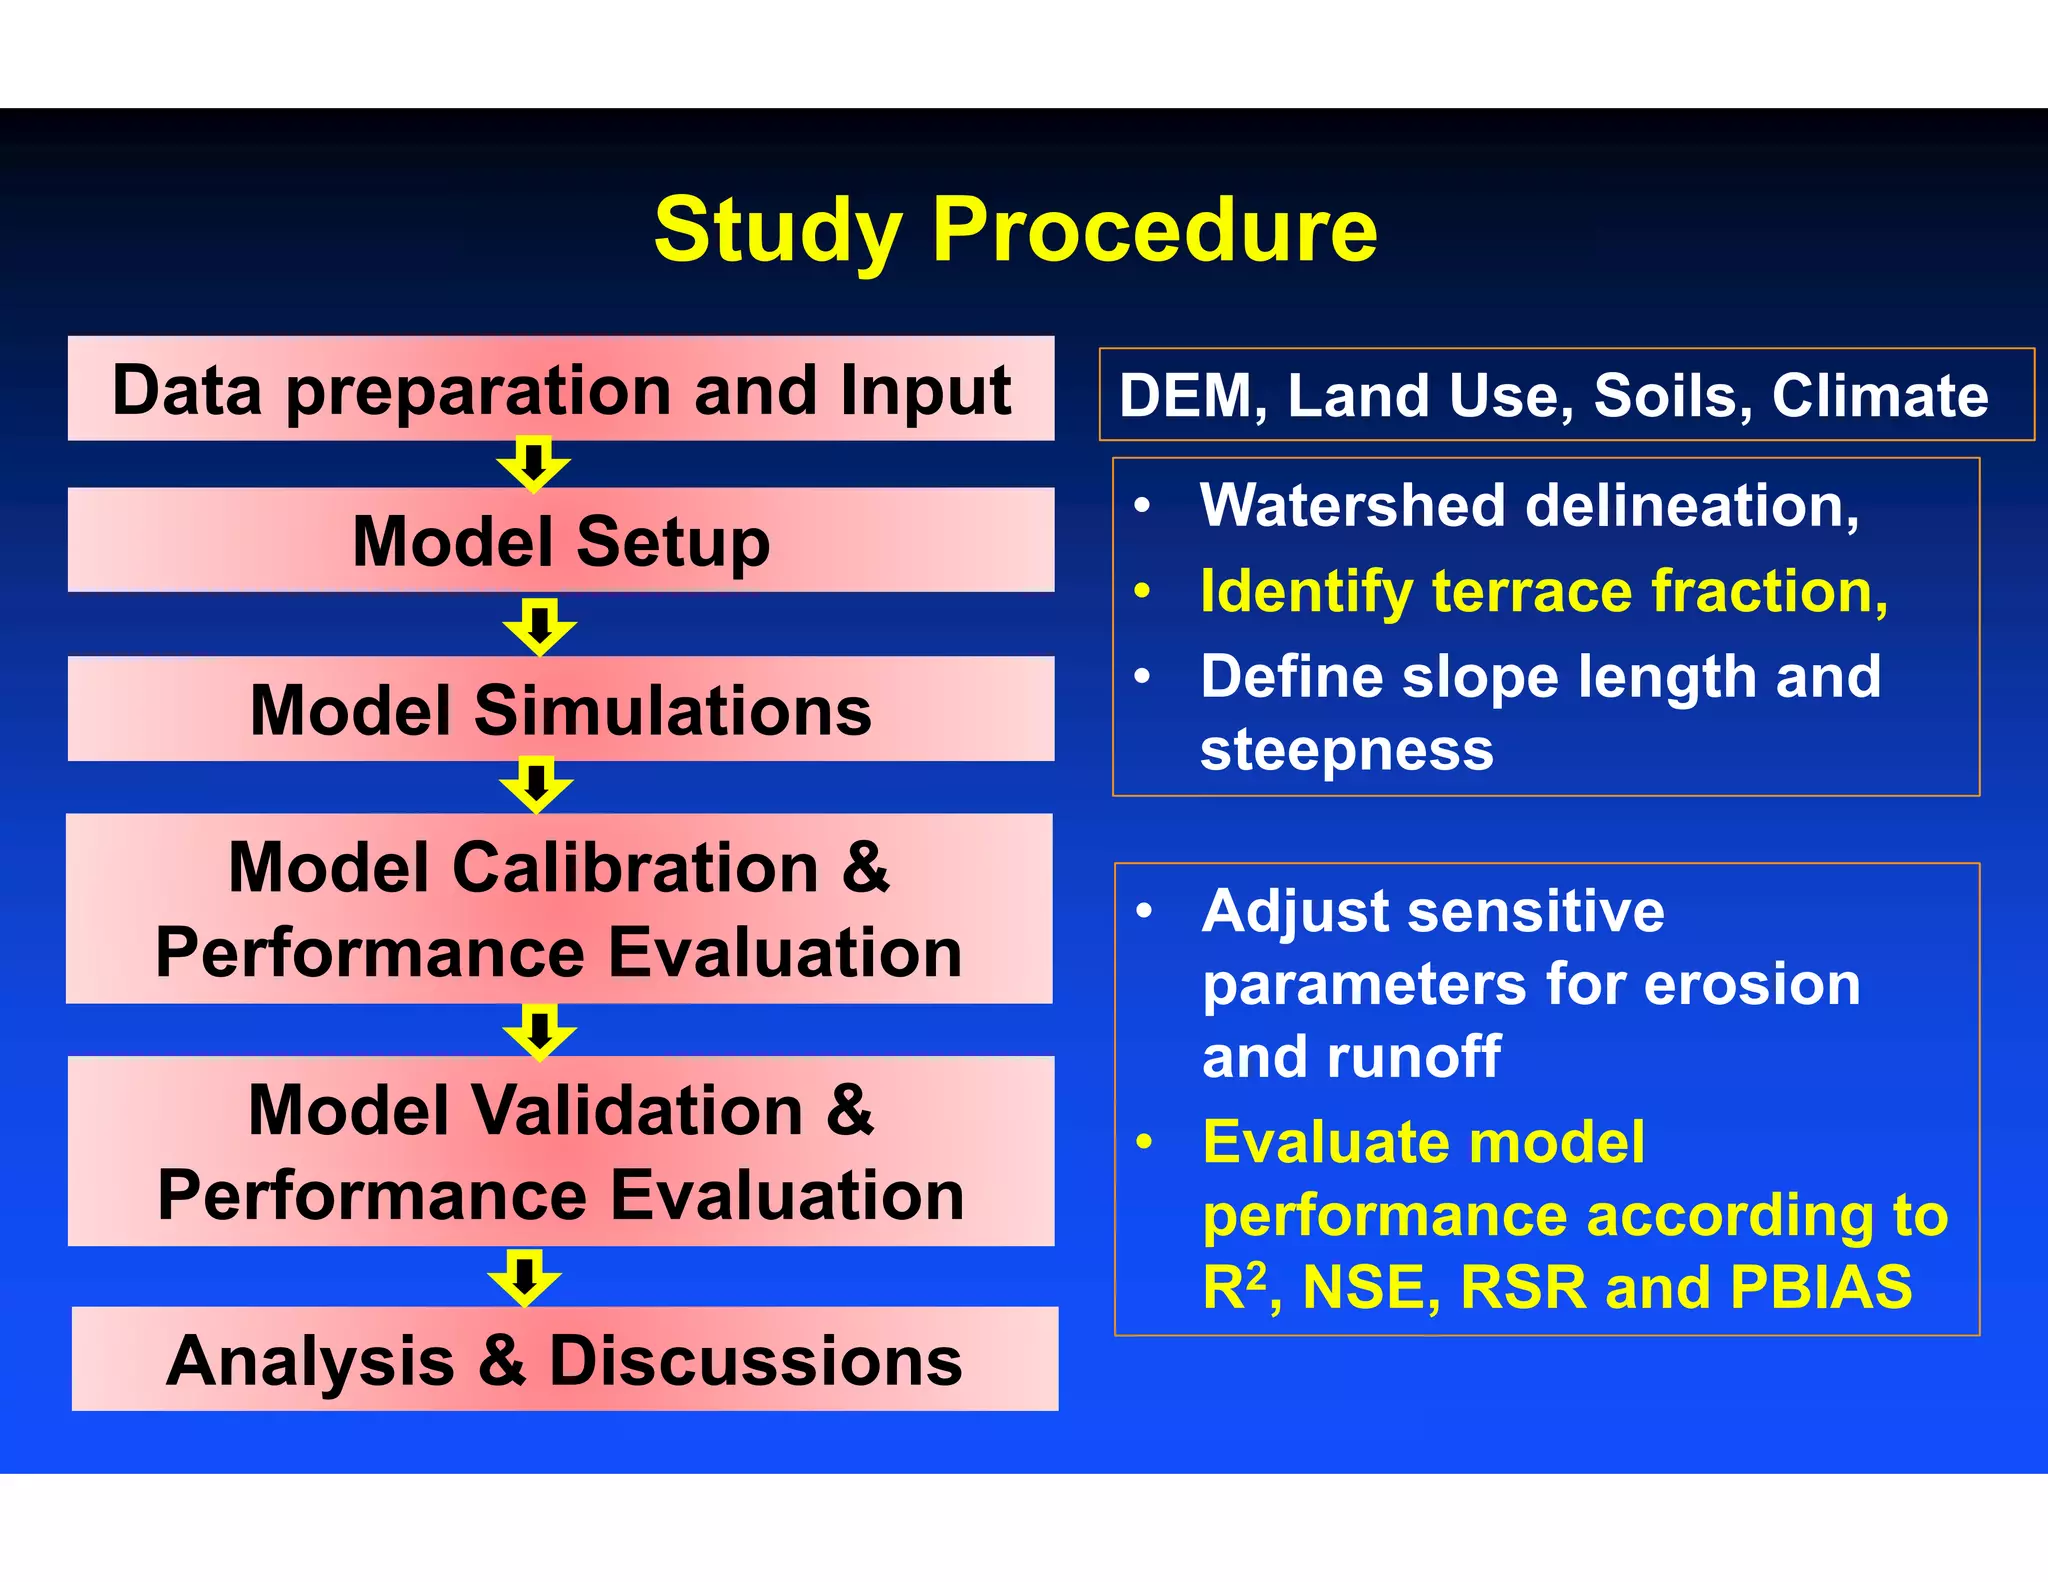
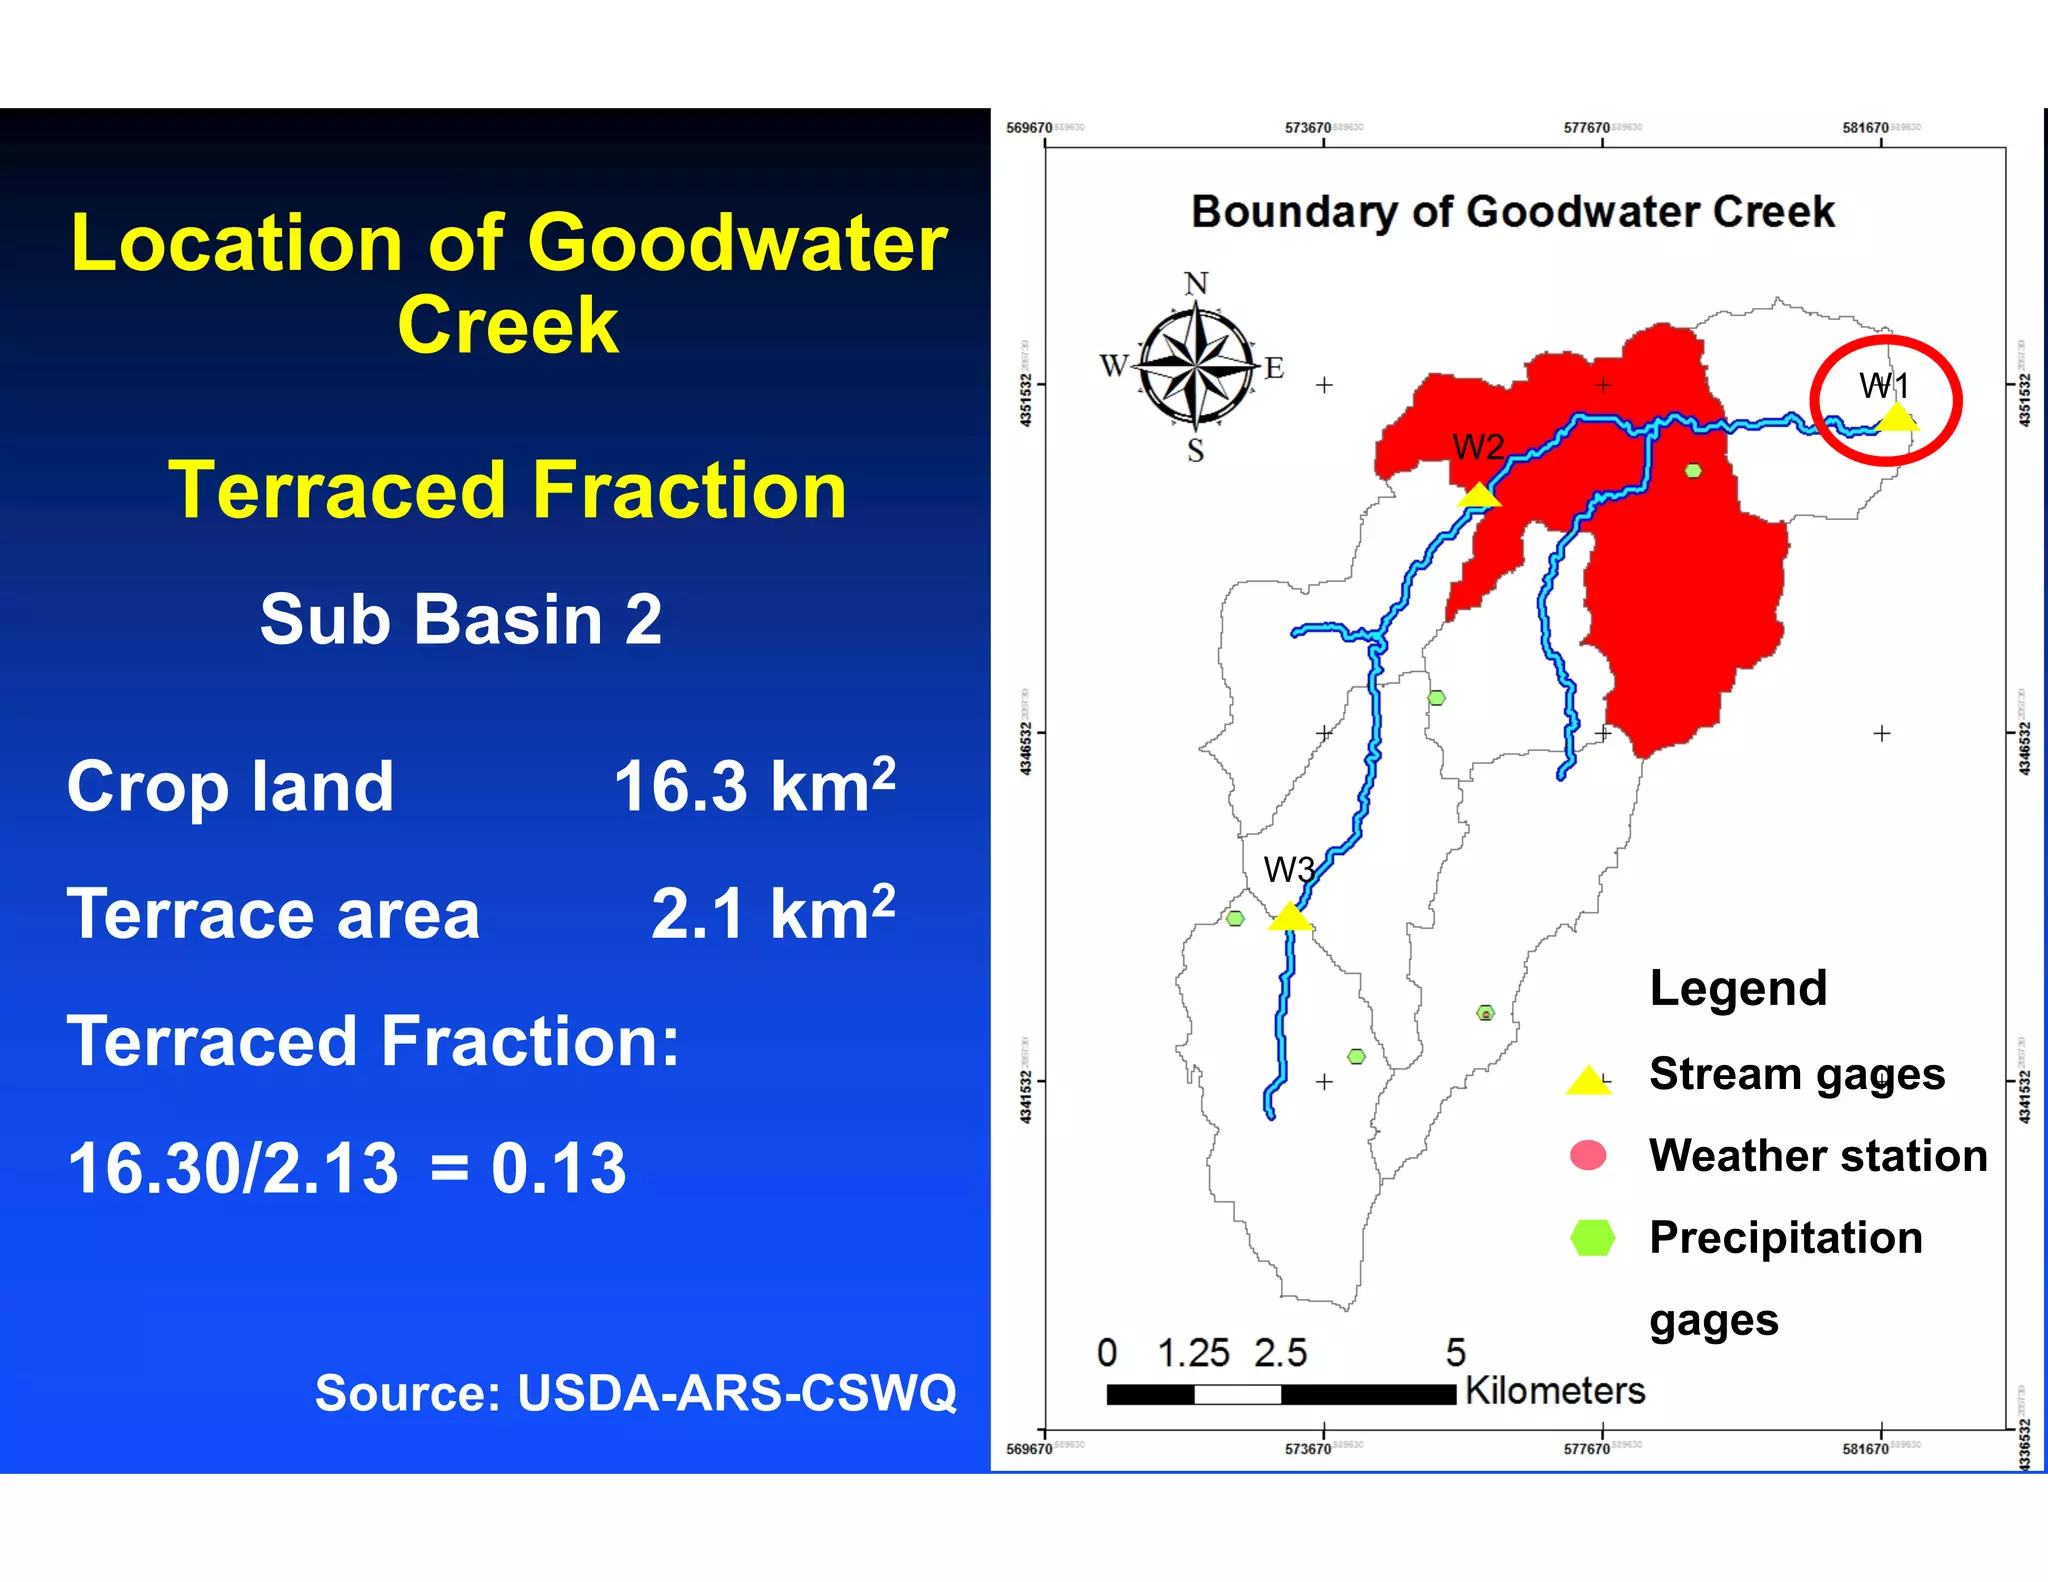
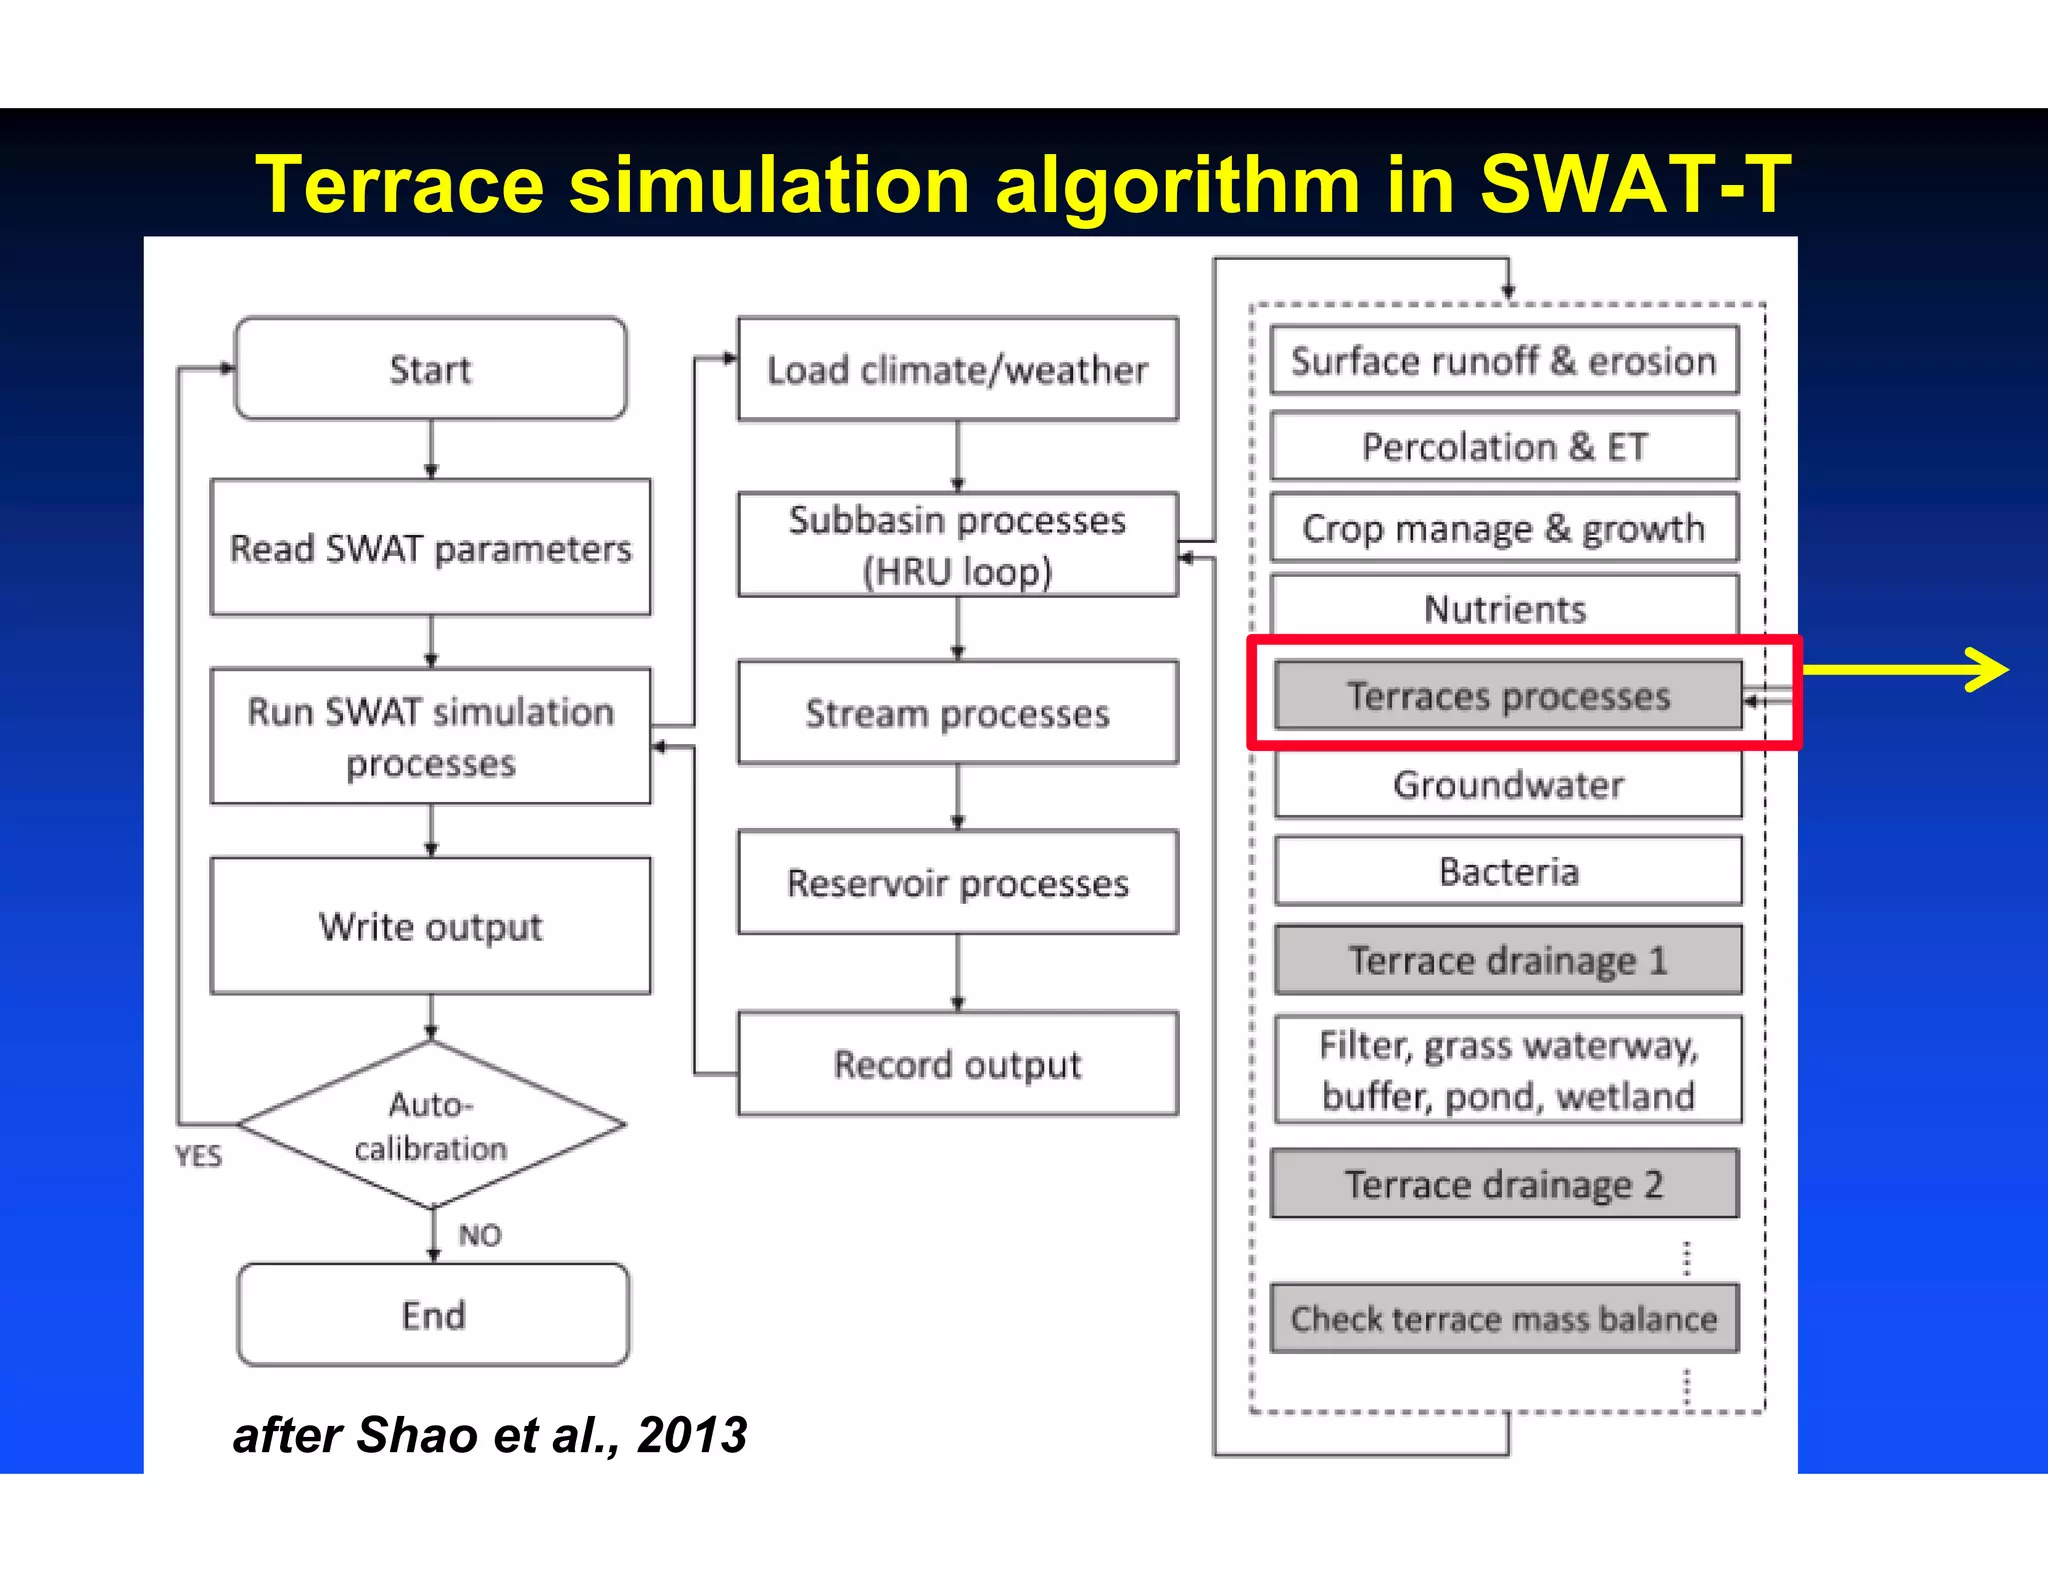
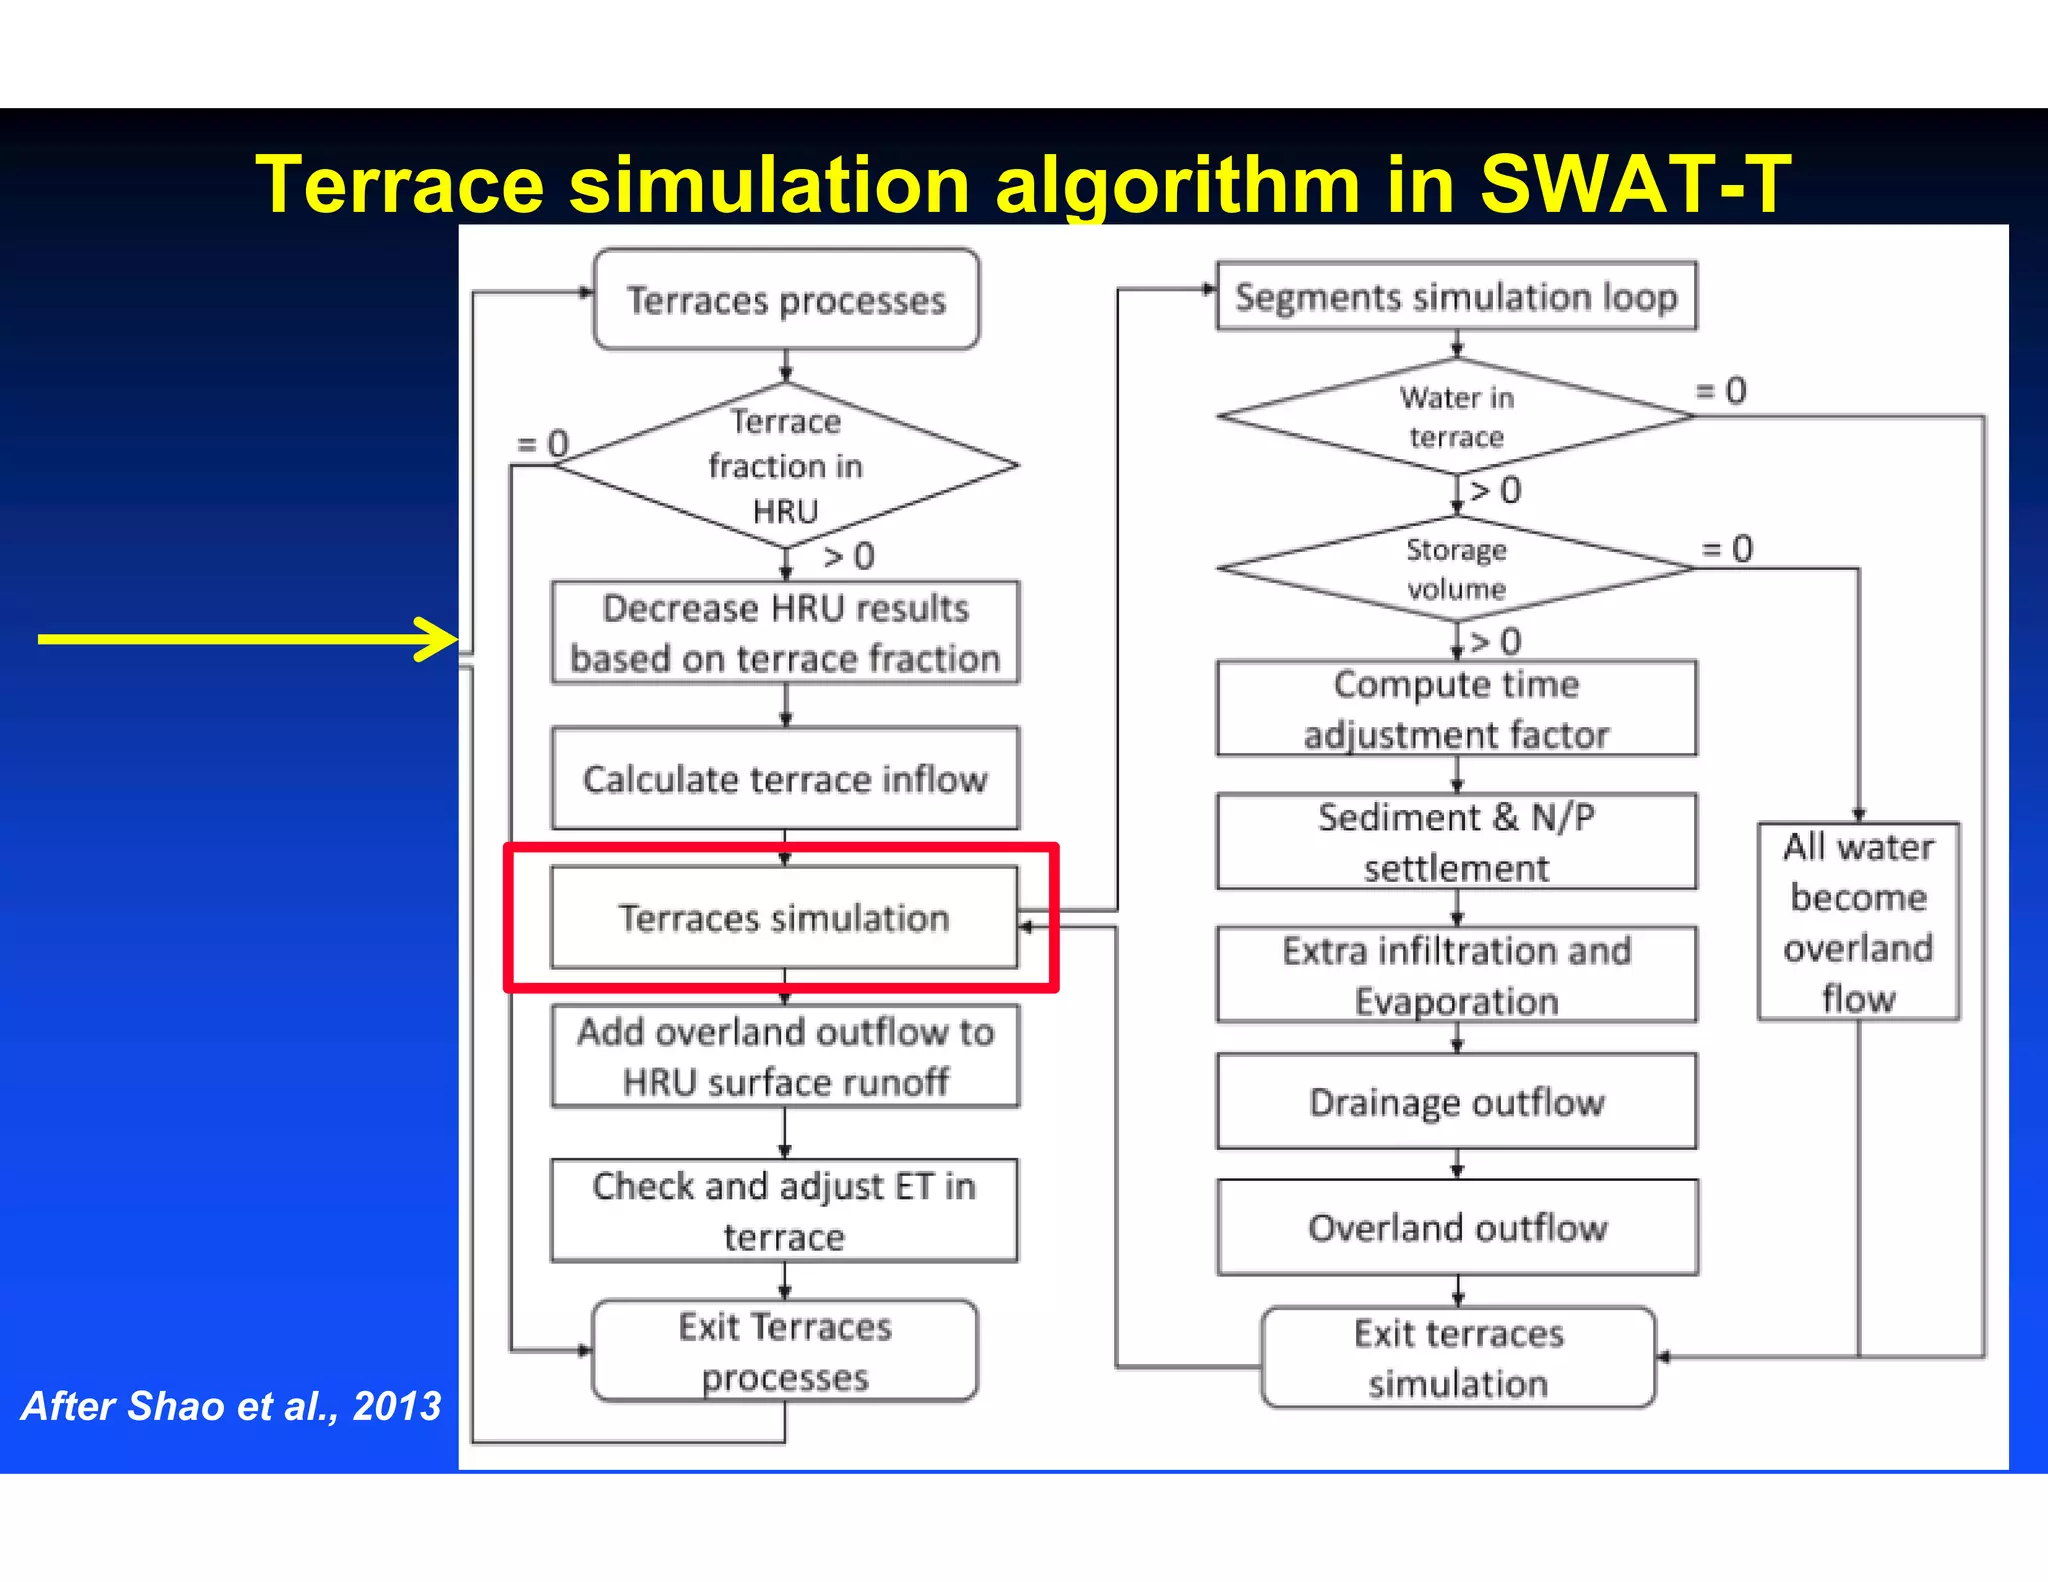
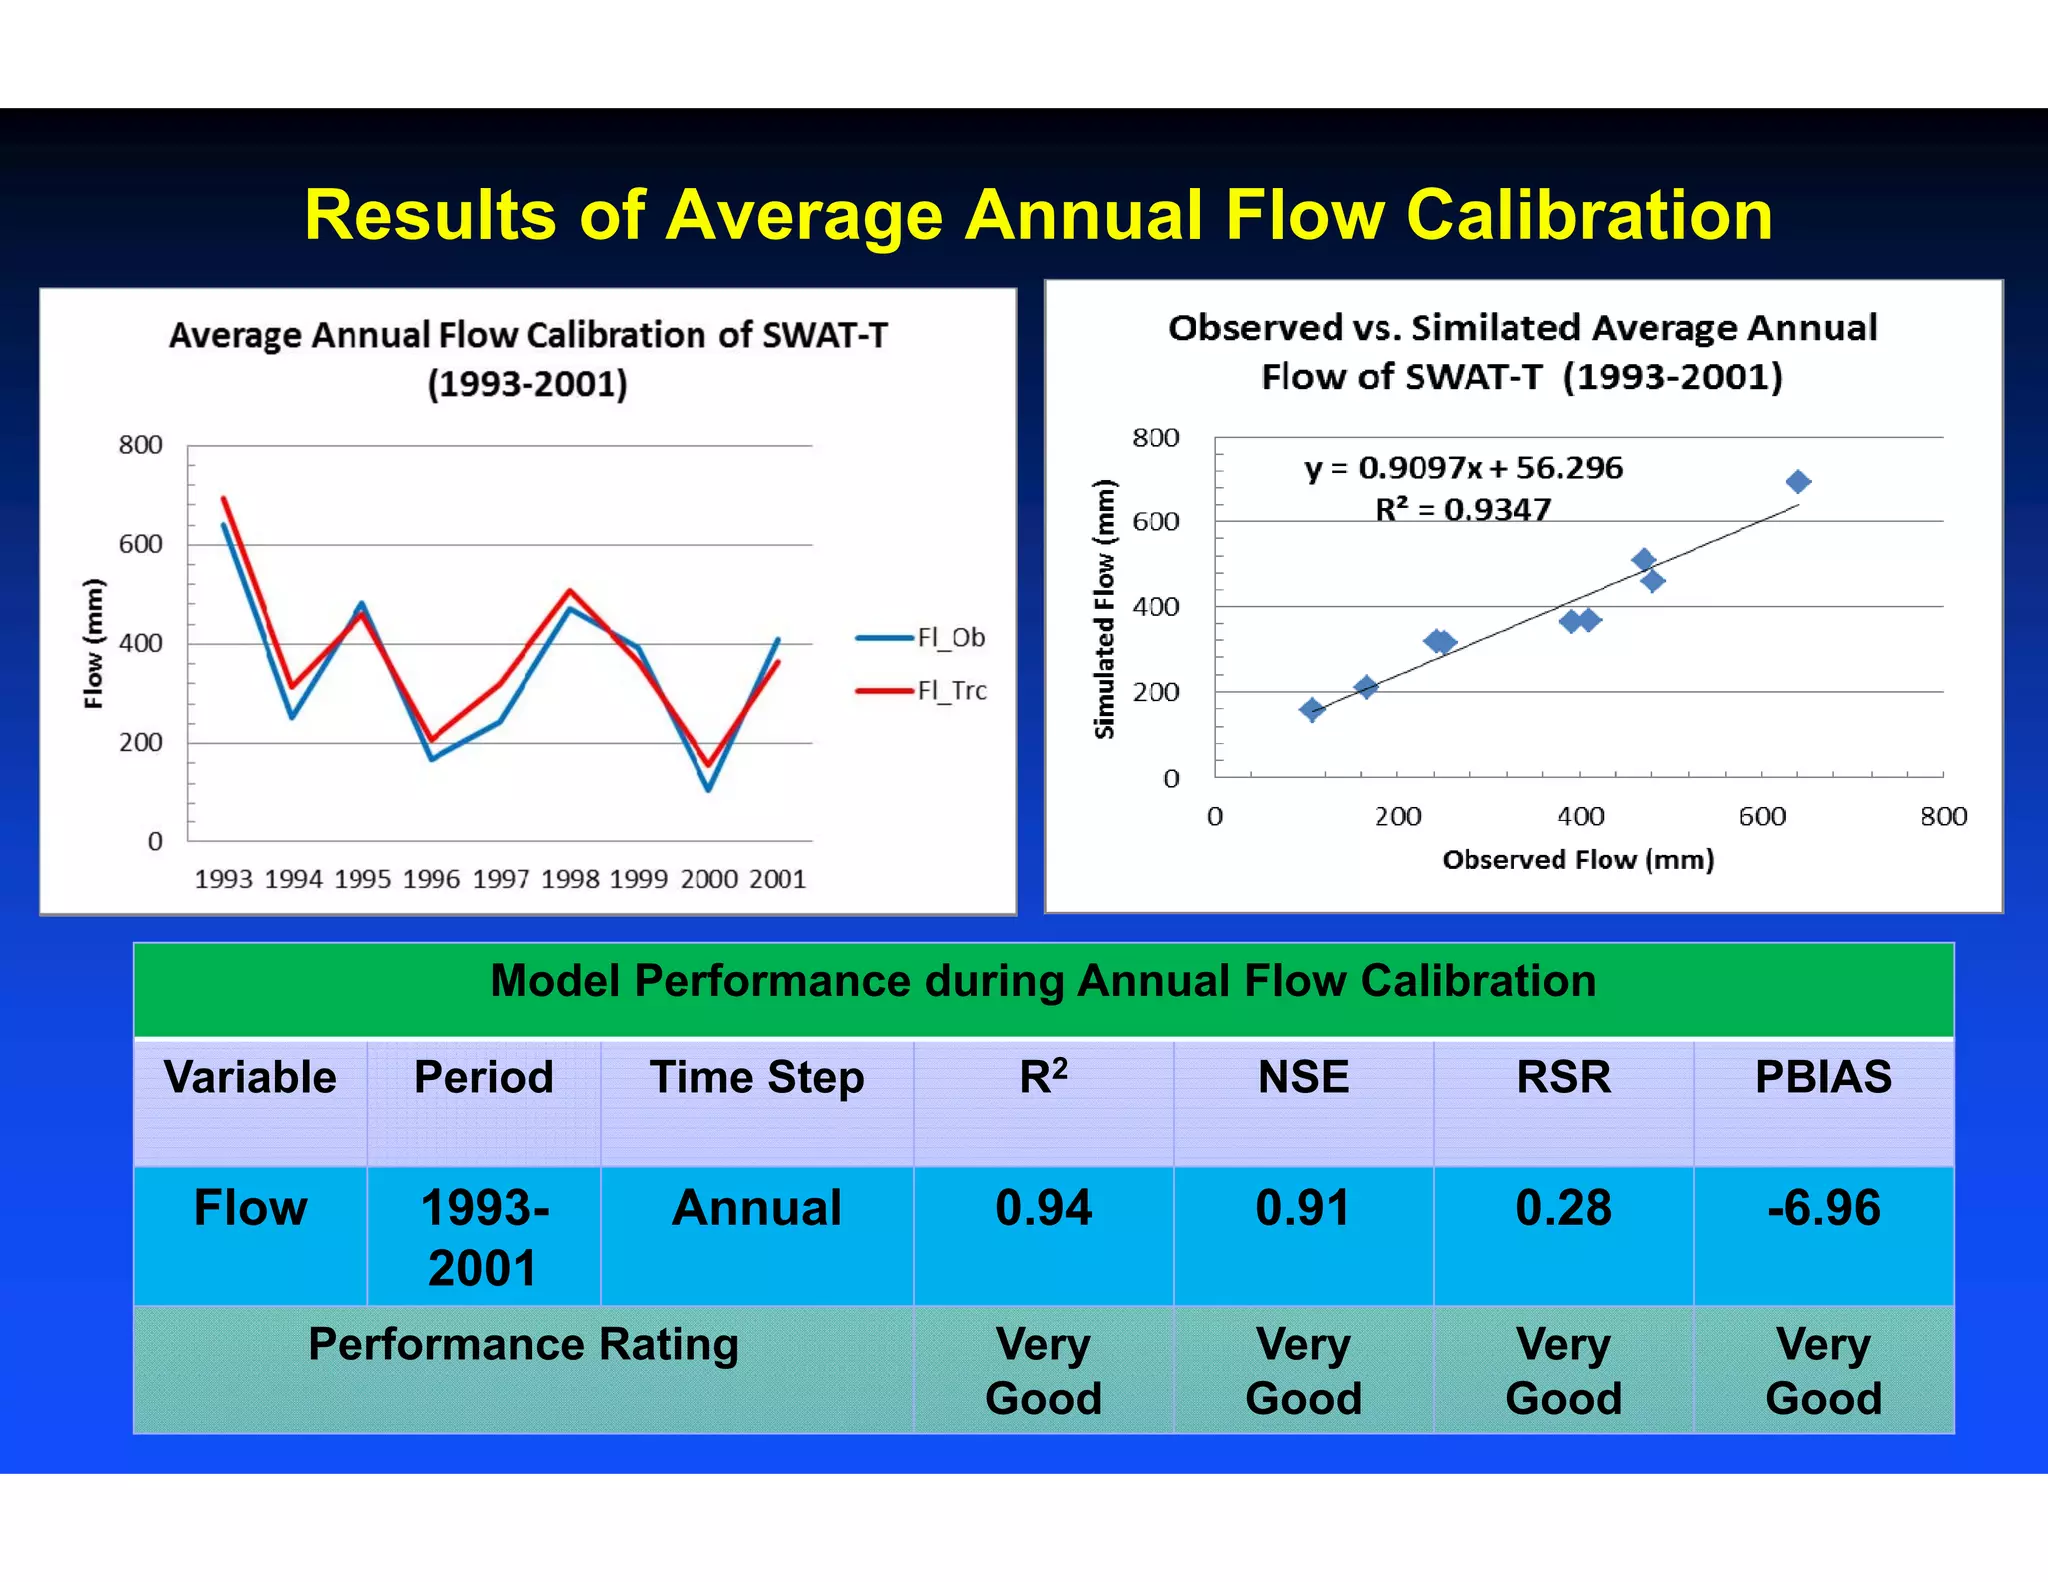
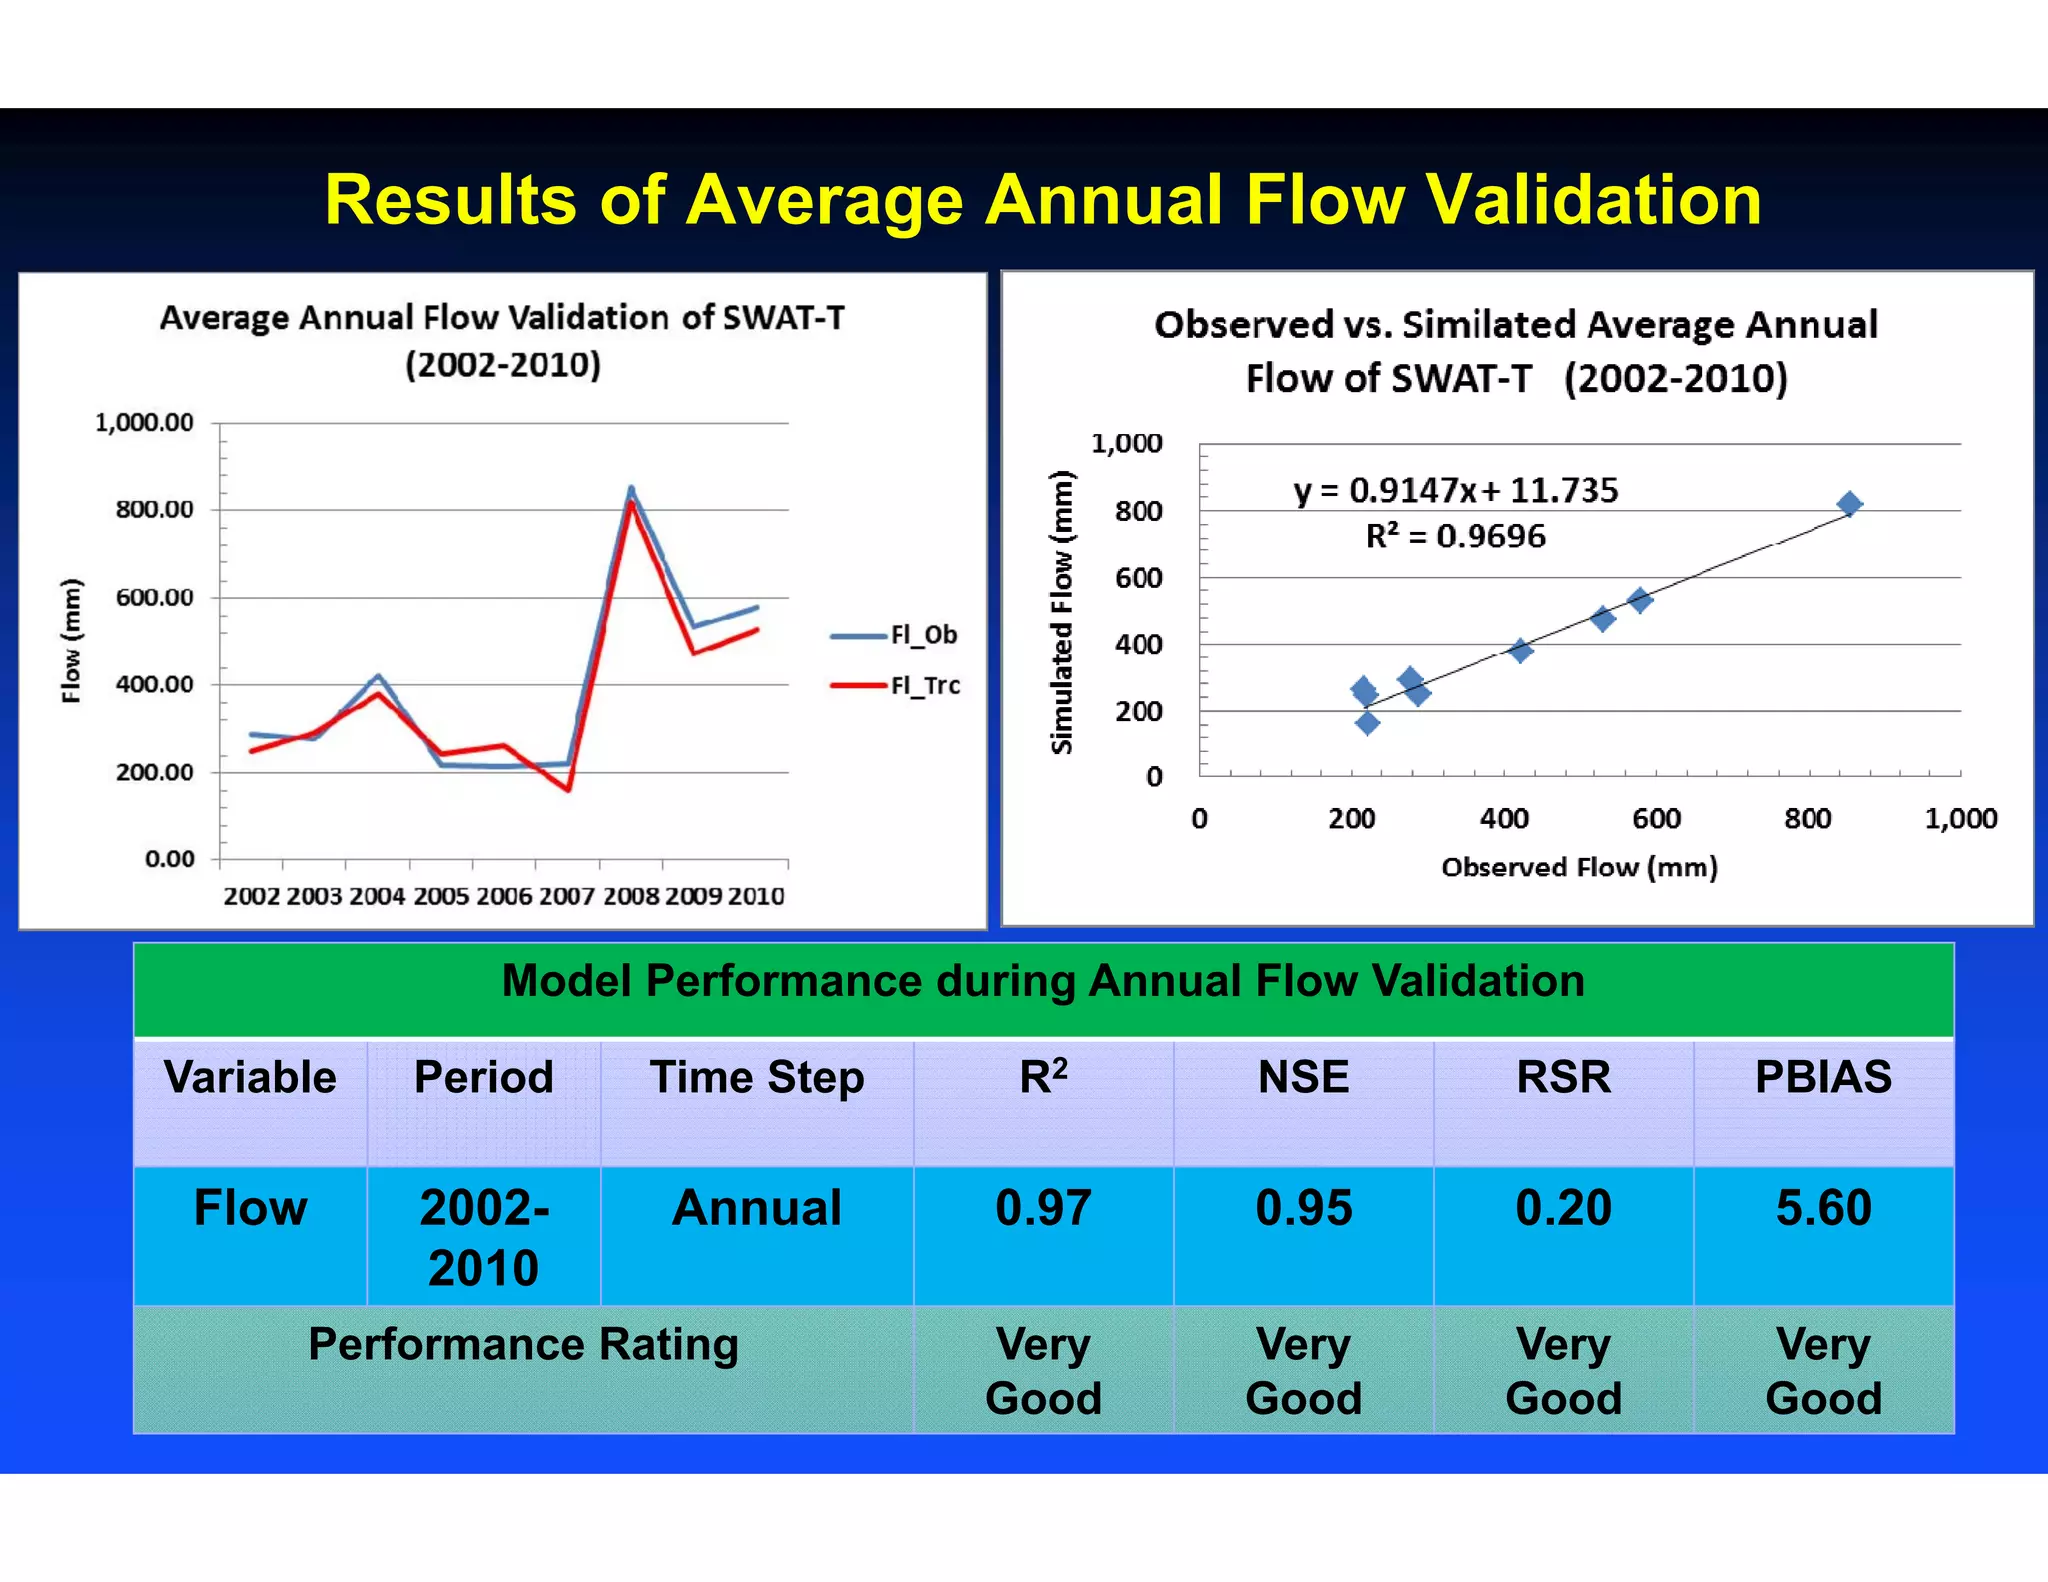
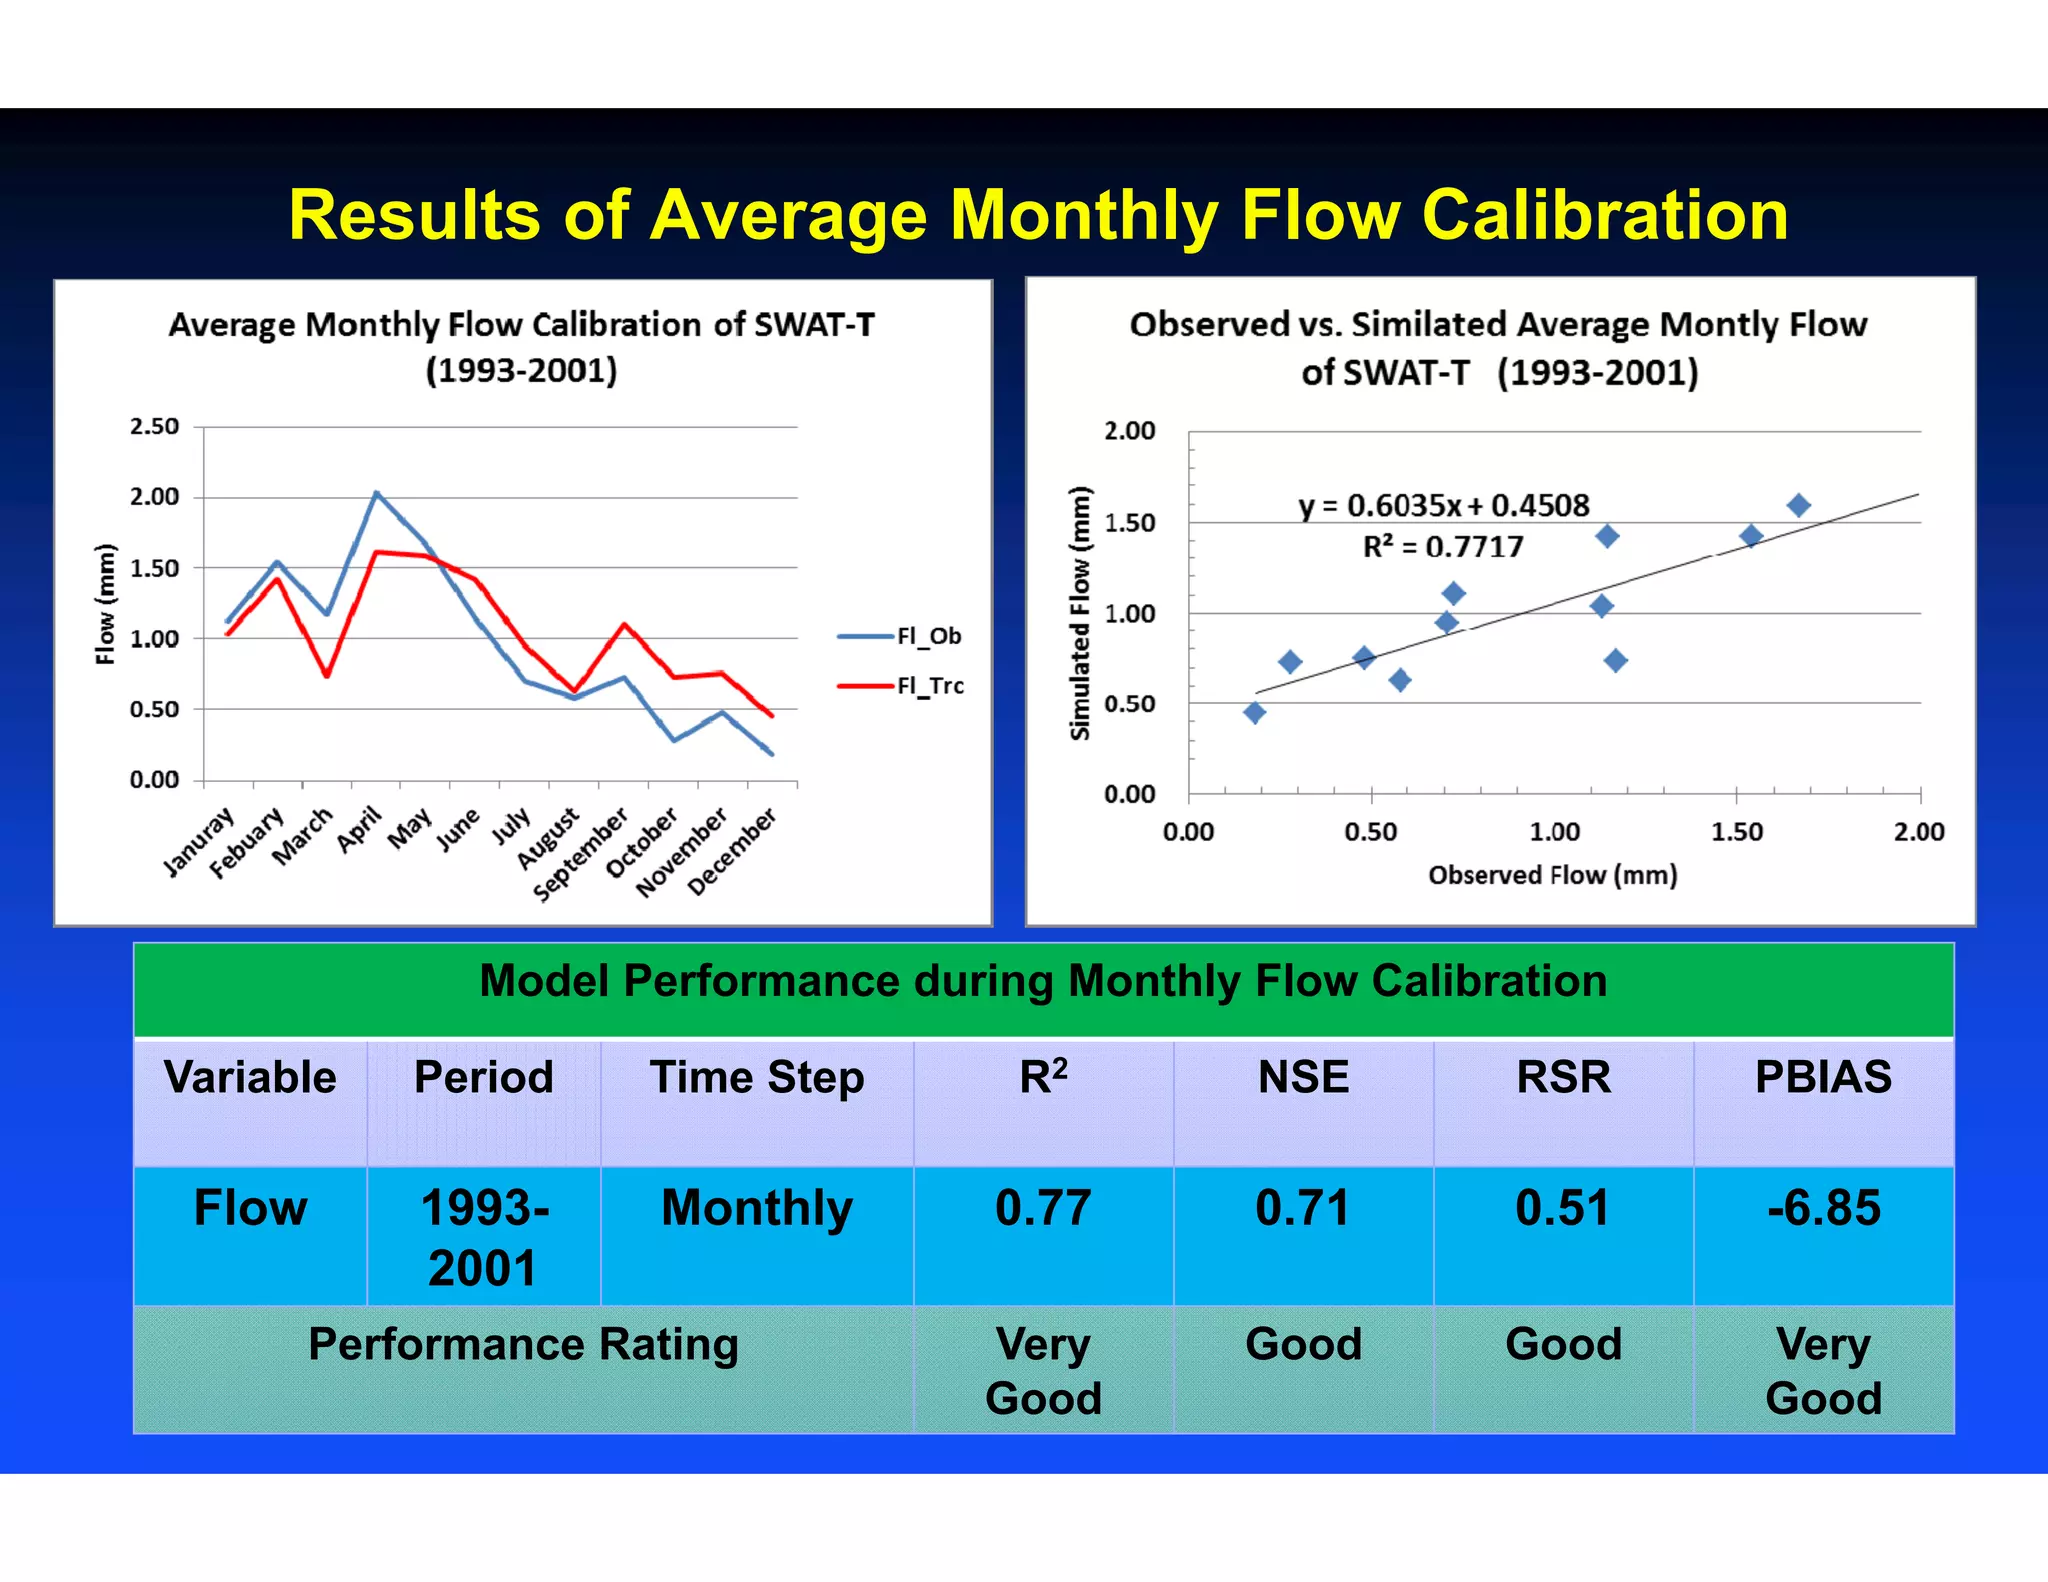
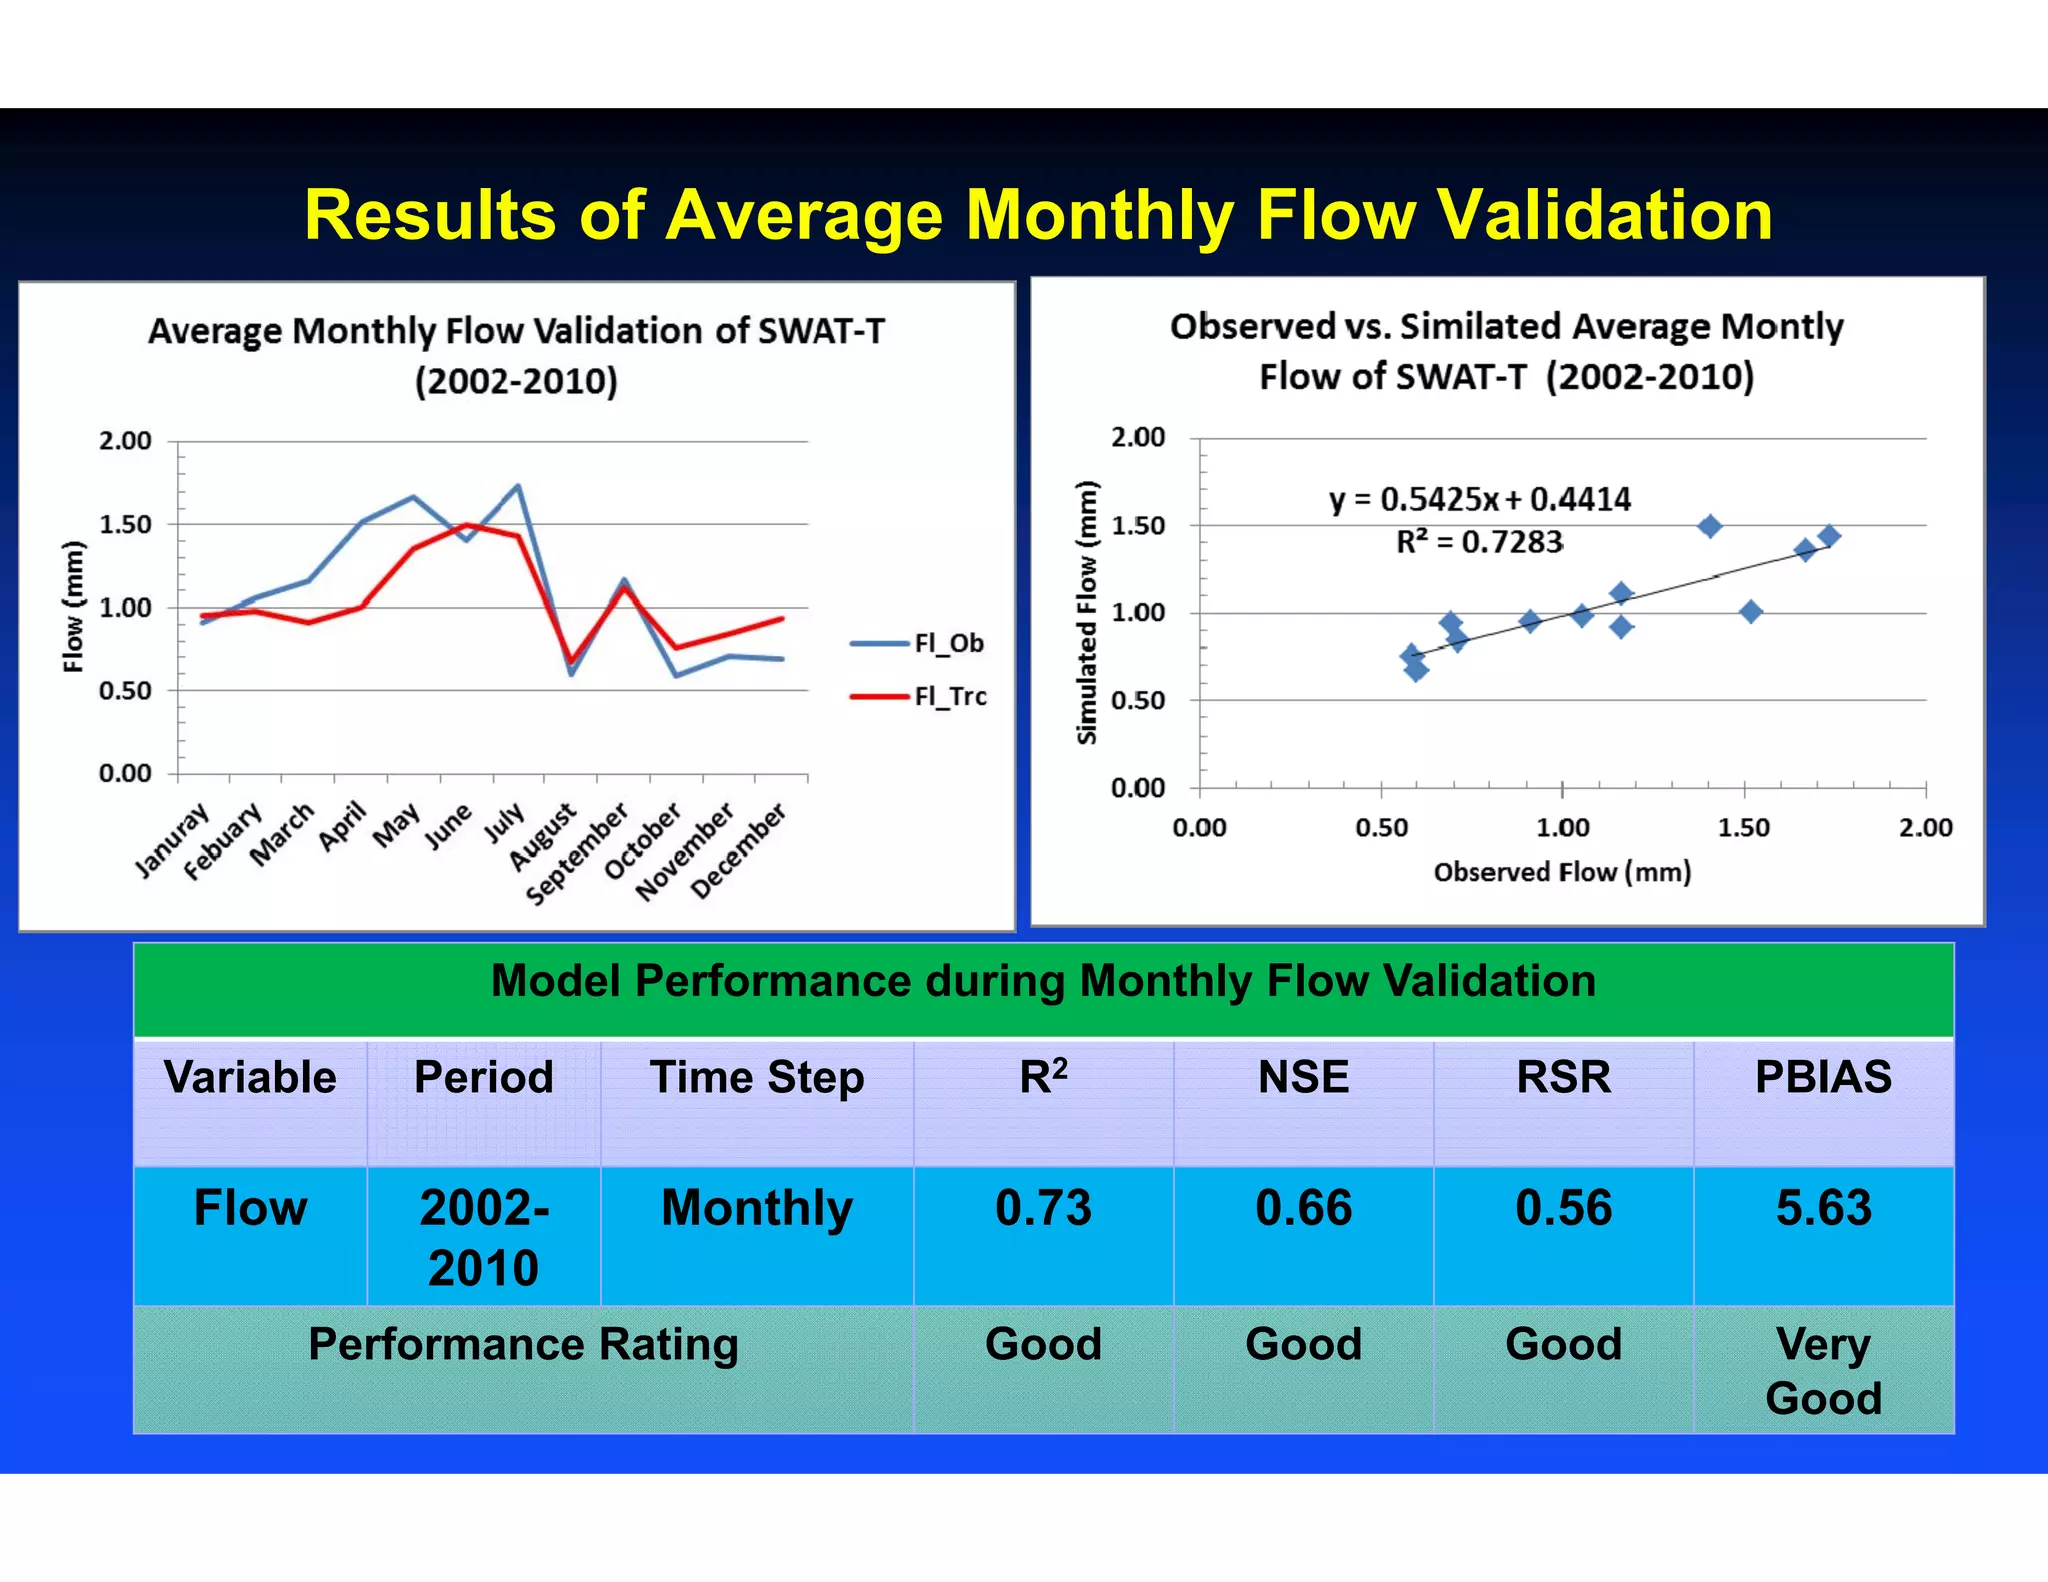
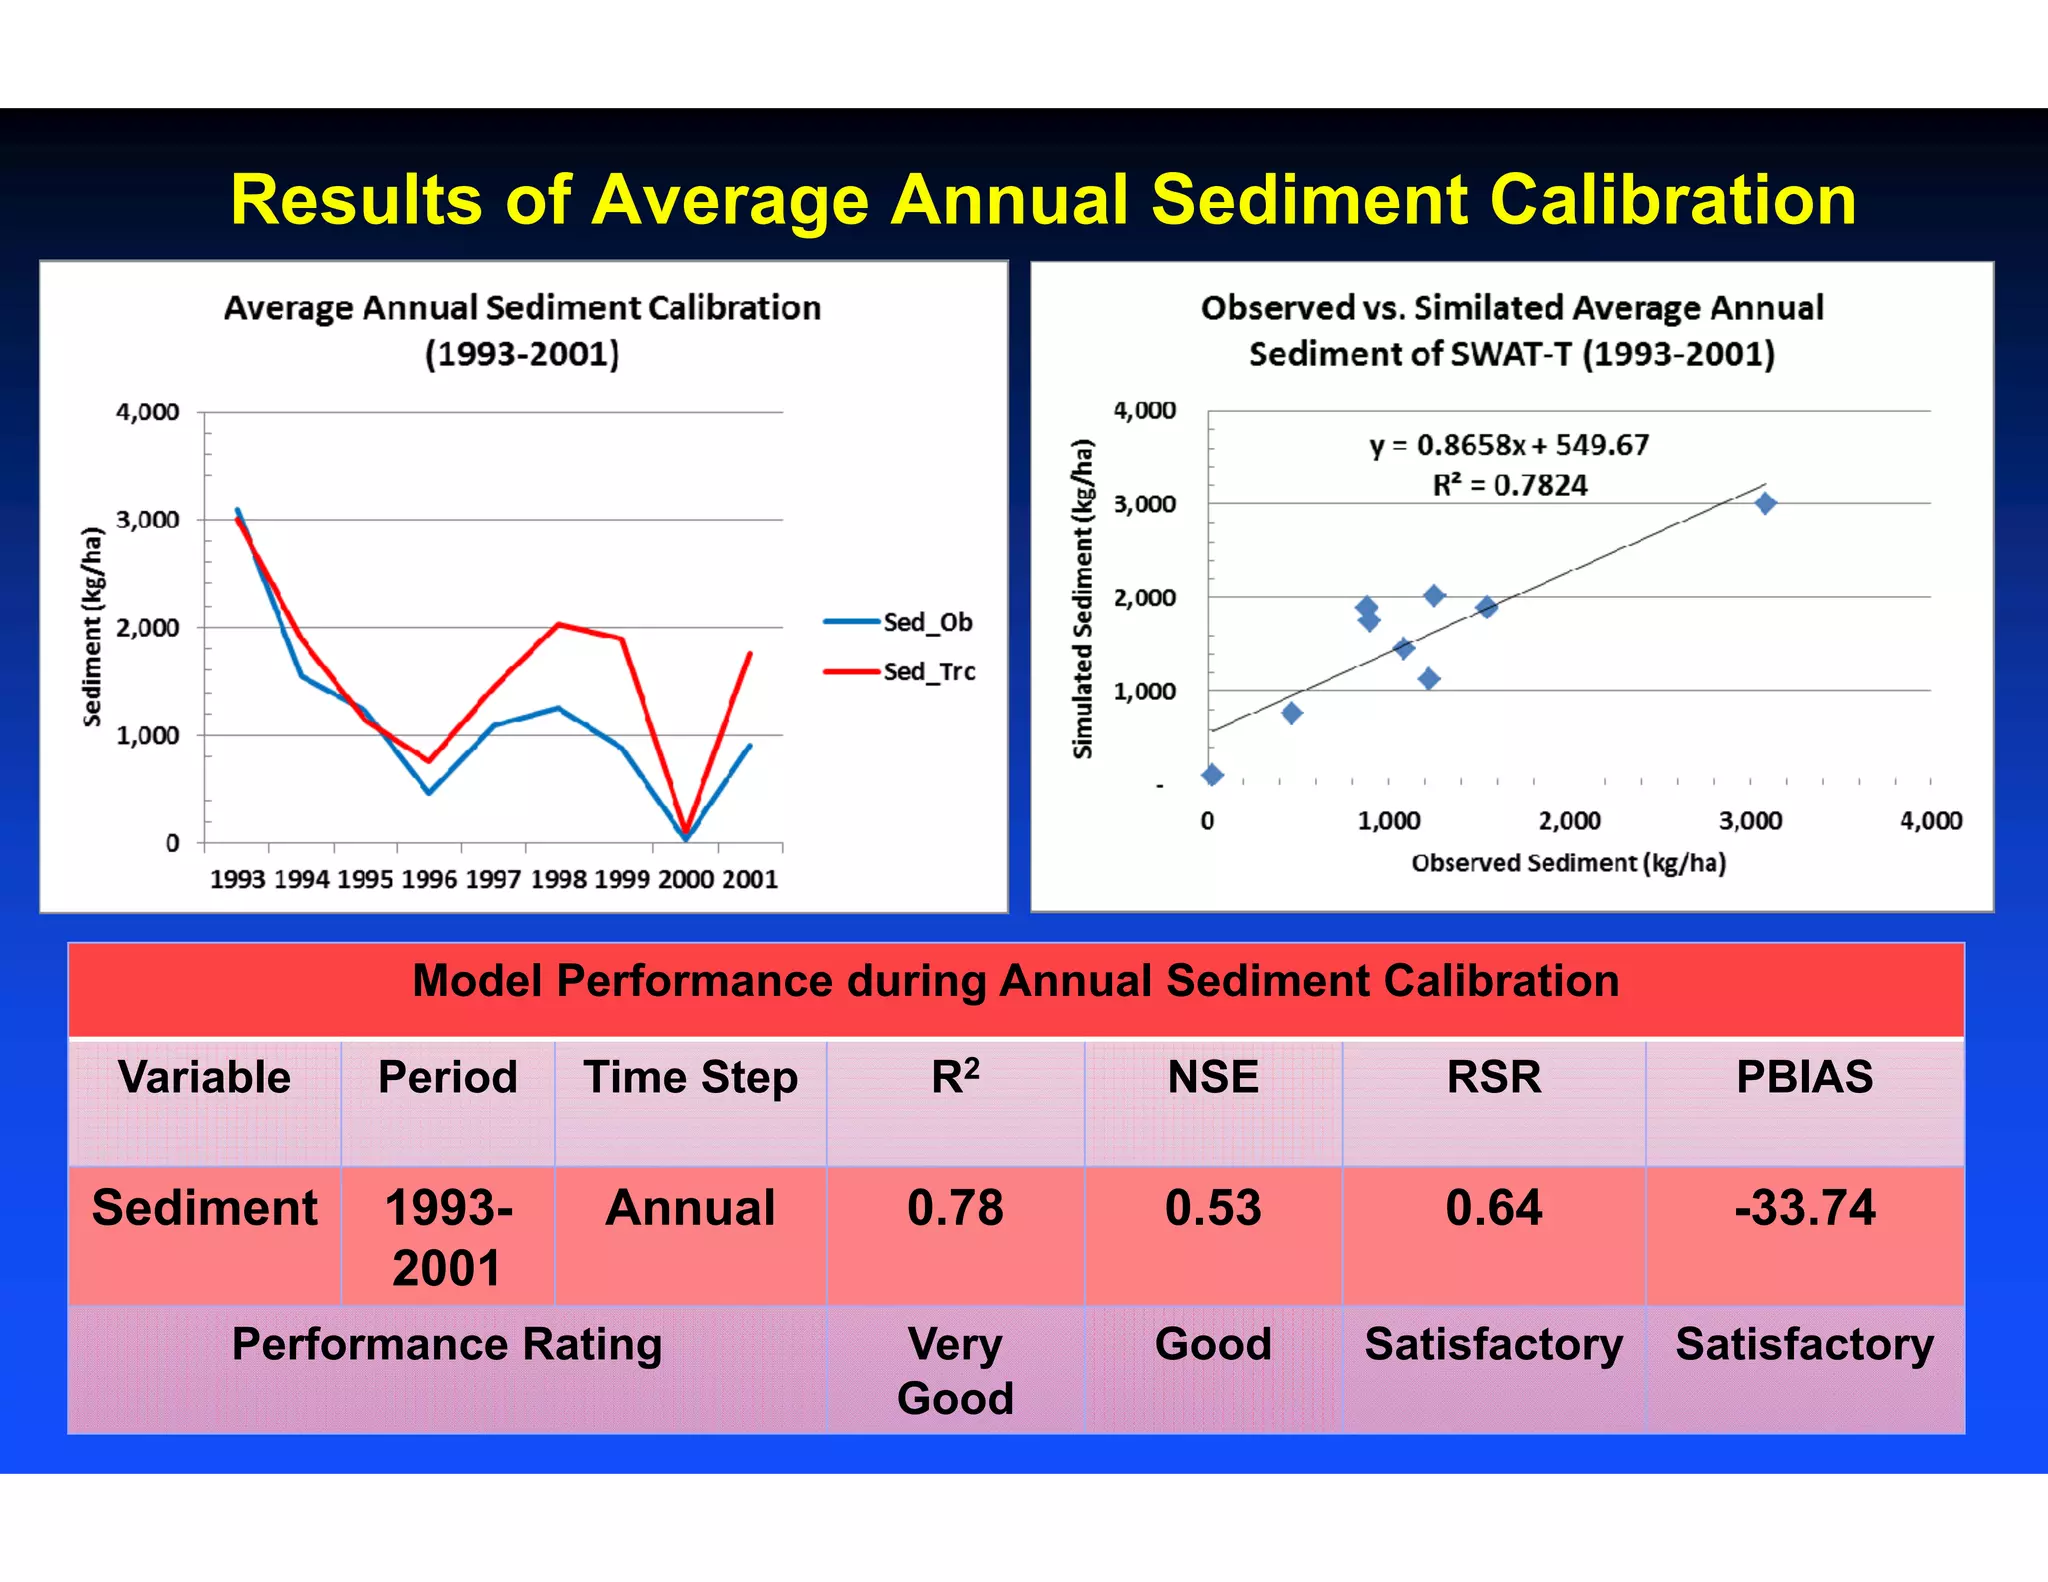
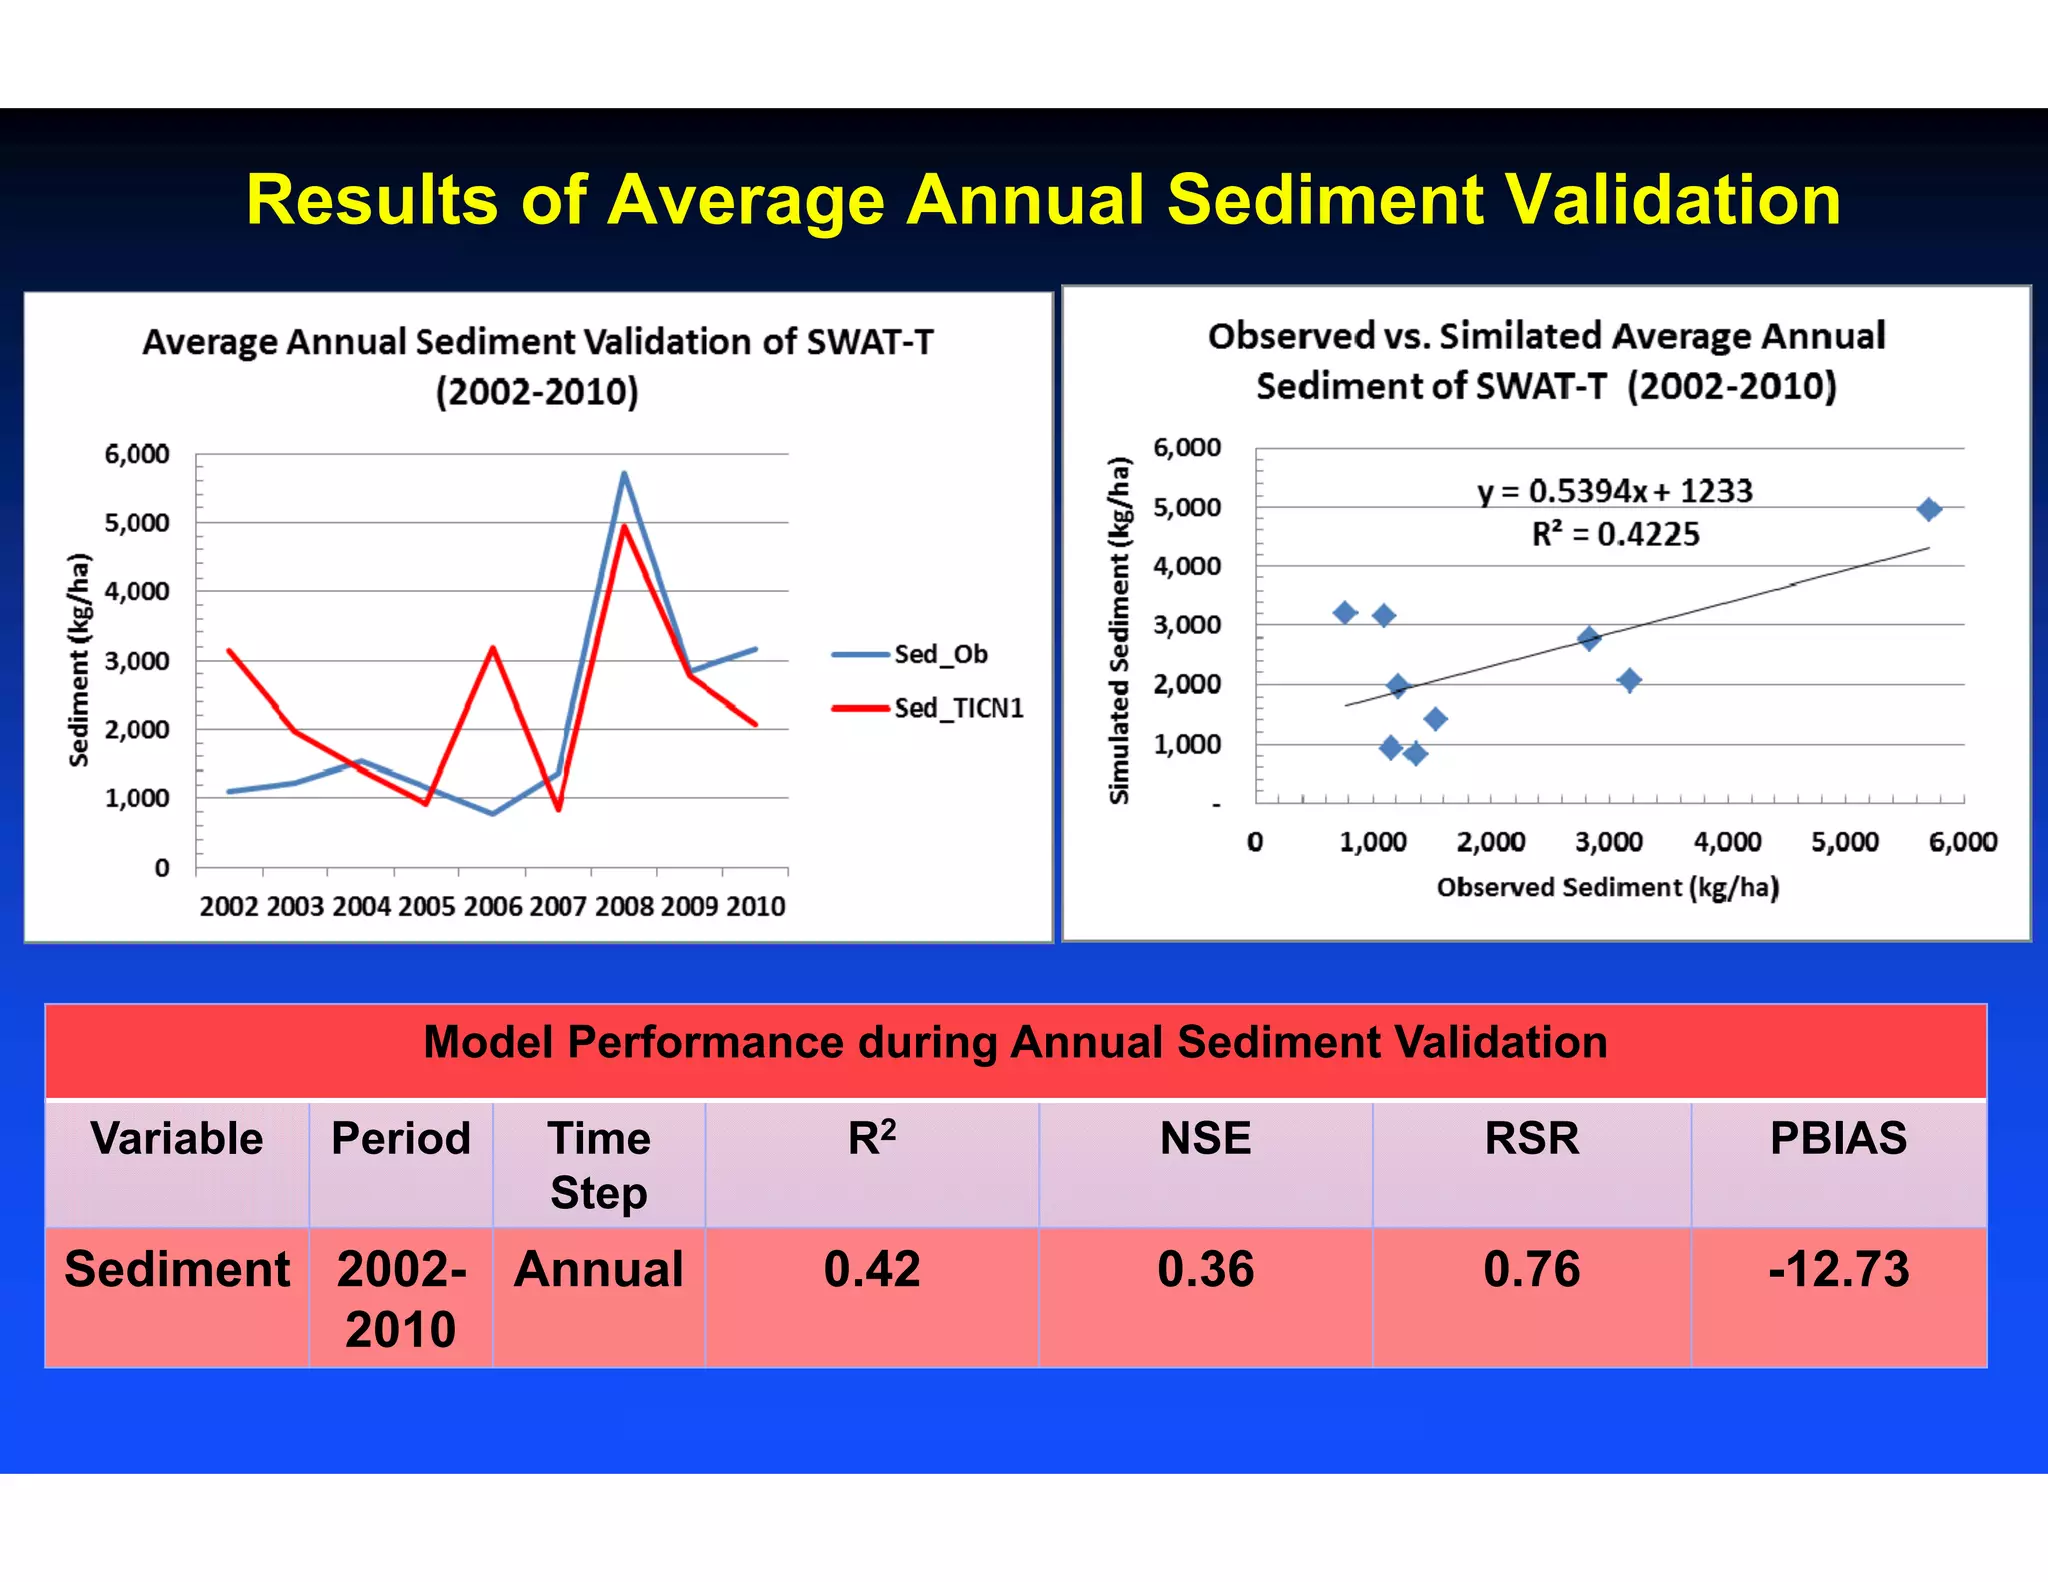
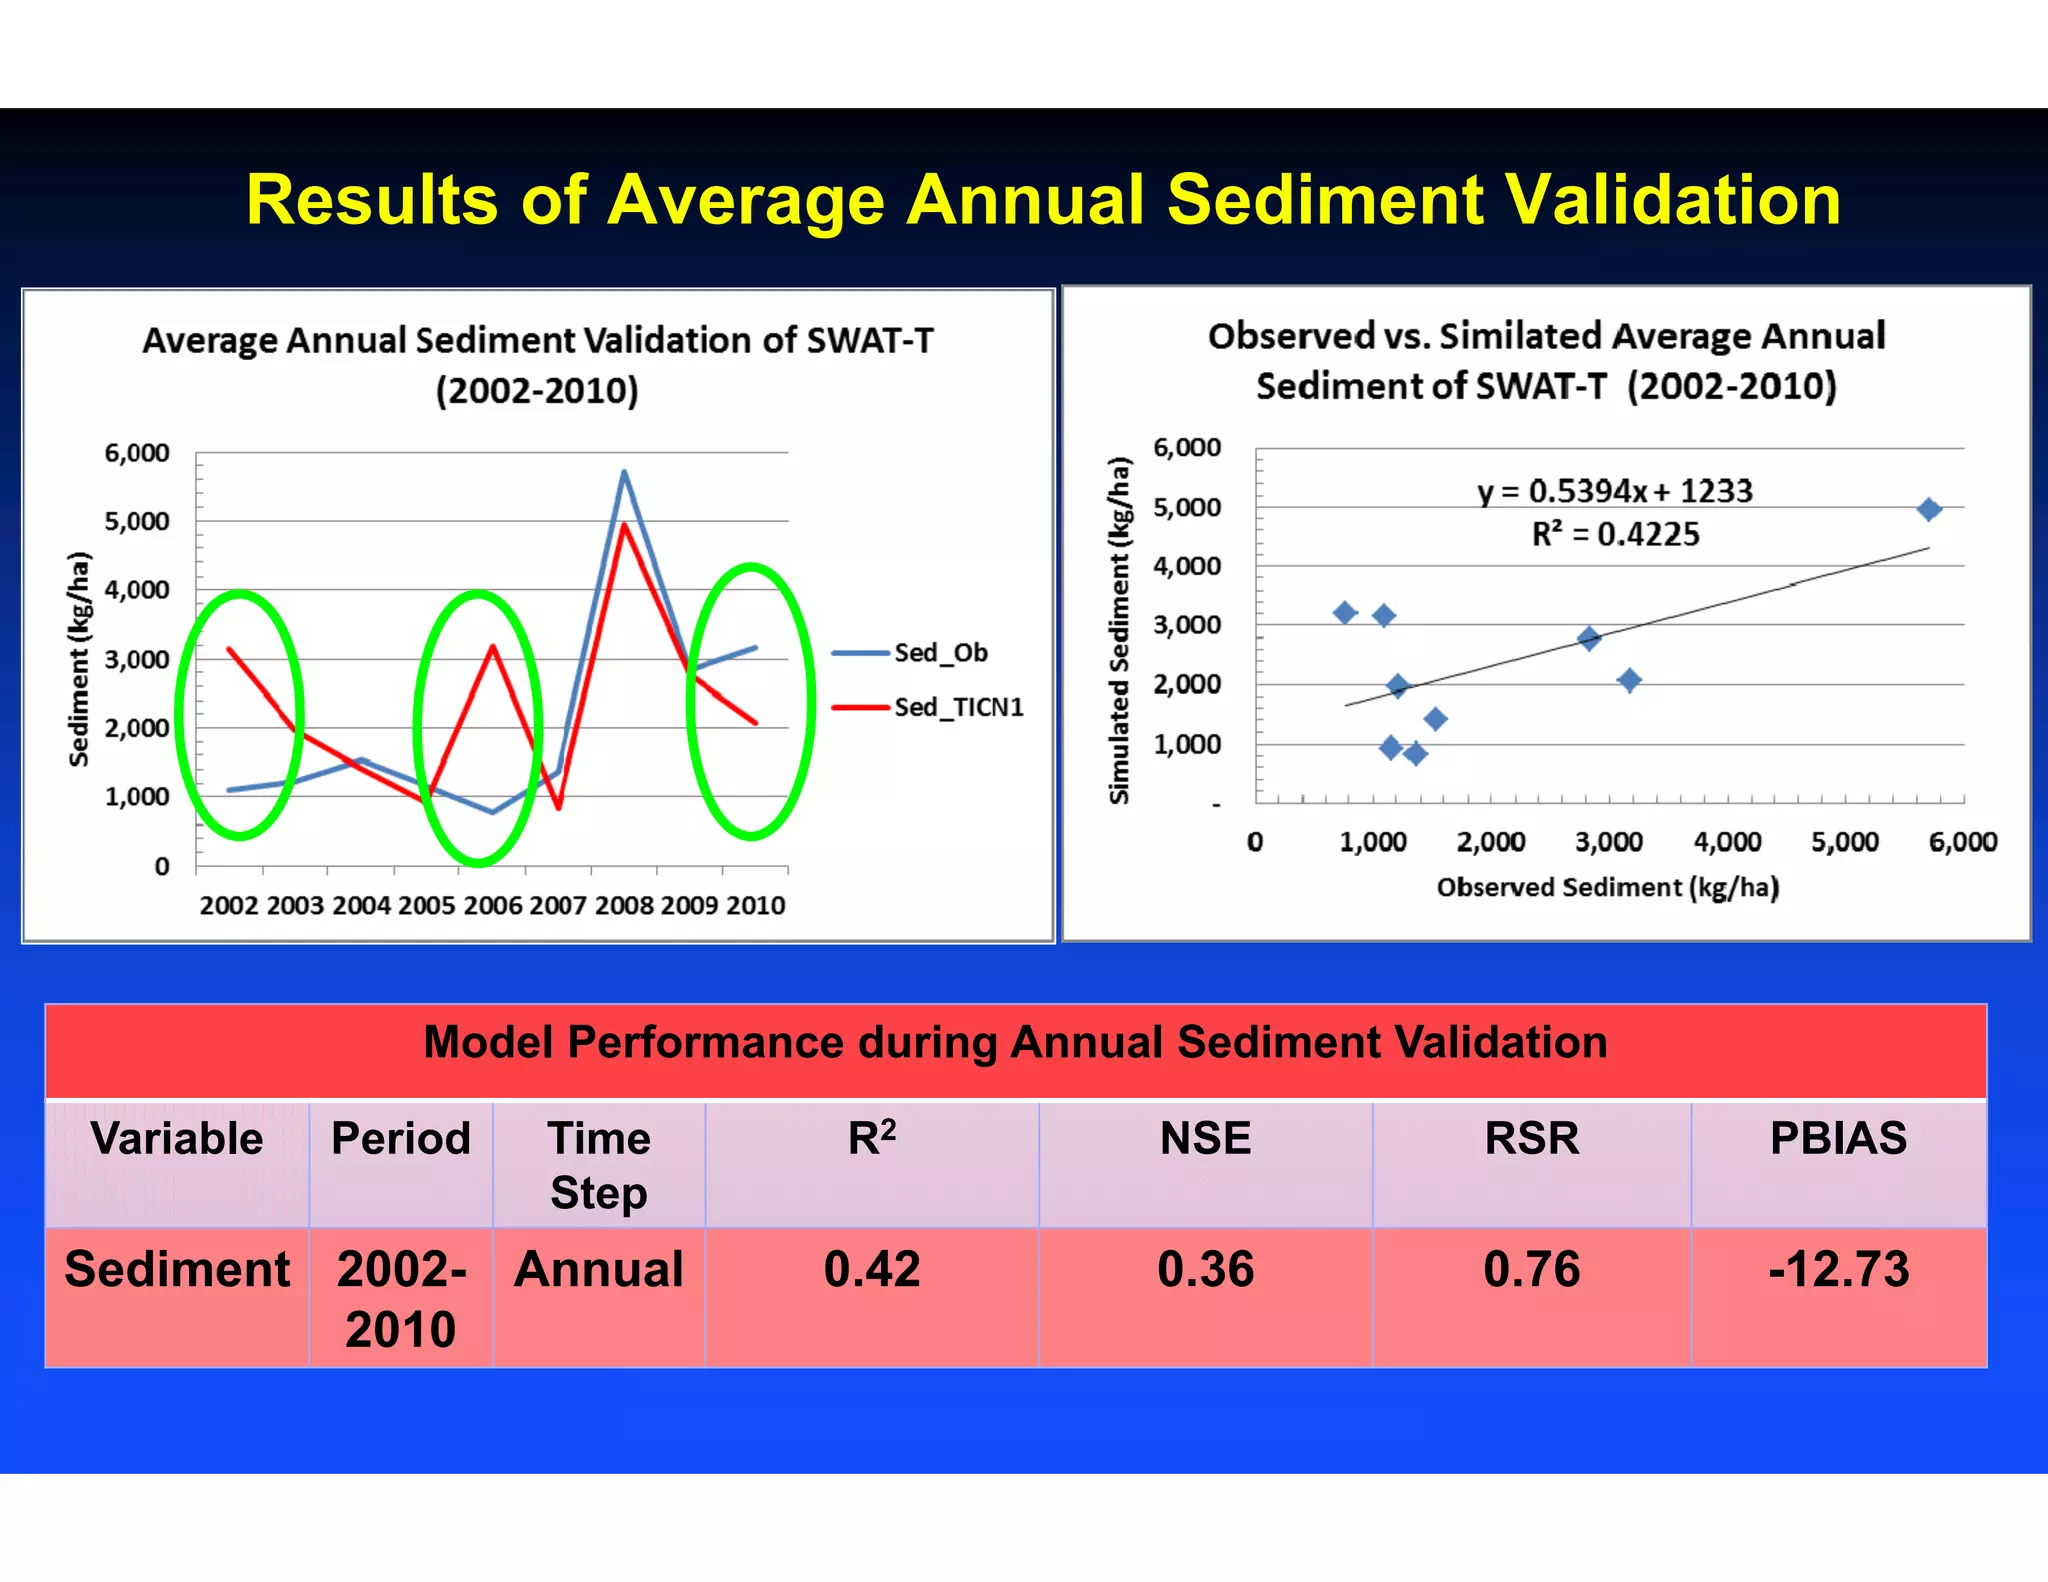
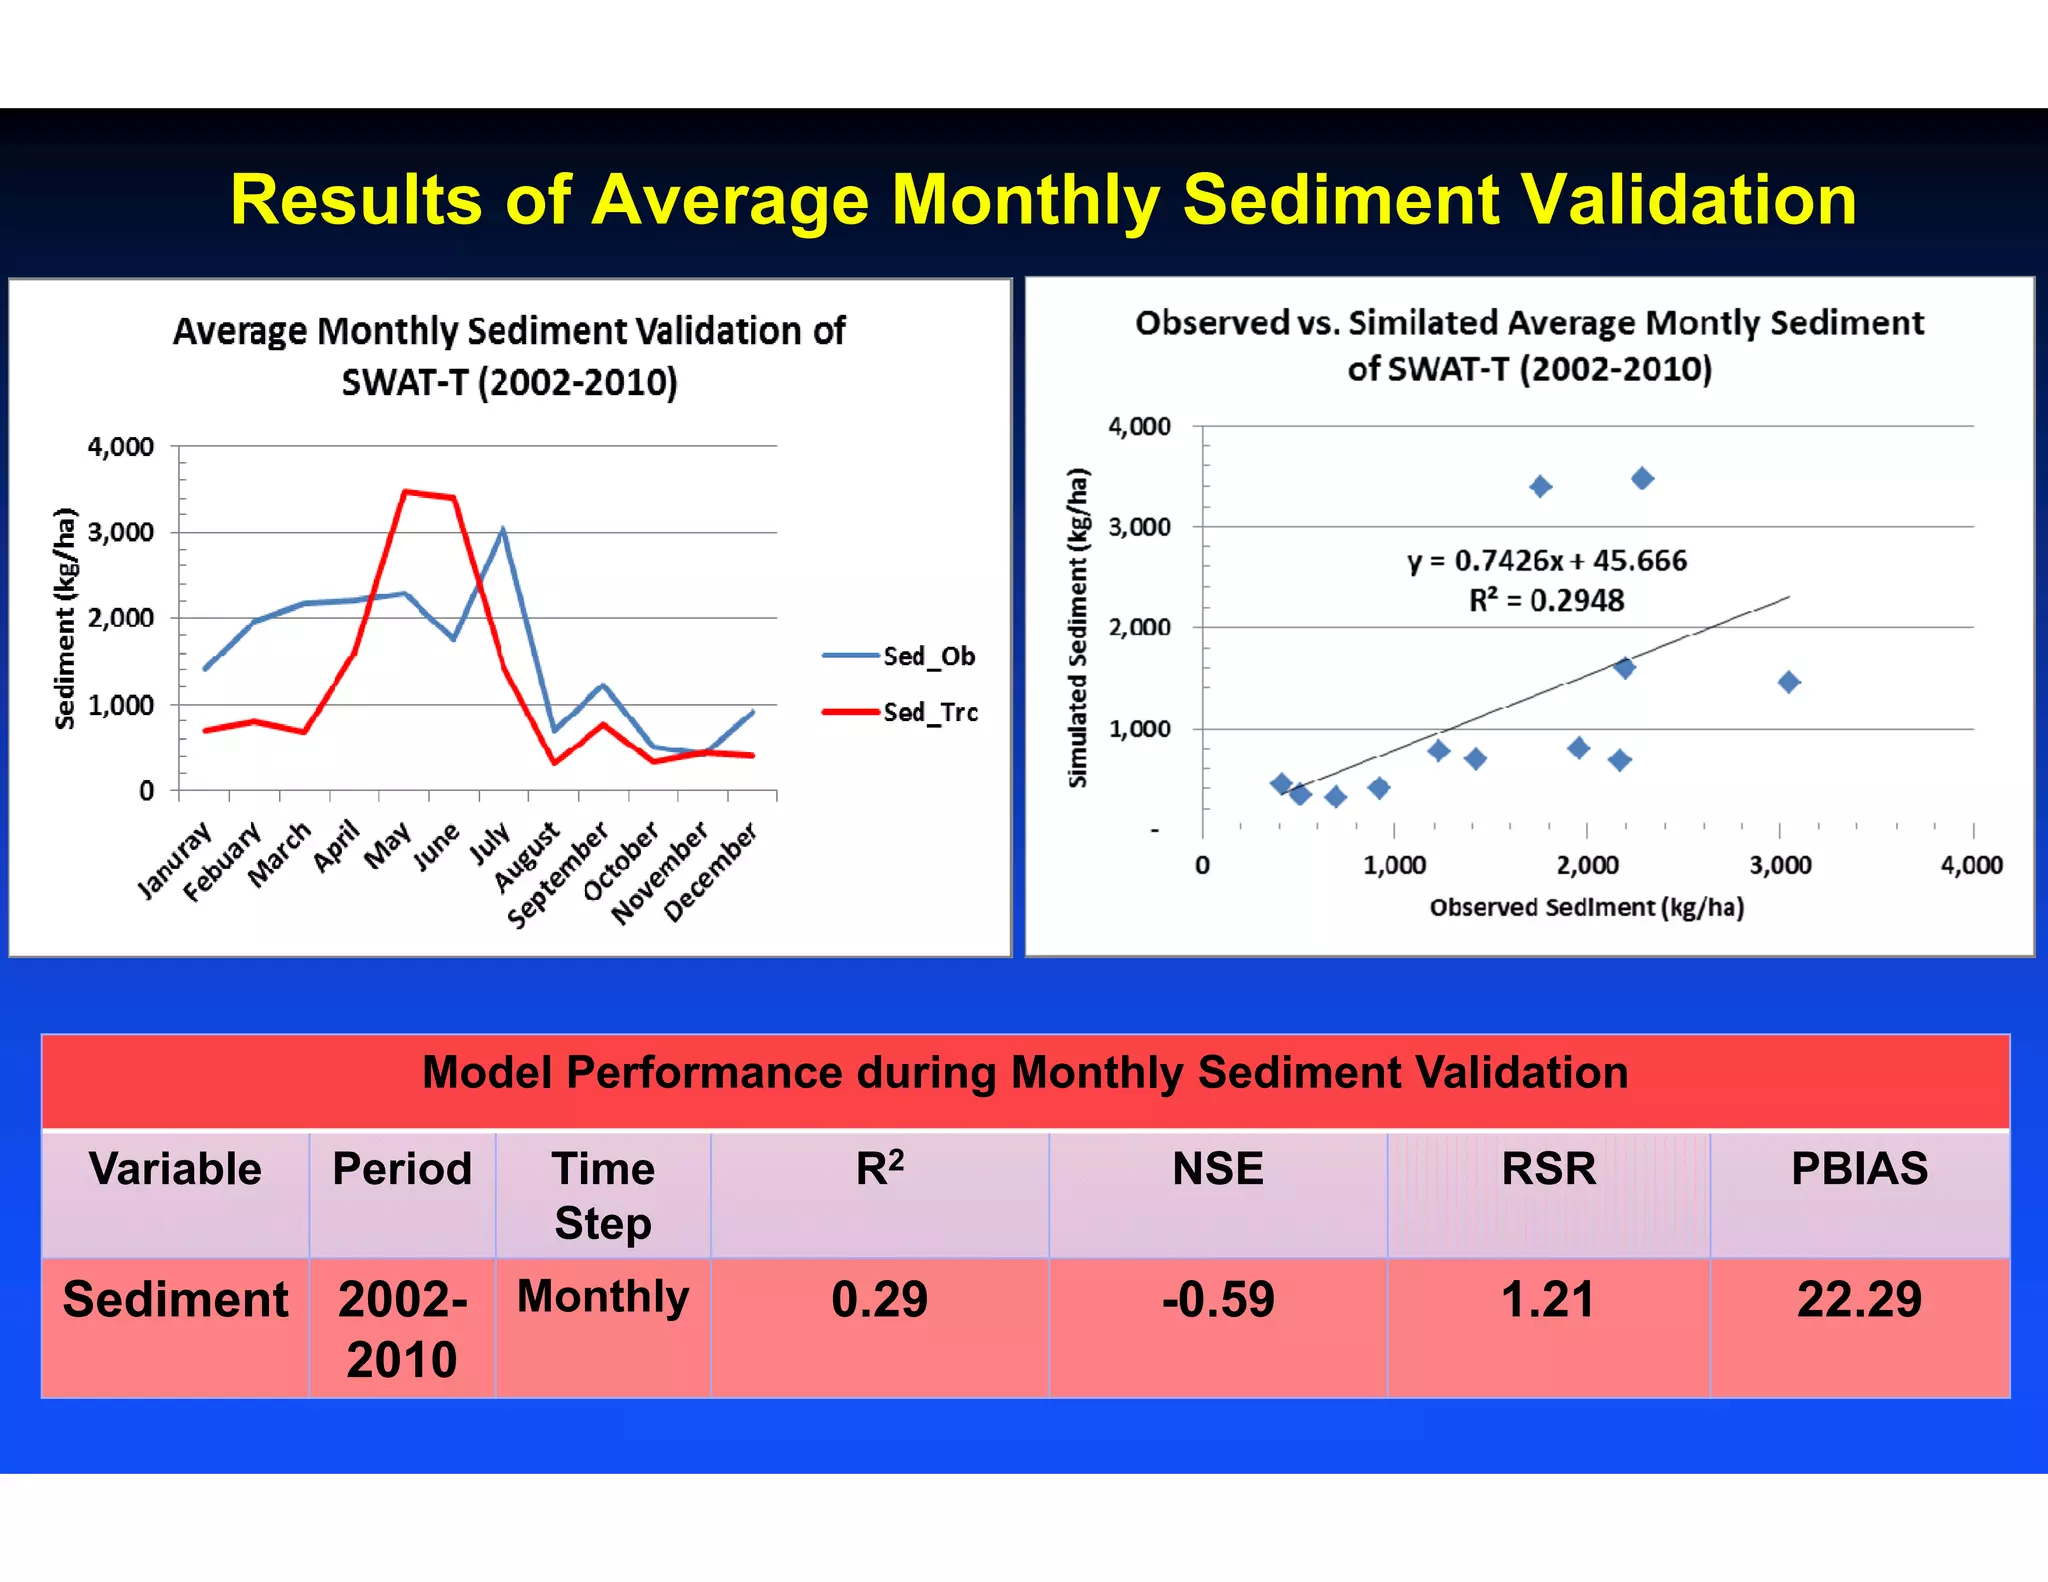
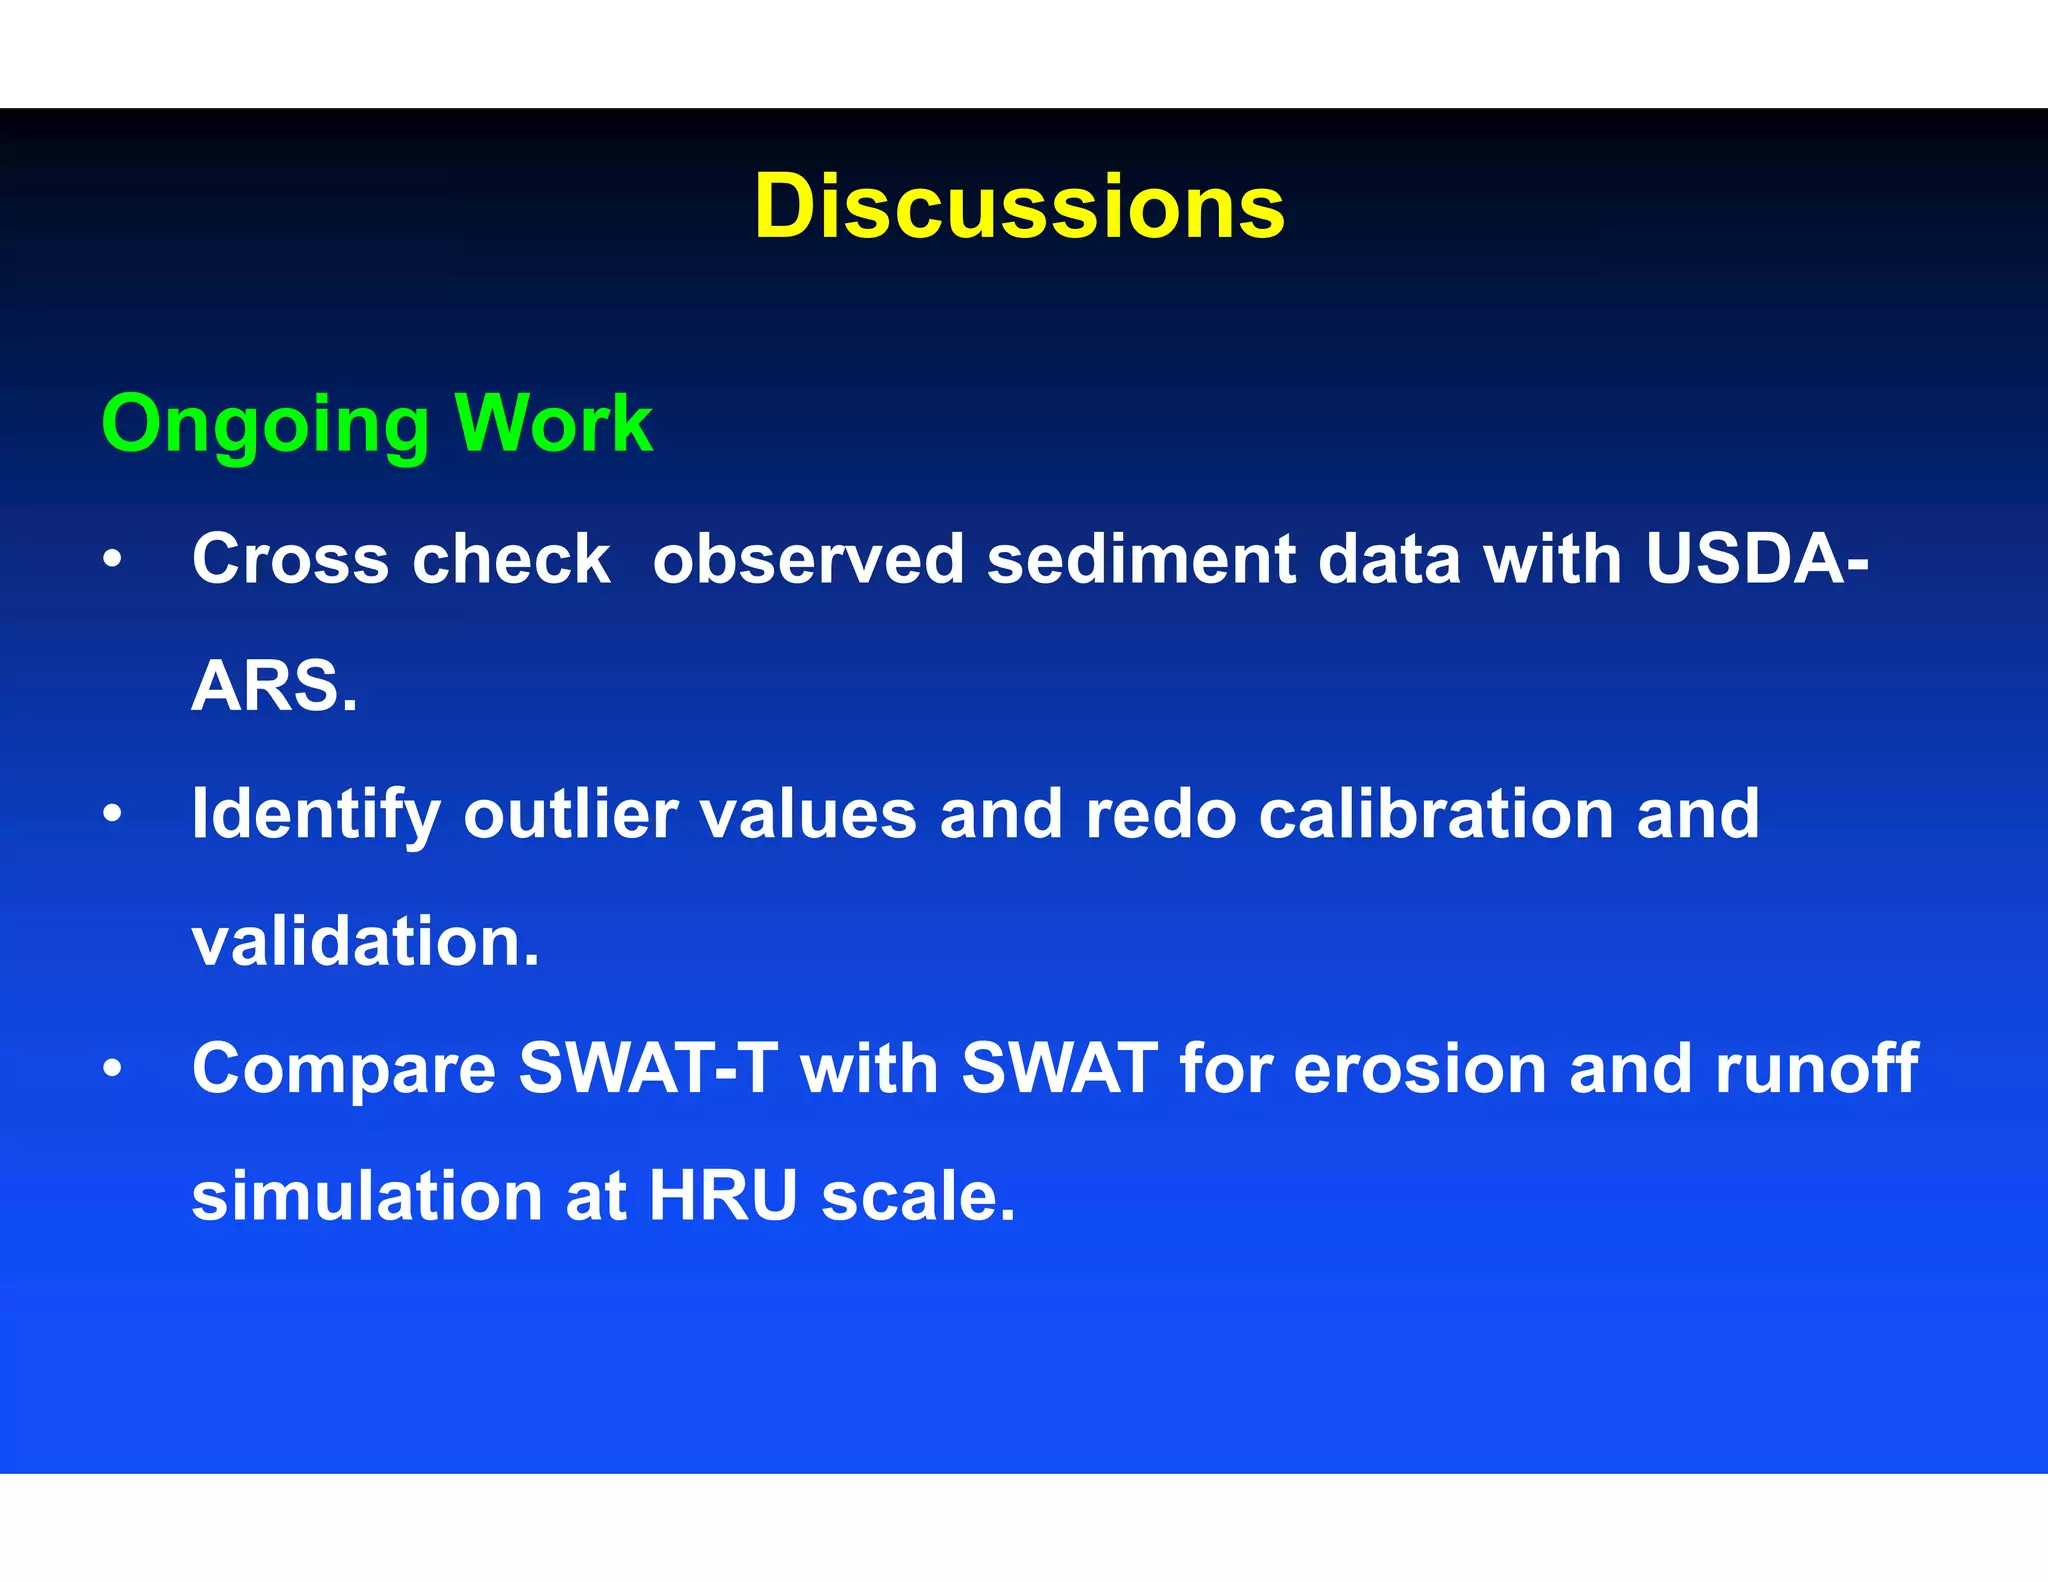
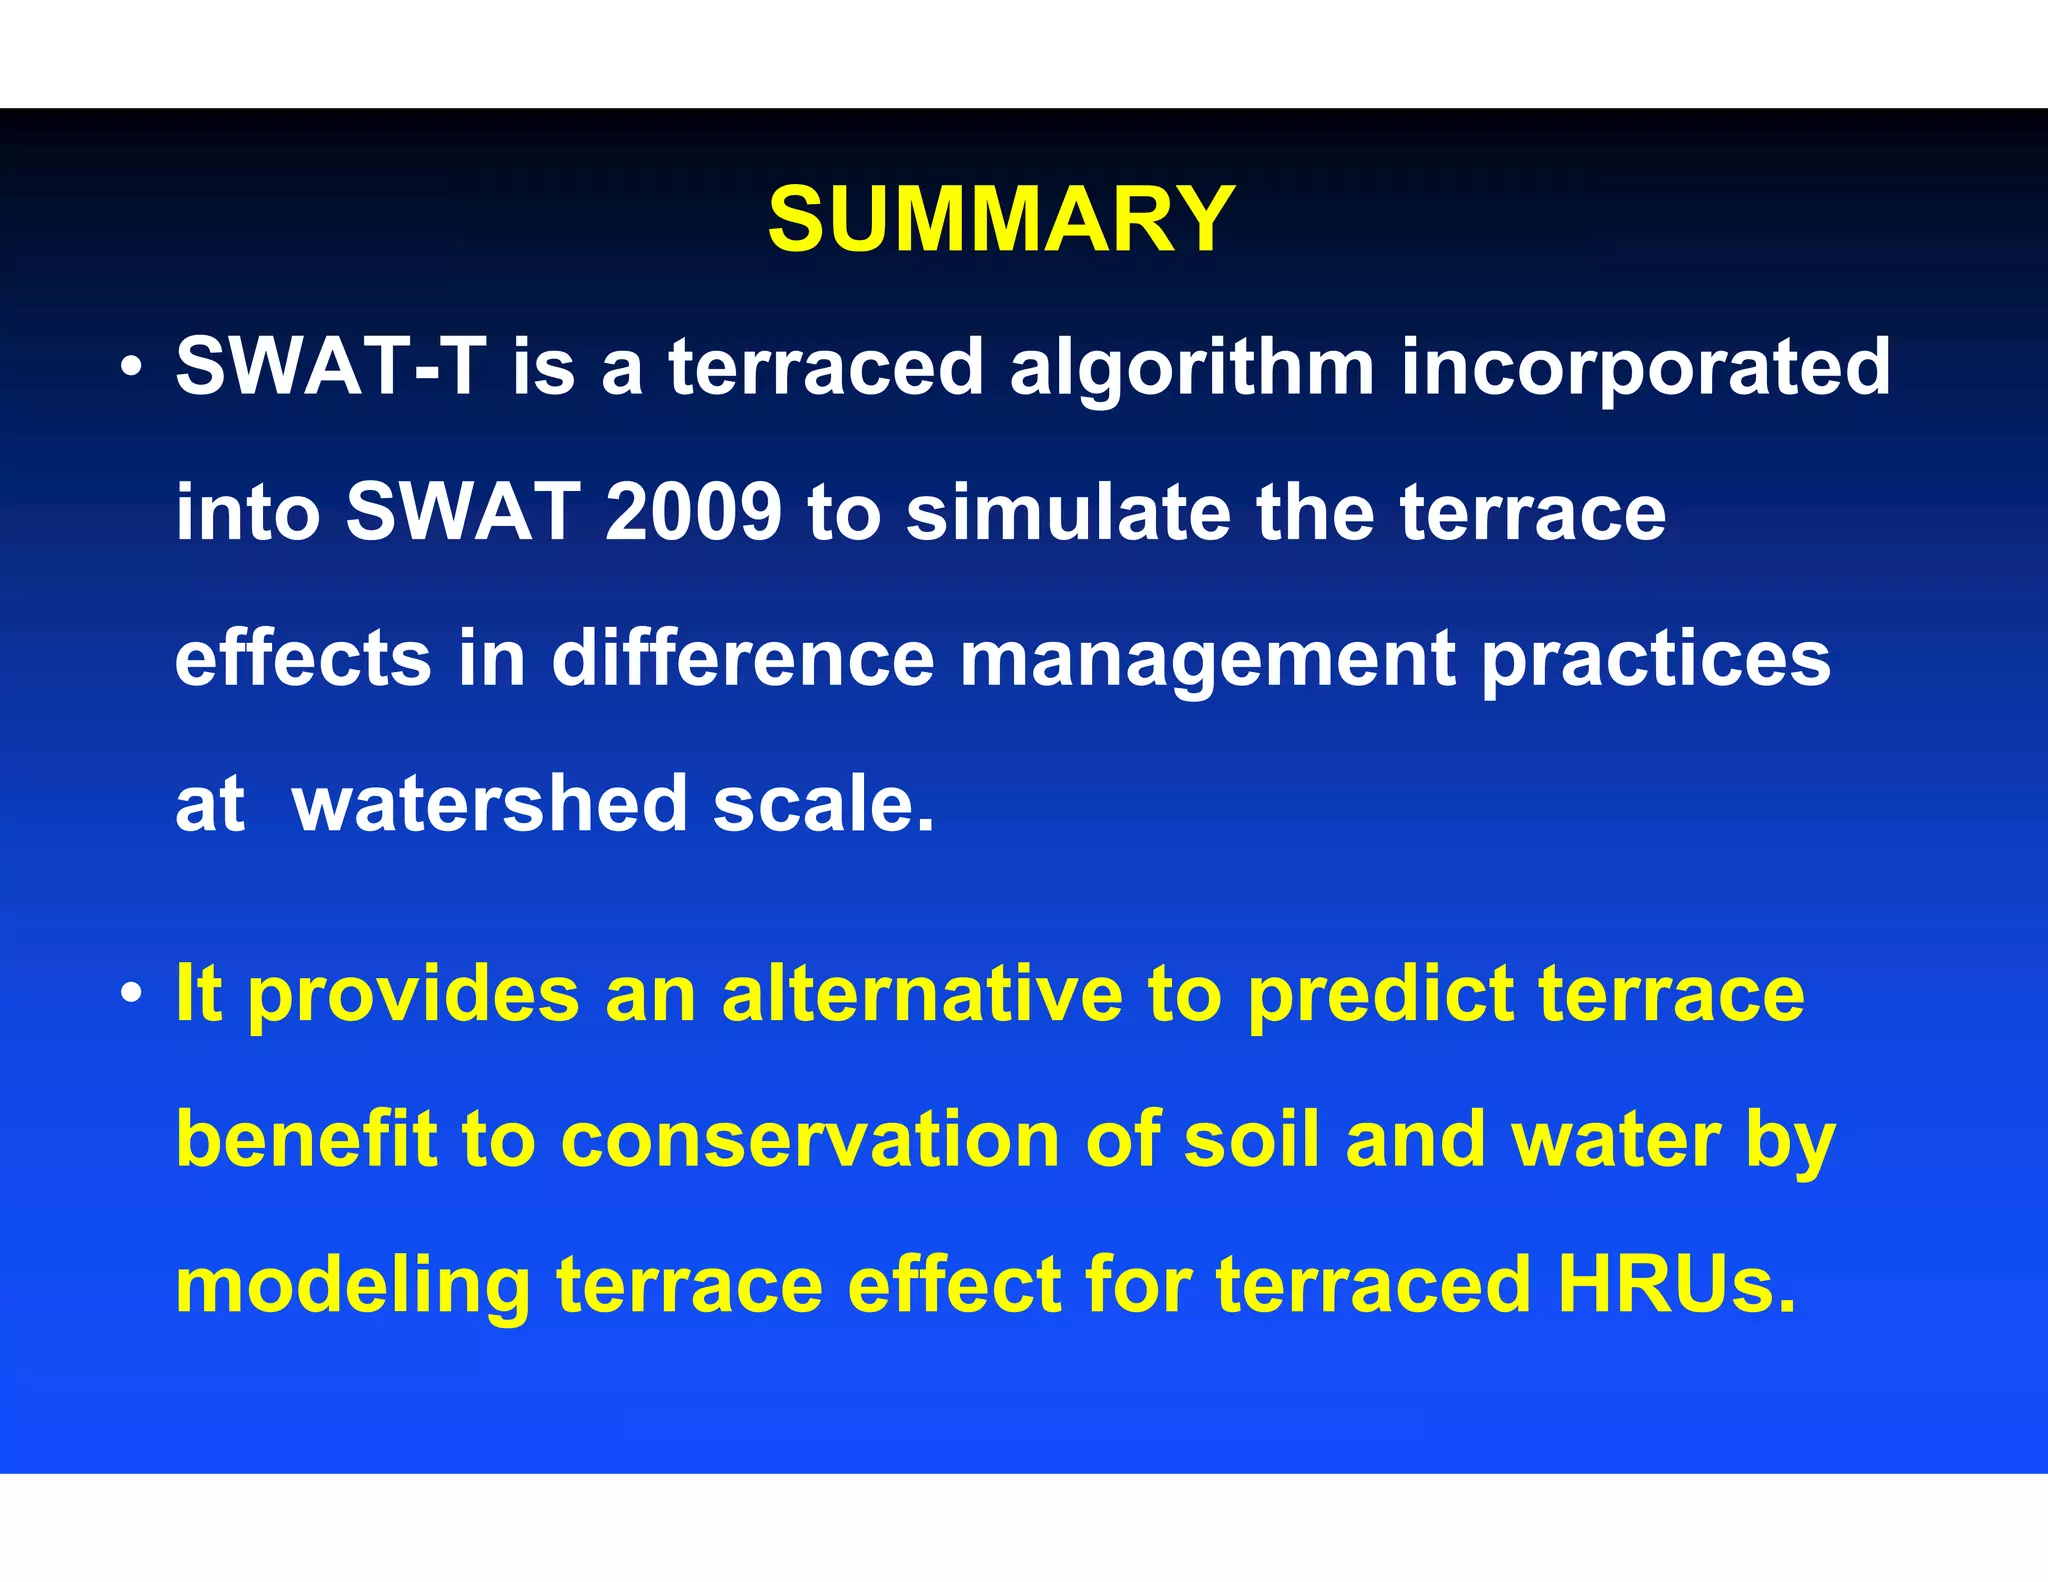
The document evaluates the SWAT-T model's performance in simulating erosion and runoff in the Goodwater Creek Experimental Watershed, emphasizing its effectiveness in modeling terraced fields. The model demonstrated good calibration and validation results for flow, though sediment simulation showed variable performance, highlighting the need for further research. Future work aims to compare SWAT-T with the original SWAT model for improved erosion and runoff simulations at the hydrologic response unit scale.