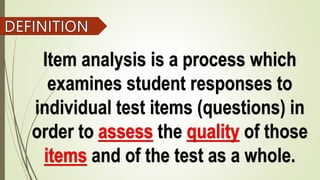
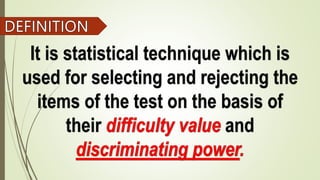
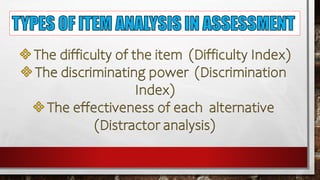
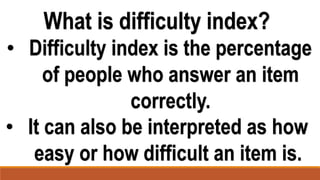
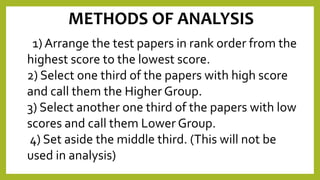
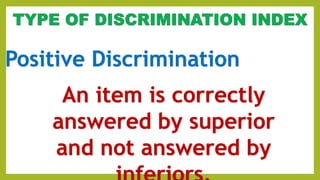
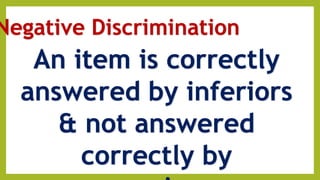
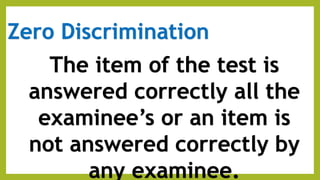
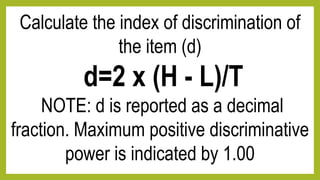
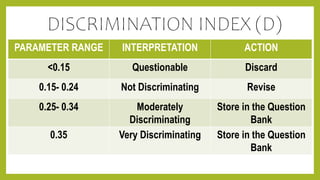
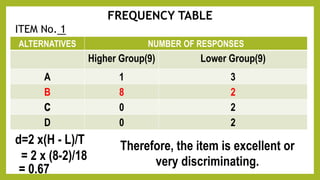
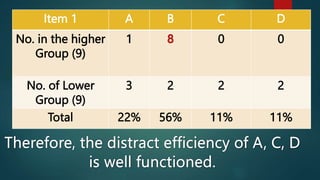
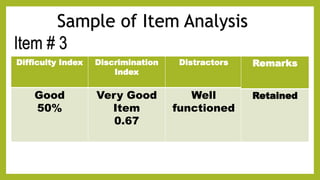
ITEM
ANALYSIS
Facilitator: Riza G. Tacan
Item analysis is a process which
examines student responses to
individual test items (questions) in
order to the of those
and of the test as a whole.
It is statistical technique which is
used for selecting and rejecting the
items of the test on the basis of
their and
 Item analysis information can tell us
– if an item (i.e. the question) was
– how well it between
on the test and
– whether of the
as intended.
 It aids in specific and
thus provides information for
 It provides for class discussion
of the test, e.g. easy item can be skipped over and
treated lightly, answers to difficult items can be
explained in detail and items be pointed out to the
students rather than defended as fair.
Advantages of IA
Item analysis is importance to evaluate the
of the items. It is especially
valuable in which will be used
again in later test, but it can also used to
in a
single test administration.
Advantages of IA
 It provides data for helping the
students to . The
frequency with which incorrect answer is
chosen reveals common errors and
misconception which provides a focus
for remedial work.
 It provides in skills which
to preparation of in future.
What is difficulty index?
• Difficulty index is the percentage
of people who answer an item
correctly.
• It can also be interpreted as how
easy or how difficult an item is.
METHODS OF ANALYSIS
1) Arrange the test papers in rank order from the
highest score to the lowest score.
2) Select one third of the papers with high score
and call them the Higher Group.
3) Select another one third of the papers with low
scores and call them Lower Group.
4) Set aside the middle third. (This will not be
used in analysis)
NOTE: P is usually expressed as
percent. The lower the
percentage figure, the more
difficult is the item.
PARAMETER RANGE INTERPRETATION ACTION
<30 % Difficult Discard
30%- 70% Good Store in the Question
Bank
MPS IN SCIENCE IN
GRADE 4
What is discrimination index?
• Discrimination index refers to the ability of
an item to differentiate among students on
the basis of how well they know the
material being tested.
• It is a basic measure of the validity of the
test.
Positive Discrimination
An item is correctly
answered by superior
and not answered by
Negative Discrimination
An item is correctly
answered by inferiors
& not answered
correctly by
Zero Discrimination
The item of the test is
answered correctly all the
examinee’s or an item is
not answered correctly by
any examinee.
Calculate the index of discrimination of
the item (d)
d=2 x (H - L)/T
NOTE: d is reported as a decimal
fraction. Maximum positive discriminative
power is indicated by 1.00
PARAMETER RANGE INTERPRETATION ACTION
<0.15 Questionable Discard
0.15- 0.24 Not Discriminating Revise
0.25- 0.34 Moderately
Discriminating
Store in the Question
Bank
0.35 Very Discriminating Store in the Question
Bank
FREQUENCY TABLE
ITEM No. 1
ALTERNATIVES NUMBER OF RESPONSES
Higher Group(9) Lower Group(9)
A 1 3
B 8 2
0 2
D 0 2
d=2 x(H - L)/T
= 2 x (8-2)/18
= 0.67
Therefore, the item is excellent or
very discriminating.
Distractor- term
used for incorrect
options in the
multiple type of
How the distracters
were able to function
effectively by drawing
the test takers away
from the correct
In general a good
distractor should
discriminate
between higher and
Note: Any distractor that has
been selected by less than 5%
of the pupils is considered to
be non-fuctional Distractor
(NF-D)
 These poor distractors
can be revised, replaced,
Item 1 A B C D
No. in the higher
Group (9)
1 0 0
No. of Lower
Group (9)
3 2 2 2
Total 22% 56% 11% 11%
Decision
Sample of Item Analysis
Difficulty Index Discrimination
Index
Distractors
Good
50%
Very Good
Item
0.67
Well
functioned
Item # 3
Remarks
Retained
WORKSHOP
Form 2
Form 1
ITEM ANALYSIS.pptx
ITEM ANALYSIS.pptx
ITEM ANALYSIS.pptx
ITEM ANALYSIS.pptx

ITEM ANALYSIS.pptx

  • 1.
  • 4.
    Item analysis isa process which examines student responses to individual test items (questions) in order to the of those and of the test as a whole.
  • 5.
    It is statisticaltechnique which is used for selecting and rejecting the items of the test on the basis of their and
  • 6.
     Item analysisinformation can tell us – if an item (i.e. the question) was – how well it between on the test and – whether of the as intended.
  • 7.
     It aidsin specific and thus provides information for  It provides for class discussion of the test, e.g. easy item can be skipped over and treated lightly, answers to difficult items can be explained in detail and items be pointed out to the students rather than defended as fair. Advantages of IA
  • 8.
    Item analysis isimportance to evaluate the of the items. It is especially valuable in which will be used again in later test, but it can also used to in a single test administration. Advantages of IA
  • 9.
     It providesdata for helping the students to . The frequency with which incorrect answer is chosen reveals common errors and misconception which provides a focus for remedial work.  It provides in skills which to preparation of in future.
  • 12.
    What is difficultyindex? • Difficulty index is the percentage of people who answer an item correctly. • It can also be interpreted as how easy or how difficult an item is.
  • 13.
    METHODS OF ANALYSIS 1)Arrange the test papers in rank order from the highest score to the lowest score. 2) Select one third of the papers with high score and call them the Higher Group. 3) Select another one third of the papers with low scores and call them Lower Group. 4) Set aside the middle third. (This will not be used in analysis)
  • 14.
    NOTE: P isusually expressed as percent. The lower the percentage figure, the more difficult is the item.
  • 15.
    PARAMETER RANGE INTERPRETATIONACTION <30 % Difficult Discard 30%- 70% Good Store in the Question Bank
  • 16.
    MPS IN SCIENCEIN GRADE 4
  • 18.
    What is discriminationindex? • Discrimination index refers to the ability of an item to differentiate among students on the basis of how well they know the material being tested. • It is a basic measure of the validity of the test.
  • 19.
    Positive Discrimination An itemis correctly answered by superior and not answered by
  • 20.
    Negative Discrimination An itemis correctly answered by inferiors & not answered correctly by
  • 21.
    Zero Discrimination The itemof the test is answered correctly all the examinee’s or an item is not answered correctly by any examinee.
  • 22.
    Calculate the indexof discrimination of the item (d) d=2 x (H - L)/T NOTE: d is reported as a decimal fraction. Maximum positive discriminative power is indicated by 1.00
  • 23.
    PARAMETER RANGE INTERPRETATIONACTION <0.15 Questionable Discard 0.15- 0.24 Not Discriminating Revise 0.25- 0.34 Moderately Discriminating Store in the Question Bank 0.35 Very Discriminating Store in the Question Bank
  • 24.
    FREQUENCY TABLE ITEM No.1 ALTERNATIVES NUMBER OF RESPONSES Higher Group(9) Lower Group(9) A 1 3 B 8 2 0 2 D 0 2 d=2 x(H - L)/T = 2 x (8-2)/18 = 0.67 Therefore, the item is excellent or very discriminating.
  • 26.
    Distractor- term used forincorrect options in the multiple type of
  • 27.
    How the distracters wereable to function effectively by drawing the test takers away from the correct
  • 28.
    In general agood distractor should discriminate between higher and
  • 29.
    Note: Any distractorthat has been selected by less than 5% of the pupils is considered to be non-fuctional Distractor (NF-D)  These poor distractors can be revised, replaced,
  • 30.
    Item 1 AB C D No. in the higher Group (9) 1 0 0 No. of Lower Group (9) 3 2 2 2 Total 22% 56% 11% 11%
  • 31.
  • 32.
    Sample of ItemAnalysis Difficulty Index Discrimination Index Distractors Good 50% Very Good Item 0.67 Well functioned Item # 3 Remarks Retained
  • 33.