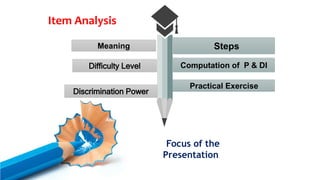
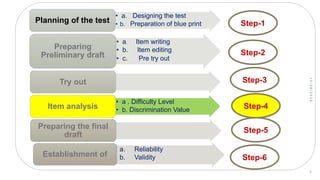
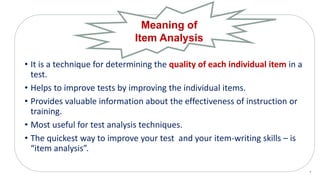
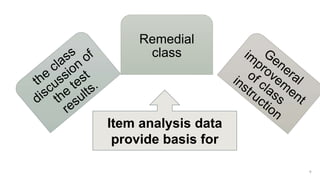
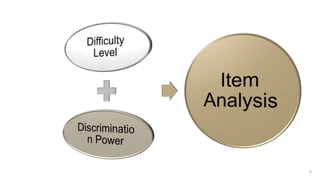
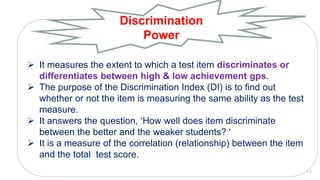
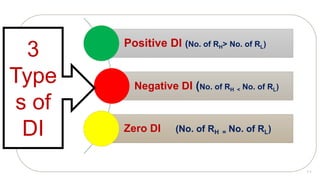
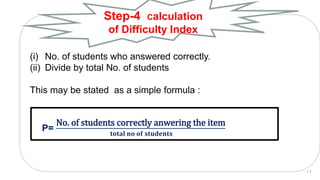
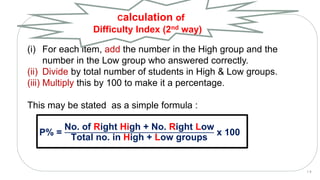
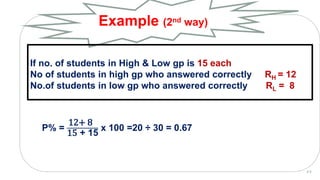
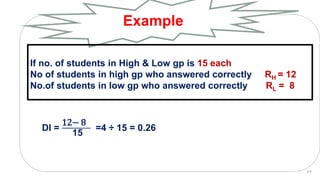
ITEM
ANALYSIS
Prof Amita Pandey Bhardwaj
Project Head-TLC
Under PMMMNMTT Scheme , MoE
Department Of Education
SLBSNSU ( Central University),N.Delhi
School of Education
GNDU, Amritsar
2 Weeks
Workshop
Dated-
28th Oct.,2020
On
Research Tools Development
Organized
By
Computation of P & DI
Practical Exercise
Item Analysis
Meaning
Difficulty Level
Add Contents Title
Add Contents Title
Focus of the
Presentation.
Steps
Discrimination Power
• a. Designing the test
• b. Preparation of blue printPlanning of the test
• a. Item writing
• b. Item editing
• c. Pre try out
Preparing
Preliminary draft
Try out
• a . Difficulty Level
• b. Discrimination ValueItem analysis
Preparing the final
draft
• a. Reliability
• b. ValidityEstablishment of
Step-1
Step-2
Step-3
Step-4
Step-5
Step-6
10/29/2020
3
• It is a technique for determining the quality of each individual item in a
test.
• Helps to improve tests by improving the individual items.
• Provides valuable information about the effectiveness of instruction or
training.
• Most useful for test analysis techniques.
• The quickest way to improve your test and your item-writing skills – is
“item analysis”.
Meaning of
Item Analysis
4
Which item
to keep in
the test?
Which item
to modify?
Which item
to
eliminate?Item
Analysi
s
5
Remedial
class
6
Item analysis data
provide basis for
7
Quantitative IA-
A numerical method for
analyzing test items
employing student
response alternatives or
options.
Qualitative IA –
A non-numerical method
for analyzing test items for
test objectives , content
validity& technical item
quality.
8
• Also called Facility Index.
• It is a proportion(p) or %tage of test takers who answer the item
correctly.
• It is an estimate (based on the high and low groups) of the percentage
of the entire class who answered the item right.
• The purpose of the Difficulty/Facility Index (FI) is to know ‘How difficult
or easy was the item?’
Difficulty
Level
9
 It measures the extent to which a test item discriminates or
differentiates between high & low achievement gps.
 The purpose of the Discrimination Index (DI) is to find out
whether or not the item is measuring the same ability as the test
measure.
 It answers the question, ‘How well does item discriminate
between the better and the weaker students? ‘
 It is a measure of the correlation (relationship) between the item
and the total test score.
Discrimination
Power
1 0
1 1
Positive DI (No. of RH> No. of RL)
Negative DI (No. of RH < No. of RL)
Zero DI (No. of RH = No. of RL)
3
Type
s of
DI
Steps
for
Item Analysis
1 2
Arrange all the answers sheets in
descending or ascending order on the
basis of scores.
Step -1
1 3
Divide arranged answer sheets in two groups.
Common approach followed:
 Select top & bottom 27% of test takers in terms of their overall
performance on the test and exclude the middle(Kelly 1939).
 OR
 Some assessment experts have suggested-Top & bottom 25%
or 33% or 50%.
Step -2
1 4
ITEM NO. WISE STUDENT RESPONSE SHEET
Item No ->
Student
No.
1 2 3 4 5
Total
Score
Group
1 P P P P P 5
High
Scorer
Group
(50%)
2 P P P O P 4
3 P P P O P 4
4 P P P O P 4
5 P P P O O 3
6 P O P P O 3
Low
Scorer
Group
(50%)
7 P O O P O 2
8 P O O P O 2
9 O O O O P 1
10 O O O O O 0
 Calculate 27% of the number of answer sheets you have
retained (Extreme group number).
 Then take out the top 27% of the answer sheets in your pile,
and the bottom 27%.
 Put them in two separate piles.
 The pile (Extreme group) from the top is called the high group,
and the other pile (lower Extreme group) is called the low
group.
Step-3
1 6
(i) No. of students who answered correctly.
(ii) Divide by total No. of students
This may be stated as a simple formula :
P=
No. of students correctly anwering the item
𝐭𝐨𝐭𝐚𝐥 𝐧𝐨 𝐨𝐟 𝐬𝐭𝐮𝐝𝐞𝐧𝐭𝐬
Step-4 Calculation
of Difficulty Index
1 7
 In a class of 30 students ,if 20 students get the answer correct &
10 incorrect the item difficulty will be
P= 20 ÷ 30 = 0 .67
Example
1 8
(i) For each item, add the number in the High group and the
number in the Low group who answered correctly.
(ii) Divide by total number of students in High & Low groups.
(iii) Multiply this by 100 to make it a percentage.
This may be stated as a simple formula :
P% =
No. of Right High + No. Right Low
Total no. in High + Low groups
x 100
Calculation of
Difficulty Index (2nd way)
1 9
P% =
12+ 8
15 + 15
x 100 =20 ÷ 30 = 0.67
Example (2nd way)
2 0
If no. of students in High & Low gp is 15 each
No of students in high gp who answered correctly RH = 12
No.of students in low gp who answered correctly RL = 8
(i) For each item, find proportion of Right high gp ( PH).
(ii) Find proportion of Right low group(PL).
(iii) Divide the sum of PH & PL by 2.
This may be stated as a simple formula :
P=
proportion of Right High + proportion of Right Low
2
Calculation of Difficulty
Index (3rd way)
2 1
P=
.8+ .54
2
=1.34 ÷ 2 = 0.67
Example (3rd way)
2 2
If no. of students in High & Low gp is 15 each
No of students in high gp who answered correctly RH = 12
Proportion of students in high gp who answered correctly PH =12/15=.8
No.of students in low gp who answered correctly RL = 8
Proportion of students in low gp who answered correctly PL =8/15= .54
Item Remark
91 -100% or .90 – 1.00 Too Easy
76 – 90% or .76 -.90 Acceptable
60 – 75% or .60 -.75 Best
40 – 59% or .40 -.59 Acceptable
0 – 39% or 0 -.39 Too Hard
Difficulty/Facility Index
Value Interpretation
2 3
(i) subtract the number in the Low group (RL)from the number in the
High group (RH) who answered correctly.
(ii) divide this difference by the total number of either groups
• This may be stated more simply as a formula:
DI =
No. of Right High − No. Right Low
No. in EITHER High OR Low group
Step-5 Calculation of
Discrimination
Power
2 4
DI =
12− 8
15
=4 ÷ 15 = 0.26
Example
2 5
If no. of students in High & Low gp is 15 each
No of students in high gp who answered correctly RH = 12
No.of students in low gp who answered correctly RL = 8
(i) For each item, find proportion of Right high gp ( PH).
(ii) Find proportion of Right low group(PL).
(iii) Subtract proportion of students in right low gp from proportion in
high gp (PH – PL ).
This may be stated as a simple formula :
DI=
proportion of Right High − proportion of Right Low
Calculation of
Discrimination Power(2nd way)
2 6
DI= PH – PL = .80 - .54 = 0.26
Example (2nd way)
2 7
If no. of students in High & Low gp is 15 each
No of students in high gp who answered correctly RH = 12
Proportion of students in high gp who answered correctly PH =12/15=.8
No.of students in low gp who answered correctly RL = 8
Proportion of students in low gp who answered correctly PL =8/15= .54
• The index of Discrimination (DI) ranges from +1.00 – 0 – 1.00.
• DI=1.00 indicates a perfect relationship between what the item is
measuring and what the test is measuring
• DI =0 indicates the item is not discriminating between the good and
the weak students.
• DI = -ive value shows that the weak students actually scored higher
than the better ones!.
• DI should be .30 or above.
Interpretation of DI
2 8
Ebel’s (1972, p. 399) “rule of thumb” standards for DI
DI
Approximately
Item evaluation
.40 and up Very good items
.30 to .39
Reasonably good, but possibly subject to
improvement
.20 to .29
Marginal Items, usually needing and being
subject to improvement
Below .19
Poor items, to be rejected or improved by
revision
29
Discrimination Index Difficulty/Facility Index
Item Remark Value Value Item Remark
Excellent .50 to .99 91 -100 Too Easy
Very Good .40 to .49 76 – 90 Acceptable
Good .30 to .39 60 – 75 Best
Marginal .20 to .29 40 – 59 Acceptable
Poor .00 to .19 0 – 39 Too Hard
3 0
Items with Difficulty Value 40%- 60% or .40 - .60 =Selected
Items with Discrimination Value= Above .40 = Selected
Items with Difficulty Value40%-59% & 76% – 90%
=Acceptable
Items with Discrimination Value between .20 to .39 = Modified
Items with Difficulty Value 0%- 39% & 90% -100% =Too hard
& Too easy
Items with Discrimination Value= Below .19 = Rejected
Step-6 Item Selection
3 1
DETAILS OF ITEM ANALYSIS
Item
no.s
High A. Gp Low A. Gp Difficulty Value Discrimination Power
Result
RH PH LH
PL PH +PL
𝟐
RH −LH
No. in 𝒆𝒊𝒕𝒉𝒆𝒓 𝑮𝑷
Remark
1 5
5
5
= 1.0 3 3
5
= .60
1.60
2
= .80
80
%
5 − 3
5
= 0.4 Good S
2 5
5
5
= 1.0 0 0
5
= 0
1.0
2
= .50
50
%
5 − 0
5
= 1.0 Excellent S
3 5
5
5
= 1.0 1 1
5
= .20
1.20
2
= .60
60
%
5 − 1
5
= 0.8 Excellent S
4 1 1
5
= .20 3 3
5
= .60
0.80
2
= .40
40
%
1 − 3
5
= - 0.40 Poor R
5 4 4
5
= .80 1 1
5
= .20
1.00
2
= .50
50
%
4 − 1
5
= 0.6 Good S
• This exercise is based on 9 items and total number of 20 students.
• High & Low gps (N) are 10 each.
• Remember that p%=RH + RL divided by 2N
• DI= RH – RL divided by N in either gp or PH – PL .
3 3
Practical Exercise
Item
No.
RH
PH
RH ÷ NH
RL
PL
RL ÷ NL
P or FI
(P = PH + PL ÷ 2
P%= RH + RL÷
Total no in High
&Low gp)
DI
DI= PH-PL
Decision
1. 9 .90 3 .30 0.6 60% .60 S
2. 7 .70 6 .60 0.65 65% .10 R
3. 4 .40 7 .70 0.55 55% -.30 R
4. 10 1.00 0 00
5. 8 .80 2 .20
6. 10 1.00 9 .90
7. 3 .30 1 .10
8. 2 .20 4 .40
9. 5 .50 5 .50
3 4
3 5
By using simple statistical procedures
for determining item difficulty level &
item discriminating power effectiveness
of each item of the test can be enhanced.
Nutshell
3 6

Item Analysis

  • 1.
    ITEM ANALYSIS Prof Amita PandeyBhardwaj Project Head-TLC Under PMMMNMTT Scheme , MoE Department Of Education SLBSNSU ( Central University),N.Delhi School of Education GNDU, Amritsar 2 Weeks Workshop Dated- 28th Oct.,2020 On Research Tools Development Organized By
  • 2.
    Computation of P& DI Practical Exercise Item Analysis Meaning Difficulty Level Add Contents Title Add Contents Title Focus of the Presentation. Steps Discrimination Power
  • 3.
    • a. Designingthe test • b. Preparation of blue printPlanning of the test • a. Item writing • b. Item editing • c. Pre try out Preparing Preliminary draft Try out • a . Difficulty Level • b. Discrimination ValueItem analysis Preparing the final draft • a. Reliability • b. ValidityEstablishment of Step-1 Step-2 Step-3 Step-4 Step-5 Step-6 10/29/2020 3
  • 4.
    • It isa technique for determining the quality of each individual item in a test. • Helps to improve tests by improving the individual items. • Provides valuable information about the effectiveness of instruction or training. • Most useful for test analysis techniques. • The quickest way to improve your test and your item-writing skills – is “item analysis”. Meaning of Item Analysis 4
  • 5.
    Which item to keepin the test? Which item to modify? Which item to eliminate?Item Analysi s 5
  • 6.
  • 7.
    7 Quantitative IA- A numericalmethod for analyzing test items employing student response alternatives or options. Qualitative IA – A non-numerical method for analyzing test items for test objectives , content validity& technical item quality.
  • 8.
  • 9.
    • Also calledFacility Index. • It is a proportion(p) or %tage of test takers who answer the item correctly. • It is an estimate (based on the high and low groups) of the percentage of the entire class who answered the item right. • The purpose of the Difficulty/Facility Index (FI) is to know ‘How difficult or easy was the item?’ Difficulty Level 9
  • 10.
     It measuresthe extent to which a test item discriminates or differentiates between high & low achievement gps.  The purpose of the Discrimination Index (DI) is to find out whether or not the item is measuring the same ability as the test measure.  It answers the question, ‘How well does item discriminate between the better and the weaker students? ‘  It is a measure of the correlation (relationship) between the item and the total test score. Discrimination Power 1 0
  • 11.
    1 1 Positive DI(No. of RH> No. of RL) Negative DI (No. of RH < No. of RL) Zero DI (No. of RH = No. of RL) 3 Type s of DI
  • 12.
  • 13.
    Arrange all theanswers sheets in descending or ascending order on the basis of scores. Step -1 1 3
  • 14.
    Divide arranged answersheets in two groups. Common approach followed:  Select top & bottom 27% of test takers in terms of their overall performance on the test and exclude the middle(Kelly 1939).  OR  Some assessment experts have suggested-Top & bottom 25% or 33% or 50%. Step -2 1 4
  • 15.
    ITEM NO. WISESTUDENT RESPONSE SHEET Item No -> Student No. 1 2 3 4 5 Total Score Group 1 P P P P P 5 High Scorer Group (50%) 2 P P P O P 4 3 P P P O P 4 4 P P P O P 4 5 P P P O O 3 6 P O P P O 3 Low Scorer Group (50%) 7 P O O P O 2 8 P O O P O 2 9 O O O O P 1 10 O O O O O 0
  • 16.
     Calculate 27%of the number of answer sheets you have retained (Extreme group number).  Then take out the top 27% of the answer sheets in your pile, and the bottom 27%.  Put them in two separate piles.  The pile (Extreme group) from the top is called the high group, and the other pile (lower Extreme group) is called the low group. Step-3 1 6
  • 17.
    (i) No. ofstudents who answered correctly. (ii) Divide by total No. of students This may be stated as a simple formula : P= No. of students correctly anwering the item 𝐭𝐨𝐭𝐚𝐥 𝐧𝐨 𝐨𝐟 𝐬𝐭𝐮𝐝𝐞𝐧𝐭𝐬 Step-4 Calculation of Difficulty Index 1 7
  • 18.
     In aclass of 30 students ,if 20 students get the answer correct & 10 incorrect the item difficulty will be P= 20 ÷ 30 = 0 .67 Example 1 8
  • 19.
    (i) For eachitem, add the number in the High group and the number in the Low group who answered correctly. (ii) Divide by total number of students in High & Low groups. (iii) Multiply this by 100 to make it a percentage. This may be stated as a simple formula : P% = No. of Right High + No. Right Low Total no. in High + Low groups x 100 Calculation of Difficulty Index (2nd way) 1 9
  • 20.
    P% = 12+ 8 15+ 15 x 100 =20 ÷ 30 = 0.67 Example (2nd way) 2 0 If no. of students in High & Low gp is 15 each No of students in high gp who answered correctly RH = 12 No.of students in low gp who answered correctly RL = 8
  • 21.
    (i) For eachitem, find proportion of Right high gp ( PH). (ii) Find proportion of Right low group(PL). (iii) Divide the sum of PH & PL by 2. This may be stated as a simple formula : P= proportion of Right High + proportion of Right Low 2 Calculation of Difficulty Index (3rd way) 2 1
  • 22.
    P= .8+ .54 2 =1.34 ÷2 = 0.67 Example (3rd way) 2 2 If no. of students in High & Low gp is 15 each No of students in high gp who answered correctly RH = 12 Proportion of students in high gp who answered correctly PH =12/15=.8 No.of students in low gp who answered correctly RL = 8 Proportion of students in low gp who answered correctly PL =8/15= .54
  • 23.
    Item Remark 91 -100%or .90 – 1.00 Too Easy 76 – 90% or .76 -.90 Acceptable 60 – 75% or .60 -.75 Best 40 – 59% or .40 -.59 Acceptable 0 – 39% or 0 -.39 Too Hard Difficulty/Facility Index Value Interpretation 2 3
  • 24.
    (i) subtract thenumber in the Low group (RL)from the number in the High group (RH) who answered correctly. (ii) divide this difference by the total number of either groups • This may be stated more simply as a formula: DI = No. of Right High − No. Right Low No. in EITHER High OR Low group Step-5 Calculation of Discrimination Power 2 4
  • 25.
    DI = 12− 8 15 =4÷ 15 = 0.26 Example 2 5 If no. of students in High & Low gp is 15 each No of students in high gp who answered correctly RH = 12 No.of students in low gp who answered correctly RL = 8
  • 26.
    (i) For eachitem, find proportion of Right high gp ( PH). (ii) Find proportion of Right low group(PL). (iii) Subtract proportion of students in right low gp from proportion in high gp (PH – PL ). This may be stated as a simple formula : DI= proportion of Right High − proportion of Right Low Calculation of Discrimination Power(2nd way) 2 6
  • 27.
    DI= PH –PL = .80 - .54 = 0.26 Example (2nd way) 2 7 If no. of students in High & Low gp is 15 each No of students in high gp who answered correctly RH = 12 Proportion of students in high gp who answered correctly PH =12/15=.8 No.of students in low gp who answered correctly RL = 8 Proportion of students in low gp who answered correctly PL =8/15= .54
  • 28.
    • The indexof Discrimination (DI) ranges from +1.00 – 0 – 1.00. • DI=1.00 indicates a perfect relationship between what the item is measuring and what the test is measuring • DI =0 indicates the item is not discriminating between the good and the weak students. • DI = -ive value shows that the weak students actually scored higher than the better ones!. • DI should be .30 or above. Interpretation of DI 2 8
  • 29.
    Ebel’s (1972, p.399) “rule of thumb” standards for DI DI Approximately Item evaluation .40 and up Very good items .30 to .39 Reasonably good, but possibly subject to improvement .20 to .29 Marginal Items, usually needing and being subject to improvement Below .19 Poor items, to be rejected or improved by revision 29
  • 30.
    Discrimination Index Difficulty/FacilityIndex Item Remark Value Value Item Remark Excellent .50 to .99 91 -100 Too Easy Very Good .40 to .49 76 – 90 Acceptable Good .30 to .39 60 – 75 Best Marginal .20 to .29 40 – 59 Acceptable Poor .00 to .19 0 – 39 Too Hard 3 0
  • 31.
    Items with DifficultyValue 40%- 60% or .40 - .60 =Selected Items with Discrimination Value= Above .40 = Selected Items with Difficulty Value40%-59% & 76% – 90% =Acceptable Items with Discrimination Value between .20 to .39 = Modified Items with Difficulty Value 0%- 39% & 90% -100% =Too hard & Too easy Items with Discrimination Value= Below .19 = Rejected Step-6 Item Selection 3 1
  • 32.
    DETAILS OF ITEMANALYSIS Item no.s High A. Gp Low A. Gp Difficulty Value Discrimination Power Result RH PH LH PL PH +PL 𝟐 RH −LH No. in 𝒆𝒊𝒕𝒉𝒆𝒓 𝑮𝑷 Remark 1 5 5 5 = 1.0 3 3 5 = .60 1.60 2 = .80 80 % 5 − 3 5 = 0.4 Good S 2 5 5 5 = 1.0 0 0 5 = 0 1.0 2 = .50 50 % 5 − 0 5 = 1.0 Excellent S 3 5 5 5 = 1.0 1 1 5 = .20 1.20 2 = .60 60 % 5 − 1 5 = 0.8 Excellent S 4 1 1 5 = .20 3 3 5 = .60 0.80 2 = .40 40 % 1 − 3 5 = - 0.40 Poor R 5 4 4 5 = .80 1 1 5 = .20 1.00 2 = .50 50 % 4 − 1 5 = 0.6 Good S
  • 33.
    • This exerciseis based on 9 items and total number of 20 students. • High & Low gps (N) are 10 each. • Remember that p%=RH + RL divided by 2N • DI= RH – RL divided by N in either gp or PH – PL . 3 3 Practical Exercise
  • 34.
    Item No. RH PH RH ÷ NH RL PL RL÷ NL P or FI (P = PH + PL ÷ 2 P%= RH + RL÷ Total no in High &Low gp) DI DI= PH-PL Decision 1. 9 .90 3 .30 0.6 60% .60 S 2. 7 .70 6 .60 0.65 65% .10 R 3. 4 .40 7 .70 0.55 55% -.30 R 4. 10 1.00 0 00 5. 8 .80 2 .20 6. 10 1.00 9 .90 7. 3 .30 1 .10 8. 2 .20 4 .40 9. 5 .50 5 .50 3 4
  • 35.
    3 5 By usingsimple statistical procedures for determining item difficulty level & item discriminating power effectiveness of each item of the test can be enhanced. Nutshell
  • 36.