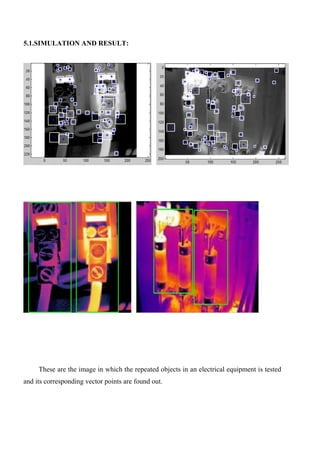
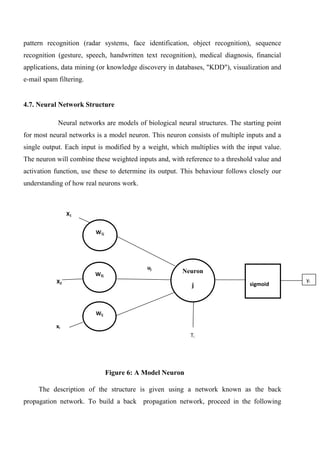
This document provides an overview of infrared thermography and its application in electrical system fault diagnosis. It begins with an introduction to infrared thermography, describing its history, basic principles of infrared radiation, and how thermography works. The document then discusses advantages and limitations of thermography, as well as how it can be used to detect various types of electrical faults. Specific applications of thermography for conditions monitoring of electrical equipment are also covered. The document provides details on infrared cameras and challenges of thermography for electrical systems. Overall, the document presents infrared thermography as a tool for non-destructive testing of electrical systems to detect faults and failures.

![temperature of the blackbody. By integrating Planck’s law over the entire spectrum (λ = 0
to ∞), the total hemispherical radiation intensity is obtained.
𝜀 𝑏 = 𝜎𝑇4
(2)
where ζ is the Stefan–Boltzmann constant (5.67051 x 10⁻⁸ W/m2K). It has to be pointed
out that equation (2) describes the radiation emitted from a black body which is the
maximumvalue radiated by a body at a given temperature. Real objects almost never
comply with thislaw although they may approach the behaviour of a black body in certain
spectral intervals.A real object generally emits only a part ελ of the radiation emitted by a
black body at thesame temperature and at the same wavelength. By introducing the
quantity,
𝜺 =
𝜺 𝝀
𝜺 𝝀𝒃
(3)
which is called the spectral emissivity coefficient, equation (2) can be rewritten for real
bodies by simply multiplying its second term by ελ. When averaged over all wavelengths,
the total power density for a non-black body object is [1]
𝑒𝑚𝑖𝑠𝑠𝑖𝑣𝑖𝑡𝑦 = 𝜀𝜎𝑇4
(4)
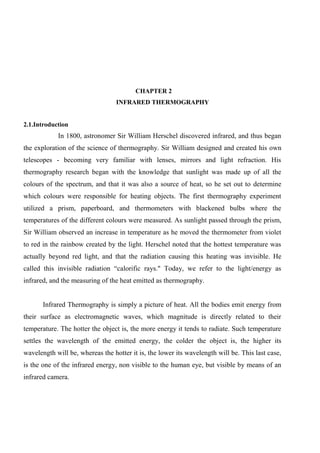
2.6 Infrared Thermography in Condition Monitoring of Electrical Equipment
All electrical devices are usually rated for power, which indicates the amount of
energy that the devices can conduct without being damaged. If the device is operated at a
power above its specifications, the excess power can reduce the device's life cycle and
efficiency. Basically, faults in electrical power system can be classified into few categories,
i.e., poor connection, short circuit, overloading, load imbalance and improper component
installation. In most cases, the major cause of overheating in utility components is the
change in resistance due to loose connection. The loose connection causes electricity to use
smaller area of the defective connection than required for proper current flow and therefore,
increases the resistance and temperature of the connection. Any problem, which
accompanies a change in resistance of the equipment, causes it to consume morepower than
the intended load.](https://image.slidesharecdn.com/irthermography-160502043736/85/Ir-thermography-14-320.jpg)

![𝑦−𝑖𝑛𝑘 = 𝑧𝑖 𝑤𝑗𝑘
𝑖
(11)
𝑧−𝑖𝑛𝐽 = 𝑣𝑖𝑗 𝑥𝑖
𝑖
𝑌𝑘 = 𝑓(𝑦−𝑖𝑛𝑘 ) (12)
The error to be minimised is
𝐸 = 0.5 [𝑡 𝑘 − 𝑦 𝑘 ]
𝑘
² (13)
By use of chain rule we have
𝜕𝐸
𝜕𝑤𝑗𝑘
=
𝜕
𝜕𝑤𝑗𝑘
0.5 [𝑡 𝑘 − 𝑦 𝑘]
𝑘
² (14)
=
𝜕
𝜕𝑤 𝑗𝑘
0.5[𝑡 𝑘 − 𝑡 𝑦−𝑖𝑛𝑘 ]²
= -[𝑡 𝑘 − 𝑦 𝑘]
𝜕
𝜕𝑤 𝐽𝑘
𝑓(𝑦−𝑖𝑛𝑘 )
=-[𝑡 𝑘 − 𝑦 𝑘] 𝑓(𝑦−𝑖𝑛𝑘 )
𝜕
𝜕𝑤 𝐽𝑘
(𝑦−𝑖𝑛𝑘 )
=-[𝑡 𝑘 − 𝑦 𝑘]𝑓¹(𝑦−𝑖𝑛𝑘 )𝑍𝑗 (15)
Let us define
δk=-[𝑡 𝑘 − 𝑦 𝑘]𝑓¹(𝑦−𝑖𝑛𝑘 ) (16)
Weights on connections to the hidden unit zj
𝜕𝐸
𝜕𝑣𝑖𝑗
= − 𝑡 𝑘 − 𝑦 𝑘
𝜕𝐸
𝜕𝑣𝑖𝑗
𝑦 𝑘
𝑘
(17)](https://image.slidesharecdn.com/irthermography-160502043736/85/Ir-thermography-41-320.jpg)
![= − 𝑡 𝑘 − 𝑦 𝑘 𝑓(𝑦𝑖𝑛𝑘 )
𝜕
𝜕𝑣𝑖𝑗
𝑦−𝑖𝑛𝑘
𝑘
= − δ 𝑘
𝜕
𝜕𝑣𝑖𝑗
𝑦−𝑖𝑛𝑘
𝑘
(18)
Rewriting the equation and substituting the values of y-ink
= − δ 𝑘
𝜕
𝜕𝑣𝑖𝐽
( 𝑧𝑗 − 𝑤𝐽𝑘 )
𝑘
(19)
= − δ 𝑘 𝑤𝐽𝑘
𝜕
𝜕𝑣𝑖𝐽
𝑧𝐽
𝑘
= − δ 𝑘 𝑤𝐽𝑘
𝜕
𝜕𝑣𝑖𝐽
𝑓(𝑧𝑖𝑛𝐽 )
𝑘
= − δ 𝑘 𝑤𝐽𝑘 𝑓´(𝑧𝑖𝑛𝐽 )( 𝑥𝑖)
𝑘
δj= − δ 𝑘 𝑤𝐽𝑘 𝑓´(𝑧𝑖𝑛𝐽 )𝑘 (20)
The weight updation for output unit is given by
Δwjk=−α
∂E
∂wjk
(21)
=α[𝑡 𝑘 − 𝑦 𝑘 ]f¹(𝑦−𝑖𝑛𝑘 )𝑧𝑗
=αδk 𝑧𝑗
The weight updation for the hidden unit is given by
Δ𝑣𝑖𝑗 = −𝛼
𝜕𝐸
𝜕𝑣𝑖𝑗
= 𝛼𝑓1
𝑧−𝑖𝑛𝑗 𝑥𝑖 𝛿 𝑘
𝑘
𝑤𝑗𝑘 (22)
=αδj 𝑥𝑖(23)](https://image.slidesharecdn.com/irthermography-160502043736/85/Ir-thermography-42-320.jpg)