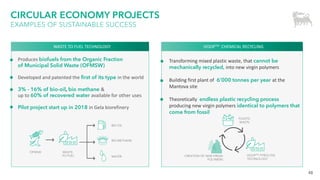
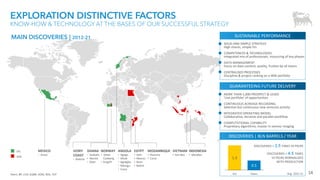
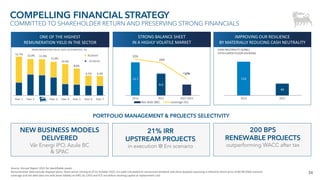
- Eni has a best-in-class exploration track record over the past decade, with the highest profitability rate and reserves replacement ratio among its peers.
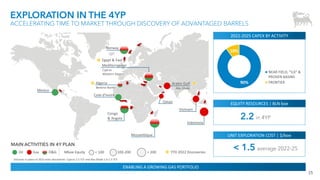
- Eni focuses on near-field exploration in proven basins using advanced technology and high equity stakes, resulting in a low-risk, high-return upstream portfolio.
- Eni's exploration strategy is distinguished by its dual exploration model, proprietary computational capabilities, and continuous acreage reloading to sustain a large portfolio of prospects.

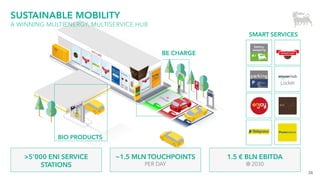

![38
ENI TOP MANAGEMENT [1/3]
He was appointed Chief Financial Officer in Eni on 1st August, 2020.
He graduated in Economics and Commerce at the University of Bologna.
He joined Agip S.p.A. in 1995. From 2001 to 2005 he was Head of
Negotiations & Commercial Planning in Libya activities. From 2006 to 2008,
he became Head of Business Planning and Development activities for Africa,
Europe, Asia & America, supporting the E&P Division’s Deputy General
Director. In 2009, he was appointed Head of Upstream M&A, contributing
to the rationalization of the portfolio. In 2011, he became Senior Vice
President of Market Scenarios and Strategic Options in Eni SpA. In 2014, he
was appointed Head of Investor Relations and also acted as Secretary to
Eni's Advisory Board from 2016 to 2019. In 2019, he moved to Houston to
become Upstream Director of the Americas, managing the E&P business in
the USA, Mexico, Venezuela and Argentina.
Francesco Gattei - CFO
Claudio Descalzi - CEO
He has been Eni’s CEO since May 2014.
He graduated in physics in 1979 from the University of Milan.
He joined Eni in 1981 as Oil & Gas field petroleum engineer. In 1990
he was appointed Head of Reservoir and operating activities for
Italy. From 2000 to 2001 he held the position of Executive Vice
President for Africa, Middle East and China. From 2002 to 2005 he
was Executive Vice President for Italy, Africa, Middle East, covering
also the role of member of the board of several Eni subsidiaries in
the area.
In 2005, he was appointed Deputy Chief Operating Officer of the
E&P Division in Eni. From 2008 to 2014 he was Chief Operating
Officer in the E&P Division of Eni. In 2012, Claudio Descalzi was the
first European in the field of Oil&Gas to receive the prestigious
“Charles F. Rand Memorial Gold Medal 2012” award from the
Society of Petroleum Engineers and the American Institute of Mining
Engineers. In May 2022 he received the Distinguished Business
Leadership Award from the Atlantic Council.
Giuseppe Ricci – Energy Evolution
Guido Brusco – Natural Resources
He was appointed Chief Operating Officer Natural Resources of Eni
on February 7th, 2022.
After graduating with Honors in Mechanical Engineering at the
University of Roma “La Sapienza”, he joined Eni in 1997.
He began his career in drilling and production, holding positions of
growing responsibility, in different countries, up to the role of
Deputy Operations General Manager in Egypt in 2005 and
Operations Division Director in Kazakhstan in 2009. He took up the
roles of Managing Director of Agip KCO in Kazakhstan in 2013,
Managing Director of Agip Caspian Sea in 2014 and subsequently
Managing Director in Angola. In 2018 he was appointed Executive
Vice President for Sub-Saharan Africa Region and in 2020 Director of
Upstream.
He was appointed Chief Operating Officer of Energy Evolution on January
1, 2021. He joined Eni in 1985 initially working in the study and
development
of new refining processes at the Sannazzaro refinery, In 2000 he became
responsible for Refining Processes Development. He took over in 2004 as
director of the Gela Refinery, a challenging assignment both from a
managerial perspective and in terms of the refining cycle and plant
complexity. In 2006 he was appointed managing director of the refinery.
In June 2010 he was made Senior Vice President of the Industrial Sector
for Refining & Marketing, holding also chairmanship of Gela and Milazzo.
In 2012 he took on the delicate role of Eni’s Executive Vice President
HSEQ.](https://image.slidesharecdn.com/investor-presentation-221231205848-1b74bc7a/85/Investor-presentation-pdf-38-320.jpg)
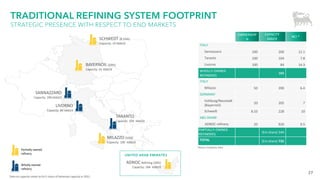
![39
ENI TOP MANAGEMENT [2/3]
He was appointed as Upstream Director on Feb. 7th, 2022. He graduated
with honors in Mining Engineering from the Alma Mater Studiorum
University of Bologna in 1988. He joined Eni Group in 1990, at the beginning
of his career as a reservoir engineer at Agip SpA. Luca has matured a
considerable experience in managing complex Joint Ventures, and in
commercial negotiations in challenging environments. In 2009 he was
appointed Technical Director in Eni UK and in 2010 he became Managing
Director of Eni in Turkmenistan. He Moved to Egypt in late 2011, serving
Agiba as General Manager & Manager Director. In the period from 2012 to
2020 he was working in Kazakhstan, where he covered the position of EVP
of Central Asia Region (2016-2020). From 2020 to 2021 he has been the
Head of Commercial Negotiations for Eni, and the Head of Sub-Saharan
Africa Region Upstream Business from 2021 to early 2022.
Luca Vignati - Upstream
Umberto Carrara – Green/Trad. R&M
He was appointed as Deputy of Chief Operating Officer Energy Evolution
on November 4th, 2021. Since January 2021 he’s also Director of
Green/Traditional Refining and Marketing.
He graduated in Civil/Hydraulic Engineering and joined Eni in 1985.
He began his career in the Petroleum Engineering, holding positions of
growing responsibility in different countries up to the role of Managing
Director in the most critical Upstream geographical contexts (Norway,
Egypt, Libya). In 2005 he came back to Italy as Director of Exploration in
the E&P Division; then he took up the role of Managing Director of
Kazakhstan Subsidiary until 2013. Since 2013 he has been in charge of
the International Negotiations Department and in 2015 of the Sub-
Saharian Africa Region. At the beginning of 2018 he was appointed
Executive VP International Business Development R&M and in the 2019
he added also the responsibility of Licensing.
He was appointed Deputy of Chief Operating Officer Natural Resources
and also Director Global Gas & Lng Portfolio of Eni on July 1, 2020.
He graduated in Mechanical Engineering in 1999 from the Politecnico
di Milano. In 2000, he was awarded a scholarship for a research
doctorate at the Politecnico di Milano’s Department of Energy. After
experience in McKinsey and Citigroup, he joined Eni in 2007, in the Office
of the CEO. Between 2008 and 2016, he worked in Eni's Gas & Power
business, first as Senior Vice President International Sales and later as
Executive Vice President International Markets and LNG. In 2016, he took
the position of Executive Vice President Portfolio Strategy & Long Term
Gas Negotiations in the Midstream business. In 2018, he became
Executive Vice President of the Gas Business Unit with responsibility for
the entire midstream gas value chain. In 2019, he was appointed Chief
Gas & Lng Marketing and Power Officer of Eni.
Cristian Signoretto - Global Gas & LNG Portfolio
Francesca Zarri – Technology, R&D & digital
She was appointed Director of Technology, R&D & Digital of Eni
on July 1, 2020.
In 1997, she joined Agip S.p.A to work in the Reservoir Department
as reservoir modeler and petroleum engineer. In 2004, after moving
to the Engineering and Projects Department, she became the head
of the Adriatic Off-shore Projects department. In 2006, she became
Head of the Production Optimization Technology Department, which
at that time, also included most of the Eni’s Laboratories in Bolgiano.
From 2007 to 2010, she worked for West Africa as Project and
Development Director of Eni Congo. In 2011 she became the Head
of American Region in the procurement function, then the Head
of Procurement Services. During the same period, she was Eni's
representative for Commercial Committee in the South Stream
Project.](https://image.slidesharecdn.com/investor-presentation-221231205848-1b74bc7a/85/Investor-presentation-pdf-39-320.jpg)
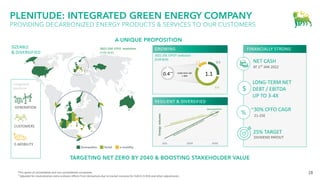
![40
ENI TOP MANAGEMENT [3/3]
Adriano Alfani – Versalis S.p.A.
He was appointed Versalis’ Chief Executive Officer starting from the
1st January, 2021. He started his career at EniChem after working at Dow
since 2001, where he adopted a business model based on innovation,
circular economy and sustainability principles. He has 20-years of
experience in the international Chemical industry, having operated in
large, important and complex markets, and holding several international
roles at Senior Global Business Director and Senior Global Strategy
Director levels.
Stefano Goberti – Plenitude S.p.A.
He was appointed Plenitude’ Chief Executive Officer on November 5th,
2021. Stefano graduated in Economics and Banking from University of
Siena.
He joined Eni in 1991. Stefano spent over 30 years in Eni group, covering
different strategic positions in Italy and abroad, including : Eni Exploration
& Production division (various roles in Finance and Control), Executive
Vice President Planning & Control of Eni, CFO of Saipem, Head of Finance
and Insurances for Eni. Since March 2021 Stefano led the Eni Retail and
Renewables valorization project, and on November 2021 he was
appointed by Eni BoD as the new company CEO.](https://image.slidesharecdn.com/investor-presentation-221231205848-1b74bc7a/85/Investor-presentation-pdf-40-320.jpg)
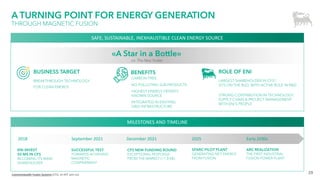
![42
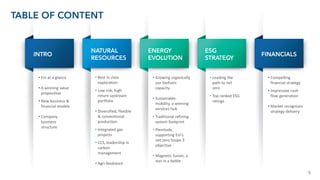
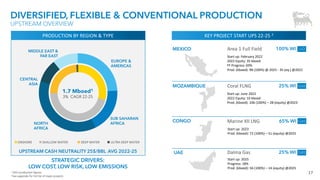
KEY PROJECTS START UPS OVER 2022-25 [1/2]
Start up: February 2022
2022 Equity: 35 kboed
FF Progress: 69%
Prod. (kboed): 98 (100%) @ 2025 - 35 (eq.) @2022
Area 1 Full Field 100% WI
MEXICO LIQ
Johan Castberg 19% WI LIQ
Balder X 58% WI
Breidablikk 27% WI
NORWAY
LIQ
Start up: 2024
Prod. (kboed): 57 (100%) – 13 (equity) @2026
Start up: Q3 2024
Prod. (kboed): 71 (100%) – 41 (equity) @2024
Start up: 2024
Prod. (kboed): 184 (100%) – 36 (equity) @2025
LIQ
Cassiopea 60% WI
ITALY GAS
Start up: 2024
Progress: 24%
Prod. (kboed): 27 (100%) – 16 (equity) @2025
A&E Structure 50% WI
Start up: 2024 (Struct. A)
Prod. (kboed): 205 (100%) – 120 (equity) @2027
LIBYA GAS
Melehia ph.2 76% WI
EGYPT LIQ/GAS
Berkine South 75% WI
ALGERIA LIQ/GAS
Start up: Oct. 2022 (press release 10.10.22)
2022 Equity: 3 kboed
Prod. (kboed): 49 (100%) – 18 (equity) @2025
Start up: 2024 (Gas)
2022 Equity: 8 kboed (oil&gas)
Prod. (kboed): 50 (100%) – 27 (equity) @2025
NOTE: Average yearly production in peak year at plateau](https://image.slidesharecdn.com/investor-presentation-221231205848-1b74bc7a/85/Investor-presentation-pdf-42-320.jpg)
![43
KEY PROJECTS START UPS OVER 2022-25 [2/2]
NOTE: Average yearly production in peak year at plateau
Start up: 2023
Prod. (kboed): 15 (100%) – 12 (equity) @2024
Baleine ph.1 83% WI
IVORY COAST LIQ/GAS
Start up: 2024
Prod. (kboed): 17 (100%) – 9 (equity) @2025
Merakes East 65% WI
INDONESIA GAS
Start up: June 2022
2022 Equity: 10 kboed
Prod. (kboed): 106 (100%) – 28 (equity) @2023
Coral FLNG 25% WI
MOZAMBIQUE GAS
Marine XII LNG 65% WI
Start up: 2023
Prod. (kboed): 72 (100%) – 51 (equity) @2025
CONGO GAS
Agogo EP ph.2 18% WI
ANGOLA LIQ
Start up: Q4 2022 (Ph.1: Dec ‘19)
2022 Equity: <1 kboed
Progress: 81%
Dalma Gas 25% WI
Start up: 2025
Progress: 18%
Prod. (kboed): 56 (100%) – 14 (equity) @2025
UAE GAS
Start up: 2025
Prod. (kboed): 29 (100%) – 6 (equity) @2026
Maha 40% WI GAS](https://image.slidesharecdn.com/investor-presentation-221231205848-1b74bc7a/85/Investor-presentation-pdf-43-320.jpg)