Download as PDF, PPTX
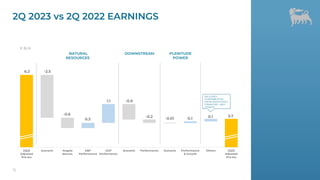
![NATURAL RESOURCES
OUTPERFORMING SCENARIO
7
7
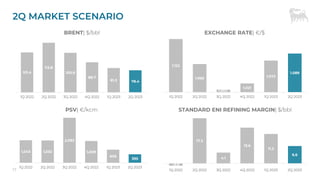
E&P
ADJ. EARNINGS PRE-TAX | € BLN
WEAKER SCENARIO
LOWER PRICES
BRENT -31%, PSV -62%
E&P
EBIT €2.1 BLN RESILIENT IN
CONTEXT OF SCENARIO &
HIGHER NON-CASH
EXPLORATION EXPENSES
GGP
BUSINESS RESILIENT TO
ABSOLUTE GAS PRICE FALL
BENEFITS FROM
CONTRACTUAL TRIGGERS,
RENEGOTIATIONS AND
SETTLEMENTS
1H EBIT € 2.5 BLN YTD
EXCEEDING ORIGINAL
GUIDANCE
2023 GGP GUIDANCE RAISED
TO € 2.7-3.0 BLN
Gas
[xx%]
5.4
2.3
2Q 2022 2Q 2023
PRODUCTION 1.61 MBOED IN 2Q
+2% YOY DRIVEN BY RAMP-UP IN
MOZAMBIQUE, MEXICO AND
RECOVERED PRODUCTION IN
KAZAKHSTAN
CONTINUOUS FOCUS
ON COST MANAGEMENT
GGP
ADJ. EARNINGS PRE-TAX | € BLN
-0.03
1.1
2Q 2022 2Q 2023
DELIVERING ON SUPPLY PORTFOLIO
RELOAD
POSITIVE CONTRIBUTION FROM
OPTIMIZATION AND TRADING](https://image.slidesharecdn.com/20231hresults-final-230728114826-9104140e/85/2023-2Q-Results-7-320.jpg)


![[2.1]
3.38
3.67
1.09
0.16
0.17 0.10
0.18 0.07
0.07
-0.01
-0.07
-0.02 -0.14
E&P CCS GGP GTR&M Versalis Plenitude &
Power
Corporate &
Others
Ebit Net Fin
Expense
Vår Energi Azule Adnoc Other
associates
Pre Tax
Earnings
2Q 2023 EARNINGS SUMMARY
EBIT TO PRE-TAX RECONCILIATION
14
RESISTING SCENARIO
HEADWINDS TO DELIVER
DIVERSITY IN CONTRIBUTION
RESILIENT DELIVERY FROM
UPSTREAM
GGP CONFIRMS QUALITY AND
PERFORMANCE OF BUSINESS
MODEL
EMERGENCE OF PLENITUDE
SATELLITES AND ASSOCIATES
INCREASINGLY IMPORTANT
CONTRIBUTORS IN EARNINGS
AND AS DIVIDEND PAYERS
€ BLN](https://image.slidesharecdn.com/20231hresults-final-230728114826-9104140e/85/2023-2Q-Results-14-320.jpg)
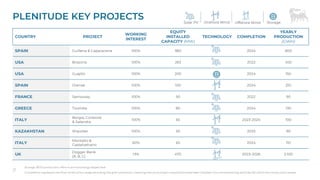
![UPSTREAM KEY START-UPS IN THE PLAN [1/2]
a Average yearly production in peak year/at plateau
Operatorship legend: Y (yes), N (no), J (joint)
COUNTRY PROJECT OPERATOR W.I. PRODUCTS FID START UP PRODUCTION (KBOED)A
ANGOLA
(Azule Energy)
Agogo West Hub Integrated J 18% Liquids 2022 2026 (FPSO) 175 (100%)
NGC Quiluma & Mabuqueiro J 19% Gas 2021 2026 100 (100%)
CONGO Congo LNG Y 65% Gas 2022 2023 123 (100%)
EGYPT Melehia ph.2 Y 76% Liquids/Gas 2022
2024
(Gas Plant)
37 (100%, Oil&Gas)
INDONESIA
Merakes East Y 65% Gas 2023 2025 15 (100%)
Maha Y 40% Gas 2024 2026 34 (100%)
ITALY Cassiopea Y 60% Gas 2018 2024 27 (100%)
18](https://image.slidesharecdn.com/20231hresults-final-230728114826-9104140e/85/2023-2Q-Results-18-320.jpg)
![UPSTREAM KEY START-UPS IN THE PLAN [2/2]
COUNTRY PROJECT OPERATOR W.I. PRODUCTS FID START UP PRODUCTION (KBOED)A
IVORY COAST
Baleine ph.1 Y 83% Liquids/Gas 2022 2023 18 (100%)
Baleine ph.2 Y 83% Liquids/Gas 2022 2024 38 (100%)
LIBYA A&E Structure Y 50% Gas 2023
2026
(Struct. A)
160 (100%)
NORWAY
(Var Energi)
Balder X N 58% Liquids 2019 Q3 2024 >70 (100%)b
Breidablikk N 22% Liquids 2020 2024 ~62 (100%)c
Johan Castberg N 19% Liquids 2017 2024 ~190 (100%)c
UAE Dalma Gas N 25% Gas 2019 2025 56 (100%)
a Average yearly production in peak year/at plateau
b Source: Var Energi Q1 2022 results (total Balder field production)
c Source: IPO prospect
Operatorship legend: Y (yes), N (no), J (joint)
19](https://image.slidesharecdn.com/20231hresults-final-230728114826-9104140e/85/2023-2Q-Results-19-320.jpg)

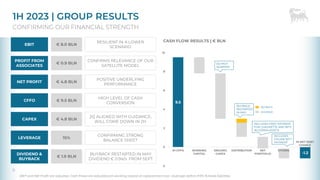
Eni reported its 1H 2023 results. EBIT for the period was €8 billion, in line with guidance despite a weaker scenario of Brent -31% and PSV -62%. Cash flow from operations was €9.5 billion, covering capital expenditure and distribution. Production for the period averaged 1.61 million boe/day, up 2% year-on-year. Guidance for 2023 was reiterated or updated, with GGP EBIT guidance raised to €2.7-3 billion. The results demonstrate Eni's resilience in a lower price environment and progress on its strategic priorities.


