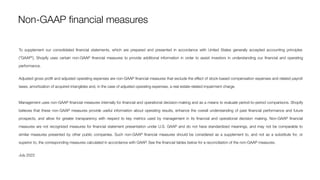
SlideShare a Scribd company logo
1 of 35
Download to read offline
Investor
Overview
Q2 2022
This presentation contains forward-looking statements that are based on our management’s
current estimates, beliefs and assumptions, which are based on management’s perception of
historic trends, current conditions and expected future developments, as well as other factors
management believes are appropriate in the circumstances. Although we believe that the plans,
intentions, expectations, assumptions and strategies reflected in these forward-looking
statements are reasonable, these statements relate to future events or our future financial
performance, and involve known and unknown risks, uncertainties and other factors that may
cause our actual results to be materially different from any future results expressed or implied by
these forward-looking statements. Although the forward-looking statements contained in this
presentation are based upon what we believe are reasonable assumptions, investors are
cautioned against placing undue reliance on these statements since actual results may vary from
the forward-looking statements. Forward-looking statements involve known and unknown risks,
uncertainties and other factors, which are, in some cases, beyond our control and which could
materially affect our results. These risks include the risks due to the uncertainty around the
duration and scope of the COVID-19 pandemic and the impact of the pandemic and actions
taken in response on global and regional economies and economic activity and are described in
further detail in our Management's Discussion and Analysis for the year ended December 31,
2021 and in the section entitled “Risk Factors” in our Annual Information Form for the year ended
December 31, 2021 available on www.sec.gov and on www.sedar.com and elsewhere in our
filings with regulatory agencies. If one or more of these risks or uncertainties occur, or if our
underlying assumptions prove to be incorrect, actual results may vary significantly from those
expressed, implied or projected by the forward-looking statements. References to long-term
trends in our model are forward-looking and made as of the current date. Nothing in this
presentation should be regarded as a representation by any person that these long-term trends
will be achieved and we undertake no duty to update these long-term trends or any other
forward-looking statements contained in this presentation, except as required by law.
July 2022
We believe that the case studies presented in this presentation provide a representative sample
of how our merchants have been able to use various features of our platform to grow their
respective businesses. References in this presentation to increased visits, growth and sales
following implementation of our platform do not necessarily mean that our platform was the only
factor contributing to such increases.
To supplement the financial measures prepared in accordance with generally accepted
accounting principles (GAAP), we use non-GAAP financial measures that exclude certain items.
Non-GAAP financial measures are not prepared in accordance with GAAP; therefore, the
information is not necessarily comparable to other companies and should be considered as a
supplement to, not a substitute for, or superior to, the corresponding measures calculated in
accordance with GAAP. Please refer to the slides titled “Non-GAAP Financial Measures” and
“Reconciliation of GAAP to Non-GAAP Figures” for further information.
This presentation contains information concerning our industry, including information relating to
the size of the markets in which we participate, that are based on industry surveys and
publications or other publicly available information, other third-party survey data and research
reports. This information involves many assumptions and limitations, there can be no guarantee
as to the accuracy or reliability of such assumptions and you are cautioned not to give undue
weight to this information. While we believe this information to be reliable, it has not been
independently verified.
This presentation contains trademarks, service marks, trade names and copyrights of Shopify
and other companies, which are the property of their respective owners.
Safe harbor
One platform, every channel, any device
Building essential internet
infrastructure for commerce
Online Marketplaces
Brick & Mortar Pop-Ups +
Online
Single integrated back office
Making commerce creative,
and the important easy
Order Management
Inventory & Fulfillment Shipping Apps
Payments Capital Marketing Analytics
Retail is
changing.
Coco and Breezy
Basic
Advanced
Shopify
Shopify Plus
$29 per month
$299 per month
$79 per month
$2,000+ per month
+ variable platform fee
Entrepreneurs
SMBs
Larger
Brands
Shopify is the
entrepreneurship company
for merchants of all sizes
Our market
Lite
$9 per month
Anyone who wants to make
more money from their site
than they pay for it
Total addressable market
TAM
$160B
(1)
Merchants
defined
as
retailers
with
fewer
than
500
employees.
Includes
commercially
located
businesses,
sole
proprietorships
and
home-based
businesses.
Does
not
include
early-stage
entrepreneurs
or
enterprises.
(2)
Average
revenue
per
merchant
of
approximately
$2,354
based
on
ARPU
for
2021
and
68
million
retail
businesses
globally
(Source:
AMI
Partners,
2020)
Entrepreneurs
SMBs
Larger
Brands
Entrepreneurs
SMBs
Larger
Brands
Merchant
acquisition
✓ Shopify Plus Sales
✓ Partners and Affiliates
✓ Global Events
✓ Content Marketing
✓ Shopify Blog
✓ Digital Advertising
✓ Search Engine Marketing
✓ Brand and Studios
✓ Shopify POS Sales
✓ Word of Mouth
✓ Shopify Support
✓ Offline Marketing
Casting a very wide net
Larger brands
Capturing the shift from
SMB to large brands
Indigenous Box
Online store selling quarterly subscription boxes
with curated products crafted by Indigenous
entrepreneurs
✓ Shopify Payments
✓ Shop Pay
✓ Shopify Email
Our platform grows with our merchants
XO Marshmallow
Sells handmade gourmet marshmallows
direct-to-consumer on their online store and
in-person at the world’s first marshmallow café
Blender Bottle
Market-leading fitness and nutrition brand known
for their proprietary shaker bottles
✓ Shopify Payments
✓ Shop Pay
✓ Shopify Pay Installments
✓ Shopify Capital
✓ Shopify Payments
✓ Shop Pay
✓ Shop Pay Installments
✓ Shopify Audiences
Joined Shopify in 2022 Joined Shopify in 2016 Joined Shopify Plus in 2015
Entrepreneur SMB Large Brands
Merchant Journey
Merchant-centred business model where merchant solutions
grow hand-in-hand with merchant success
Upgraded to the
Advanced Plan
Adopted Shopify
Capital
Adopted Shopify
Audiences
2022
2021
2020
2019
Joined Shopify
and subscribed to
the Shopify Plan
Adopted Shopify
Payments and
Shop Pay
Upgraded to
Shopify Plus
Adopted Shop Pay
Installments
Ecommerce
Powerful trends in our favor
Source:
Euromonitor,
Blue
Cart,
Statista
Note:
Ecommerce
market
based
on
global
goods
market
growth.
Direct-to-consumer
growth
based
on
2021
YoY
growth.
1
Reflects
FY21
YoY
growth.
21%
2019 - 2021 global
ecommerce CAGR
69%
2019 - 2021 Shopify
GMV CAGR
Direct-to-consumer
Digital payments
15%
Direct-to-consumer
market growth in 2021
1M
New Shopify merchants
from 2019 to 2021
24%
Global digital payments
growth in 2021
59%
GPV YoY growth1
Placeholder - find new image
+75%
57
Million*
More consumers are buying
from Shopify stores
+63%
+32%
+38%
+52%
+31%
2017
2018
2019
2020
2021
2015
2016
100
Million
163
Million
216
Million
300
Million
457
Million
597
Million
*Number
of
online
shoppers
Multi-Channel
Pinterest
Amazon
Facebook
Google
Instagram
eBay
Amazon
TikTok
Walmart
Shop Pay on Facebook,
Instagram, & Google
JD.com
Spotify
Twitter
YouTube
Ecosystem
App Store
Theme Store
Plus Partner Program All-New App Store Experts Marketplace
Shipping &
Fulfillment
Shopify Shipping Shopify Fulfillment Network
Deliverr
Shop Promise
Retail Shopify POS Locations
All-New Shopify POS
Tap & Chip Reader
Tap to Pay (iPhone)
Money Shopify Payments Shopify Capital
Shop Pay
Fraud Protect
Local Payment Methods
Multi-Currency
Shopify Balance
Shop Pay Installments
Shopify Protect
Marketing Marketing Dashboard Shopify Email
Shop
Shopify Markets
Shopify Inbox
Shopify Audiences
2009 - 2014 2015 - 2016 2017 - 2018 2019 - 2020 2021 - 2022
Merchant-first focus through product innovation
Lowering barriers, simplifying operations, catalyzing merchant sales
8,000+
Apps extending product capabilities Ecosystem Partners referred at least one
merchant to Shopify in the last 12 months
40,000+
Favorable terms encourage greater innovation on behalf of merchants while
increasing the opportunity for developers to grow their businesses
Rich & extensive partner ecosystem
Figures
as
of
December
31,
2021
Creating Economic Impact*
Making commerce better
for everyone in everything we do
*
2021
data
from
The
Shopify
Effect
Combating Climate Change
$5M minimum annual spend for Shopify’s
Sustainability Fund
Committed to carbon-neutral operations
and platform
Offset carbon emissions on all orders
placed on our platform during BFCM 2021
Launched Frontier, the world’s largest
combined financial commitment to buy carbon
removal, in partnership with 4 other companies
Signed a power purchase agreement to
power 100% of office buildings and
employee home offices across North
America with wind energy
Making a Social Impact
Operation HOPE to help create 1M new
Black-owned businesses by 2030
Government partnerships to help bring
thousands of small businesses online
Increase visibility for local shops,
sustainable shops, Black-owned
businesses, Asian-owned businesses,
women-owned businesses, LGBTQ+
businesses, and Indigenous-owned
businesses through Shop app
Growth-minded culture
+
+
+
+
Recruit talented, deeply caring individuals
Digital by Design allows employees to easily
work almost anywhere in the world
Invest heavily in personal growth and
development
Build a team that reflects the world we live in
The
numbers.
Strong & competitive market position
Share of US retail ecommerce sales 2021
Source:
eMarketer,
October
2021
Shopify
market
share
based
on
Shopify’s
2021
US
GMV
(excluding
merchant
sales
made
through
POS)
Subscription Solutions
Merchant Solutions
$1,119.5M
$1,295.1M
+16%
$673.3M
$1,073.2M
+59%
$1,578.2M
+47%
$2,929.5M
+86%
$4,611.9M
+57%
When our merchants succeed, Shopify benefits
Strong revenue growth off a much higher base
Q2
2017
Q2
2018
Q2
2019
35% CAGR
Q2
2020
Q2
2021
$107.2M
Q2
2022
$23.7M
More new merchants building businesses on the platform
Q2 YoY MRR grew as more merchants joined the platform…
*Monthly
Recurring
Revenue,
or
MRR,
is
calculated
at
the
end
of
each
period
by
multiplying
the
number
of
merchants
who
have
subscription
plans
with
us
at
the
period
end
date
by
the
average
monthly
subscription
plan
fee
in
effect
on
the
last
day
of
that
period,
assuming
they
maintain
their
subscription
plans
the
following
month.
**Due
to
the
extended
90-day
free
trial
(offered
from
March
21
through
May
31,
2020),
MRR
that
normally
would
have
been
counted
in
Q2
2020
did
not
start
getting
charged
until
Q3
2020.
24%
14%
$196.4M
$366.4M
+10%
62%
16%
21%
63%
19%
21%
60%
17%
22%
61%
59%
20%
22%
Monthly Recurring Revenue -
Core
Apps, Themes, Domains, Shopify
Plus Platform Fee Revenue*
Monthly Recurring Revenue -
Shopify Plus
63%
23%
14%
$334.2M
+70%
61%
24%
14%
Subscription solutions revenue growth in Q2
…contributing to solid Subscription Solutions revenue growth
*Approximate
Apps,
Themes,
Domains,
Shopify
Plus
Platform
Fee
Revenue
is
calculated
by
averaging
current
and
previous
quarter
MRR,
multiplying
by
3
and
subtracting
total
from
Subscription
Solutions
revenue.
Numbers
may
not
foot
due
to
rounding.
63%
27%
10%
60%
13%
27%
$26.3B
$41.1B
+56%
$61.1B
+49%
$42.2B
$46.9B
+11%
$119.6B
+96%
$175.4B
+47%
Merchants are joining, scaling and succeeding on Shopify
Strong consistent GMV growth
*Gross
Merchandise
Volume,
or
GMV,
represents
the
total
dollar
value
of
orders
facilitated
on
the
Shopify
platform
including
certain
apps
and
channels
for
which
a
revenue-sharing
arrangement
is
in
place
in
the
period,
net
of
refunds,
and
inclusive
of
shipping
and
handling,
duty
and
value-added
taxes.
Shopify Payments
$20.3B
Gross Payments Volume (GPV)*
Shopify Capital
Merchant Cash Advances and Loans
48%
GMV Penetration
53%
GMV Penetration
$416.4M
+15%
$363.0M
$24.9B
+22%
Increased adoption of Shopify products over time
*Gross
Payments
Volume
(GPV)
is
the
amount
of
GMV
processed
through
Shopify
Payments.
$627.0M
$665.0M
+6%
$1,568.5M
+78%
$2,509.2M
+60%
Powerful business model that focuses on gross profit dollar growth
Solid adjusted gross profit* growth
*Excludes
the
effect
of
stock-based
compensation
(SBC)
expenses
and
related
payroll
taxes,
and
amortization
of
acquired
intangibles.
Adjusted
Gross
Profit
is
a
non-GAAP
measure,
see
Appendix
for
reconciliation.
$879.4M
+46%
$603.6M
+57%
$384.6M
30%
16%
8%
32%
15%
7%
28%
16%
8%
19%
12%
6%
1% 2%
2%
39% 39%
53%
55%
56%
35%
55%
2%
8%
19%
17%
24%
3%
5%
11%
Adjusted sales & marketing
Adjusted general & administrative
Adjusted research & development
Transaction & loan losses
18%
13%
5%
2%
Strong revenue growth backed by strategic allocation of capital
Accelerated investments in Q2 for future growth
Chart
depicts
operating
leverage,
which
is
measured
using
Adjusted
Operating
Expenses
as
a
percentage
of
revenue.
Excludes
the
effect
of
stock-based
compensation
expenses
and
related
payroll
taxes,
amortization
of
acquired
intangibles,
and
impairment
of
right-of-use
assets
and
leasehold
improvements.
Adjusted
Operating
Expenses
is
a
non-GAAP
measure,
see
Appendix
for
reconciliation.
Numbers
may
not
foot
due
to
rounding.
2% As a percentage of revenue
• Revenue growth within an annual cohort,
driven by GMV growth and expanded
wallet share, has offset revenue loss from
merchants leaving the platform
• Total combined revenue of all previous
cohorts has also grown consistently
Pre-2019
2019
2020
2021
Annual cohorts provide strong foundation for growth
Revenue by cohort
*Annual
revenue
from
merchant
cohorts
that
joined
the
Shopify
platform
in
the
period
shown.
**Note:
the
first
year
a
merchant
joins
the
platform
may
not
be
12
full
months
and
therefore
is
not
fully
comparable
to
the
subsequent
12
month
periods.
Ambition
Long-term initiatives
Shopify Fulfillment Network
6 River Systems
Shopify Balance
Shop App
Wholesale/B2B
Core
Near-term initiatives
Platform
Shopify Payments
Shopify Shipping
Shopify Capital
Shopify Plus
Expansion
Medium-term initiatives
International Expansion
Retail POS
Shopify Markets
Shop Pay Installments
Shopify Audiences
Expect to accelerate operating expenses in 2022 aimed at growth
investments to build commerce infrastructure for the next decade
Building for the long term
More
Merchants
More
Channels,
Partners &
Capabilities
More
GMV
Growth investments aimed at emerging
the Shopify flywheel well into the future
Secular tailwinds
• Ecommerce growth
• Rise of entrepreneurship
• Consumerization of
the enterprise
Opportunities
• International
• Share of wallet
• Machine learning
Large and growing opportunity
Investment highlights
Massive market with accelerated ecommerce penetration
World-class product
Multichannel commerce platform that enables merchants of
all sizes to sell to anyone, anywhere
Powerful business model
Success-based business model that puts merchants first
Economies of scale
innovation & efficiencies
Millions of merchants generating transaction volumes enables
economies of scale that we share with our merchants
Vast ecosystem
Engaged and expanding partner ecosystem that is
difficult to replicate
Mission driven
Product-driven team focused on making commerce
better for everyone
Healthy balance sheet
Strong balance sheet with a proven, disciplined capital
allocation approach
Significant opportunity ahead
Focus on investing in long-term growth while maintaining
operational discipline and merchant-first orientation
Pastreez
The
appendix.
To supplement our consolidated financial statements, which are prepared and presented in accordance with United States generally accepted accounting principles
("GAAP"), Shopify uses certain non-GAAP financial measures to provide additional information in order to assist investors in understanding our financial and operating
performance.
Adjusted gross profit and adjusted operating expenses are non-GAAP financial measures that exclude the effect of stock-based compensation expenses and related payroll
taxes, amortization of acquired intangibles and, in the case of adjusted operating expenses, a real estate-related impairment charge.
Management uses non-GAAP financial measures internally for financial and operational decision-making and as a means to evaluate period-to-period comparisons. Shopify
believes that these non-GAAP measures provide useful information about operating results, enhance the overall understanding of past financial performance and future
prospects, and allow for greater transparency with respect to key metrics used by management in its financial and operational decision making. Non-GAAP financial
measures are not recognized measures for financial statement presentation under U.S. GAAP and do not have standardized meanings, and may not be comparable to
similar measures presented by other public companies. Such non-GAAP financial measures should be considered as a supplement to, and not as a substitute for, or
superior to, the corresponding measures calculated in accordance with GAAP. See the financial tables below for a reconciliation of the non-GAAP measures.
July 2022
Non-GAAP financial measures
Expressed in US$000s
2019 2020 2021 Q2’21 Q2’22
GAAP Gross profit 865,643 1,541,520 2,481,144 620,860 655,642
add: SBC and SBC-related payroll taxes 4,090 7,472 7,642 1,809 2,409
add: Amortization of acquired intangibles 9,624 19,488 20,399 4,372 6,942
Non-GAAP Gross profit 879,357 1,568,480 2,509,185 627,041 664,993
% of Revenue 56% 54% 54% 56% 51%
GAAP Sales and marketing 472,841 602,048 901,557 201,910 326,902
less: Sales and marketing SBC and SBC-related payroll taxes 38,167 46,390 47,283 10,990 17,375
less: Amortization of acquired intangibles 283 1,548 1,544 386 384
Non-GAAP Sales and marketing 434,391 554,110 852,730 190,534 309,143
% of Revenue 28% 19% 18% 17% 24%
Reconciliation of GAAP to Non-GAAP figures
Expressed in US$000s
2019 2020 2021 Q2’21 Q2’22
GAAP Research and development 355,015 552,127 854,383 183,557 346,667
less: Research and development SBC and SBC-related payroll taxes 104,645 188,249 250,787 55,988 98,767
less: Amortization of acquired intangibles 232 233 206 58 -
Non-GAAP Research and development 250,138 363,645 603,390 127,511 247,900
% of Revenue 16% 12% 13% 11% 19%
GAAP General and administrative 153,765 245,343 374,844 77,966 129,901
less: General and administrative SBC and SBC-related payroll taxes 29,861 52,195 91,337 23,759 22,560
less: Impairment of right-of-use assets and leasehold improvements - 31,623 30,145 - -
Non-GAAP General and administrative 123,904 161,525 253,362 54,207 107,341
% of Revenue 8% 6% 5% 5% 8%
GAAP Transaction and loan losses 25,169 51,849 81,717 17,986 42,380
% of Revenue 2% 2% 2% 2% 3%
GAAP Operating expenses 1,006,790 1,451,367 2,212,501 481,419 845,850
less: Operating SBC and SBC-related payroll taxes 172,673 286,834 389,407 90,737 138,702
less: Amortization of acquired intangibles 515 1,781 1,750 444 384
less: Impairment of right-of-use assets and leasehold improvements - 31,623 30,145 - -
Non-GAAP Operating expenses 833,602 1,131,129 1,791,199 390,238 706,764
% of Revenue 53% 39% 39% 35% 55%
Make commerce
better for everyone.

More Related Content

Similar to Investor-Overview-Deck-Q2-2022.pdf

Investor Presentation - July 2021v1
Investor Presentation - July 2021v1Investor Presentation - July 2021v1
Investor Presentation - July 2021v1Tejal Engman
 
Investor Presentation - July 2021
Investor Presentation - July 2021Investor Presentation - July 2021
Investor Presentation - July 2021Tejal Engman
 
Shopify q1 2017 investor deck
Shopify q1 2017 investor deckShopify q1 2017 investor deck
Shopify q1 2017 investor deckshopifyInvestors
 
hubspot - Quarterly Investor Presentation Q423.pdf
hubspot - Quarterly Investor Presentation Q423.pdfhubspot - Quarterly Investor Presentation Q423.pdf
hubspot - Quarterly Investor Presentation Q423.pdfFrank Bruno
 
DV Third Quarter 2022 Investor Presentation
DV Third Quarter 2022 Investor PresentationDV Third Quarter 2022 Investor Presentation
DV Third Quarter 2022 Investor PresentationTejal81
 
Investor Presentation Q3 2022 Final
Investor Presentation Q3 2022 FinalInvestor Presentation Q3 2022 Final
Investor Presentation Q3 2022 FinalTejal81
 

Similar to Investor-Overview-Deck-Q2-2022.pdf (20)

Investor deck q4 2017
Investor deck q4 2017Investor deck q4 2017
Investor deck q4 2017
 
Investor deck q4 2017
Investor deck q4 2017Investor deck q4 2017
Investor deck q4 2017
 
Q1 2017 investor deck
Q1 2017 investor deckQ1 2017 investor deck
Q1 2017 investor deck
 
Q1 2017 investor deck
Q1 2017 investor deck Q1 2017 investor deck
Q1 2017 investor deck
 
Investor deck q1 2018
Investor deck q1 2018Investor deck q1 2018
Investor deck q1 2018
 
Investor Presentation - July 2021v1
Investor Presentation - July 2021v1Investor Presentation - July 2021v1
Investor Presentation - July 2021v1
 
Investor Presentation - July 2021
Investor Presentation - July 2021Investor Presentation - July 2021
Investor Presentation - July 2021
 
Investor deck q3 2017
Investor deck q3 2017Investor deck q3 2017
Investor deck q3 2017
 
Q4 2016 investor deck
Q4 2016 investor deckQ4 2016 investor deck
Q4 2016 investor deck
 
Q4 2016 investor deck pdf
Q4 2016 investor deck pdfQ4 2016 investor deck pdf
Q4 2016 investor deck pdf
 
Q4 2016 investor deck
Q4 2016 investor deckQ4 2016 investor deck
Q4 2016 investor deck
 
Shopify q1 2017 investor deck
Shopify q1 2017 investor deckShopify q1 2017 investor deck
Shopify q1 2017 investor deck
 
Q1 2017 investor deck
Q1 2017 investor deckQ1 2017 investor deck
Q1 2017 investor deck
 
hubspot - Quarterly Investor Presentation Q423.pdf
hubspot - Quarterly Investor Presentation Q423.pdfhubspot - Quarterly Investor Presentation Q423.pdf
hubspot - Quarterly Investor Presentation Q423.pdf
 
Investor deck q2 2017
Investor deck q2 2017Investor deck q2 2017
Investor deck q2 2017
 
DV Third Quarter 2022 Investor Presentation
DV Third Quarter 2022 Investor PresentationDV Third Quarter 2022 Investor Presentation
DV Third Quarter 2022 Investor Presentation
 
Investor Presentation Q3 2022 Final
Investor Presentation Q3 2022 FinalInvestor Presentation Q3 2022 Final
Investor Presentation Q3 2022 Final
 
Investor deck q2 2017
Investor deck q2 2017Investor deck q2 2017
Investor deck q2 2017
 
Investor deck q2 2017
Investor deck q2 2017Investor deck q2 2017
Investor deck q2 2017
 
Investor deck q2 2017
Investor deck q2 2017Investor deck q2 2017
Investor deck q2 2017
 

More from CharlesSantos684817

ge-healthcare-investor-day-presentation.pdf
ge-healthcare-investor-day-presentation.pdfge-healthcare-investor-day-presentation.pdf
ge-healthcare-investor-day-presentation.pdfCharlesSantos684817
 
lookingforwardwebinardeloitteworkdayanalyticsfinal-210524213844 (1).pdf
lookingforwardwebinardeloitteworkdayanalyticsfinal-210524213844 (1).pdflookingforwardwebinardeloitteworkdayanalyticsfinal-210524213844 (1).pdf
lookingforwardwebinardeloitteworkdayanalyticsfinal-210524213844 (1).pdfCharlesSantos684817
 
Debt investor presentation FINAL.pdf
Debt investor presentation FINAL.pdfDebt investor presentation FINAL.pdf
Debt investor presentation FINAL.pdfCharlesSantos684817
 
workday-fiscal-2023-first-quarter-investor-presentation.pdf
workday-fiscal-2023-first-quarter-investor-presentation.pdfworkday-fiscal-2023-first-quarter-investor-presentation.pdf
workday-fiscal-2023-first-quarter-investor-presentation.pdfCharlesSantos684817
 
macquarie-group-hy23-presentation.pdf
macquarie-group-hy23-presentation.pdfmacquarie-group-hy23-presentation.pdf
macquarie-group-hy23-presentation.pdfCharlesSantos684817
 
GitLab Investor Presentation - Q1-FY23 (1).pdf
GitLab Investor Presentation - Q1-FY23 (1).pdfGitLab Investor Presentation - Q1-FY23 (1).pdf
GitLab Investor Presentation - Q1-FY23 (1).pdfCharlesSantos684817
 
EBIX_Investor_Presentation_web.pdf
EBIX_Investor_Presentation_web.pdfEBIX_Investor_Presentation_web.pdf
EBIX_Investor_Presentation_web.pdfCharlesSantos684817
 
TCS_Investor_Relations_Presentation_3Q22(1).pdf
TCS_Investor_Relations_Presentation_3Q22(1).pdfTCS_Investor_Relations_Presentation_3Q22(1).pdf
TCS_Investor_Relations_Presentation_3Q22(1).pdfCharlesSantos684817
 
BMY-2022-Q2-Results-Investor-Presentation.pdf
BMY-2022-Q2-Results-Investor-Presentation.pdfBMY-2022-Q2-Results-Investor-Presentation.pdf
BMY-2022-Q2-Results-Investor-Presentation.pdfCharlesSantos684817
 
2021_Q4 Earnings Supplemental Material_FINAL.pdf
2021_Q4 Earnings Supplemental Material_FINAL.pdf2021_Q4 Earnings Supplemental Material_FINAL.pdf
2021_Q4 Earnings Supplemental Material_FINAL.pdfCharlesSantos684817
 
Hiscox_Ltd_Results_Analysts_Presentation_Aug_2022.pdf
Hiscox_Ltd_Results_Analysts_Presentation_Aug_2022.pdfHiscox_Ltd_Results_Analysts_Presentation_Aug_2022.pdf
Hiscox_Ltd_Results_Analysts_Presentation_Aug_2022.pdfCharlesSantos684817
 
interim-report-presentation-2022.pdf
interim-report-presentation-2022.pdfinterim-report-presentation-2022.pdf
interim-report-presentation-2022.pdfCharlesSantos684817
 
fy-results-presentation-10-02-2022.pdf
fy-results-presentation-10-02-2022.pdffy-results-presentation-10-02-2022.pdf
fy-results-presentation-10-02-2022.pdfCharlesSantos684817
 
cmd-presentation-may-2022-updated-19-05.pdf
cmd-presentation-may-2022-updated-19-05.pdfcmd-presentation-may-2022-updated-19-05.pdf
cmd-presentation-may-2022-updated-19-05.pdfCharlesSantos684817
 

More from CharlesSantos684817 (20)

ge-healthcare-investor-day-presentation.pdf
ge-healthcare-investor-day-presentation.pdfge-healthcare-investor-day-presentation.pdf
ge-healthcare-investor-day-presentation.pdf
 
lookingforwardwebinardeloitteworkdayanalyticsfinal-210524213844 (1).pdf
lookingforwardwebinardeloitteworkdayanalyticsfinal-210524213844 (1).pdflookingforwardwebinardeloitteworkdayanalyticsfinal-210524213844 (1).pdf
lookingforwardwebinardeloitteworkdayanalyticsfinal-210524213844 (1).pdf
 
ir-presentation.pdf
ir-presentation.pdfir-presentation.pdf
ir-presentation.pdf
 
Debt investor presentation FINAL.pdf
Debt investor presentation FINAL.pdfDebt investor presentation FINAL.pdf
Debt investor presentation FINAL.pdf
 
workday-fiscal-2023-first-quarter-investor-presentation.pdf
workday-fiscal-2023-first-quarter-investor-presentation.pdfworkday-fiscal-2023-first-quarter-investor-presentation.pdf
workday-fiscal-2023-first-quarter-investor-presentation.pdf
 
Rumble_presentation.pdf
Rumble_presentation.pdfRumble_presentation.pdf
Rumble_presentation.pdf
 
macquarie-group-hy23-presentation.pdf
macquarie-group-hy23-presentation.pdfmacquarie-group-hy23-presentation.pdf
macquarie-group-hy23-presentation.pdf
 
GitLab Investor Presentation - Q1-FY23 (1).pdf
GitLab Investor Presentation - Q1-FY23 (1).pdfGitLab Investor Presentation - Q1-FY23 (1).pdf
GitLab Investor Presentation - Q1-FY23 (1).pdf
 
EBIX_Investor_Presentation_web.pdf
EBIX_Investor_Presentation_web.pdfEBIX_Investor_Presentation_web.pdf
EBIX_Investor_Presentation_web.pdf
 
TCS_Investor_Relations_Presentation_3Q22(1).pdf
TCS_Investor_Relations_Presentation_3Q22(1).pdfTCS_Investor_Relations_Presentation_3Q22(1).pdf
TCS_Investor_Relations_Presentation_3Q22(1).pdf
 
Investor-presentation.pdf
Investor-presentation.pdfInvestor-presentation.pdf
Investor-presentation.pdf
 
BMY-2022-Q2-Results-Investor-Presentation.pdf
BMY-2022-Q2-Results-Investor-Presentation.pdfBMY-2022-Q2-Results-Investor-Presentation.pdf
BMY-2022-Q2-Results-Investor-Presentation.pdf
 
2021_Q4 Earnings Supplemental Material_FINAL.pdf
2021_Q4 Earnings Supplemental Material_FINAL.pdf2021_Q4 Earnings Supplemental Material_FINAL.pdf
2021_Q4 Earnings Supplemental Material_FINAL.pdf
 
2Q22-Presentation-Final.pdf
2Q22-Presentation-Final.pdf2Q22-Presentation-Final.pdf
2Q22-Presentation-Final.pdf
 
hy22-slides.pdf
hy22-slides.pdfhy22-slides.pdf
hy22-slides.pdf
 
fy21-slide-template_final.pdf
fy21-slide-template_final.pdffy21-slide-template_final.pdf
fy21-slide-template_final.pdf
 
Hiscox_Ltd_Results_Analysts_Presentation_Aug_2022.pdf
Hiscox_Ltd_Results_Analysts_Presentation_Aug_2022.pdfHiscox_Ltd_Results_Analysts_Presentation_Aug_2022.pdf
Hiscox_Ltd_Results_Analysts_Presentation_Aug_2022.pdf
 
interim-report-presentation-2022.pdf
interim-report-presentation-2022.pdfinterim-report-presentation-2022.pdf
interim-report-presentation-2022.pdf
 
fy-results-presentation-10-02-2022.pdf
fy-results-presentation-10-02-2022.pdffy-results-presentation-10-02-2022.pdf
fy-results-presentation-10-02-2022.pdf
 
cmd-presentation-may-2022-updated-19-05.pdf
cmd-presentation-may-2022-updated-19-05.pdfcmd-presentation-may-2022-updated-19-05.pdf
cmd-presentation-may-2022-updated-19-05.pdf
 

Recently uploaded

Call Girls in Gomti Nagar - 7388211116 - With room Service
Call Girls in Gomti Nagar - 7388211116  - With room ServiceCall Girls in Gomti Nagar - 7388211116  - With room Service
Call Girls in Gomti Nagar - 7388211116 - With room Servicediscovermytutordmt
 
VIP Call Girls Pune Kirti 8617697112 Independent Escort Service Pune
VIP Call Girls Pune Kirti 8617697112 Independent Escort Service PuneVIP Call Girls Pune Kirti 8617697112 Independent Escort Service Pune
VIP Call Girls Pune Kirti 8617697112 Independent Escort Service PuneCall girls in Ahmedabad High profile
 
Call Girls In Connaught Place Delhi ❤️88604**77959_Russian 100% Genuine Escor...
Call Girls In Connaught Place Delhi ❤️88604**77959_Russian 100% Genuine Escor...Call Girls In Connaught Place Delhi ❤️88604**77959_Russian 100% Genuine Escor...
Call Girls In Connaught Place Delhi ❤️88604**77959_Russian 100% Genuine Escor...lizamodels9
 
Pharma Works Profile of Karan Communications
Pharma Works Profile of Karan CommunicationsPharma Works Profile of Karan Communications
Pharma Works Profile of Karan Communicationskarancommunications
 
Eni 2024 1Q Results - 24.04.24 business.
Eni 2024 1Q Results - 24.04.24 business.Eni 2024 1Q Results - 24.04.24 business.
Eni 2024 1Q Results - 24.04.24 business.Eni
 
/:Call Girls In Jaypee Siddharth - 5 Star Hotel New Delhi ➥9990211544 Top Esc...
/:Call Girls In Jaypee Siddharth - 5 Star Hotel New Delhi ➥9990211544 Top Esc.../:Call Girls In Jaypee Siddharth - 5 Star Hotel New Delhi ➥9990211544 Top Esc...
/:Call Girls In Jaypee Siddharth - 5 Star Hotel New Delhi ➥9990211544 Top Esc...lizamodels9
 
BEST Call Girls In Greater Noida ✨ 9773824855 ✨ Escorts Service In Delhi Ncr,
BEST Call Girls In Greater Noida ✨ 9773824855 ✨ Escorts Service In Delhi Ncr,BEST Call Girls In Greater Noida ✨ 9773824855 ✨ Escorts Service In Delhi Ncr,
BEST Call Girls In Greater Noida ✨ 9773824855 ✨ Escorts Service In Delhi Ncr,noida100girls
 
GD Birla and his contribution in management
GD Birla and his contribution in managementGD Birla and his contribution in management
GD Birla and his contribution in managementchhavia330
 
Mondelez State of Snacking and Future Trends 2023
Mondelez State of Snacking and Future Trends 2023Mondelez State of Snacking and Future Trends 2023
Mondelez State of Snacking and Future Trends 2023Neil Kimberley
 
RE Capital's Visionary Leadership under Newman Leech
RE Capital's Visionary Leadership under Newman LeechRE Capital's Visionary Leadership under Newman Leech
RE Capital's Visionary Leadership under Newman LeechNewman George Leech
 
Tech Startup Growth Hacking 101 - Basics on Growth Marketing
Tech Startup Growth Hacking 101  - Basics on Growth MarketingTech Startup Growth Hacking 101  - Basics on Growth Marketing
Tech Startup Growth Hacking 101 - Basics on Growth MarketingShawn Pang
 
Vip Female Escorts Noida 9711199171 Greater Noida Escorts Service
Vip Female Escorts Noida 9711199171 Greater Noida Escorts ServiceVip Female Escorts Noida 9711199171 Greater Noida Escorts Service
Vip Female Escorts Noida 9711199171 Greater Noida Escorts Serviceankitnayak356677
 
Call Girls In Panjim North Goa 9971646499 Genuine Service
Call Girls In Panjim North Goa 9971646499 Genuine ServiceCall Girls In Panjim North Goa 9971646499 Genuine Service
Call Girls In Panjim North Goa 9971646499 Genuine Serviceritikaroy0888
 
Call Girls Pune Just Call 9907093804 Top Class Call Girl Service Available
Call Girls Pune Just Call 9907093804 Top Class Call Girl Service AvailableCall Girls Pune Just Call 9907093804 Top Class Call Girl Service Available
Call Girls Pune Just Call 9907093804 Top Class Call Girl Service AvailableDipal Arora
 
Call Girls In Radisson Blu Hotel New Delhi Paschim Vihar ❤️8860477959 Escorts...
Call Girls In Radisson Blu Hotel New Delhi Paschim Vihar ❤️8860477959 Escorts...Call Girls In Radisson Blu Hotel New Delhi Paschim Vihar ❤️8860477959 Escorts...
Call Girls In Radisson Blu Hotel New Delhi Paschim Vihar ❤️8860477959 Escorts...lizamodels9
 
Lucknow 💋 Escorts in Lucknow - 450+ Call Girl Cash Payment 8923113531 Neha Th...
Lucknow 💋 Escorts in Lucknow - 450+ Call Girl Cash Payment 8923113531 Neha Th...Lucknow 💋 Escorts in Lucknow - 450+ Call Girl Cash Payment 8923113531 Neha Th...
Lucknow 💋 Escorts in Lucknow - 450+ Call Girl Cash Payment 8923113531 Neha Th...anilsa9823
 
Catalogue ONG NUOC PPR DE NHAT .pdf
Catalogue ONG NUOC PPR DE NHAT      .pdfCatalogue ONG NUOC PPR DE NHAT      .pdf
Catalogue ONG NUOC PPR DE NHAT .pdfOrient Homes
 
7.pdf This presentation captures many uses and the significance of the number...
7.pdf This presentation captures many uses and the significance of the number...7.pdf This presentation captures many uses and the significance of the number...
7.pdf This presentation captures many uses and the significance of the number...Paul Menig
 
Progress Report - Oracle Database Analyst Summit
Progress  Report - Oracle Database Analyst SummitProgress  Report - Oracle Database Analyst Summit
Progress Report - Oracle Database Analyst SummitHolger Mueller
 
Russian Faridabad Call Girls(Badarpur) : ☎ 8168257667, @4999
Russian Faridabad Call Girls(Badarpur) : ☎ 8168257667, @4999Russian Faridabad Call Girls(Badarpur) : ☎ 8168257667, @4999
Russian Faridabad Call Girls(Badarpur) : ☎ 8168257667, @4999Tina Ji
 

Recently uploaded (20)

Call Girls in Gomti Nagar - 7388211116 - With room Service
Call Girls in Gomti Nagar - 7388211116  - With room ServiceCall Girls in Gomti Nagar - 7388211116  - With room Service
Call Girls in Gomti Nagar - 7388211116 - With room Service
 
VIP Call Girls Pune Kirti 8617697112 Independent Escort Service Pune
VIP Call Girls Pune Kirti 8617697112 Independent Escort Service PuneVIP Call Girls Pune Kirti 8617697112 Independent Escort Service Pune
VIP Call Girls Pune Kirti 8617697112 Independent Escort Service Pune
 
Call Girls In Connaught Place Delhi ❤️88604**77959_Russian 100% Genuine Escor...
Call Girls In Connaught Place Delhi ❤️88604**77959_Russian 100% Genuine Escor...Call Girls In Connaught Place Delhi ❤️88604**77959_Russian 100% Genuine Escor...
Call Girls In Connaught Place Delhi ❤️88604**77959_Russian 100% Genuine Escor...
 
Pharma Works Profile of Karan Communications
Pharma Works Profile of Karan CommunicationsPharma Works Profile of Karan Communications
Pharma Works Profile of Karan Communications
 
Eni 2024 1Q Results - 24.04.24 business.
Eni 2024 1Q Results - 24.04.24 business.Eni 2024 1Q Results - 24.04.24 business.
Eni 2024 1Q Results - 24.04.24 business.
 
/:Call Girls In Jaypee Siddharth - 5 Star Hotel New Delhi ➥9990211544 Top Esc...
/:Call Girls In Jaypee Siddharth - 5 Star Hotel New Delhi ➥9990211544 Top Esc.../:Call Girls In Jaypee Siddharth - 5 Star Hotel New Delhi ➥9990211544 Top Esc...
/:Call Girls In Jaypee Siddharth - 5 Star Hotel New Delhi ➥9990211544 Top Esc...
 
BEST Call Girls In Greater Noida ✨ 9773824855 ✨ Escorts Service In Delhi Ncr,
BEST Call Girls In Greater Noida ✨ 9773824855 ✨ Escorts Service In Delhi Ncr,BEST Call Girls In Greater Noida ✨ 9773824855 ✨ Escorts Service In Delhi Ncr,
BEST Call Girls In Greater Noida ✨ 9773824855 ✨ Escorts Service In Delhi Ncr,
 
GD Birla and his contribution in management
GD Birla and his contribution in managementGD Birla and his contribution in management
GD Birla and his contribution in management
 
Mondelez State of Snacking and Future Trends 2023
Mondelez State of Snacking and Future Trends 2023Mondelez State of Snacking and Future Trends 2023
Mondelez State of Snacking and Future Trends 2023
 
RE Capital's Visionary Leadership under Newman Leech
RE Capital's Visionary Leadership under Newman LeechRE Capital's Visionary Leadership under Newman Leech
RE Capital's Visionary Leadership under Newman Leech
 
Tech Startup Growth Hacking 101 - Basics on Growth Marketing
Tech Startup Growth Hacking 101  - Basics on Growth MarketingTech Startup Growth Hacking 101  - Basics on Growth Marketing
Tech Startup Growth Hacking 101 - Basics on Growth Marketing
 
Vip Female Escorts Noida 9711199171 Greater Noida Escorts Service
Vip Female Escorts Noida 9711199171 Greater Noida Escorts ServiceVip Female Escorts Noida 9711199171 Greater Noida Escorts Service
Vip Female Escorts Noida 9711199171 Greater Noida Escorts Service
 
Call Girls In Panjim North Goa 9971646499 Genuine Service
Call Girls In Panjim North Goa 9971646499 Genuine ServiceCall Girls In Panjim North Goa 9971646499 Genuine Service
Call Girls In Panjim North Goa 9971646499 Genuine Service
 
Call Girls Pune Just Call 9907093804 Top Class Call Girl Service Available
Call Girls Pune Just Call 9907093804 Top Class Call Girl Service AvailableCall Girls Pune Just Call 9907093804 Top Class Call Girl Service Available
Call Girls Pune Just Call 9907093804 Top Class Call Girl Service Available
 
Call Girls In Radisson Blu Hotel New Delhi Paschim Vihar ❤️8860477959 Escorts...
Call Girls In Radisson Blu Hotel New Delhi Paschim Vihar ❤️8860477959 Escorts...Call Girls In Radisson Blu Hotel New Delhi Paschim Vihar ❤️8860477959 Escorts...
Call Girls In Radisson Blu Hotel New Delhi Paschim Vihar ❤️8860477959 Escorts...
 
Lucknow 💋 Escorts in Lucknow - 450+ Call Girl Cash Payment 8923113531 Neha Th...
Lucknow 💋 Escorts in Lucknow - 450+ Call Girl Cash Payment 8923113531 Neha Th...Lucknow 💋 Escorts in Lucknow - 450+ Call Girl Cash Payment 8923113531 Neha Th...
Lucknow 💋 Escorts in Lucknow - 450+ Call Girl Cash Payment 8923113531 Neha Th...
 
Catalogue ONG NUOC PPR DE NHAT .pdf
Catalogue ONG NUOC PPR DE NHAT      .pdfCatalogue ONG NUOC PPR DE NHAT      .pdf
Catalogue ONG NUOC PPR DE NHAT .pdf
 
7.pdf This presentation captures many uses and the significance of the number...
7.pdf This presentation captures many uses and the significance of the number...7.pdf This presentation captures many uses and the significance of the number...
7.pdf This presentation captures many uses and the significance of the number...
 
Progress Report - Oracle Database Analyst Summit
Progress  Report - Oracle Database Analyst SummitProgress  Report - Oracle Database Analyst Summit
Progress Report - Oracle Database Analyst Summit
 
Russian Faridabad Call Girls(Badarpur) : ☎ 8168257667, @4999
Russian Faridabad Call Girls(Badarpur) : ☎ 8168257667, @4999Russian Faridabad Call Girls(Badarpur) : ☎ 8168257667, @4999
Russian Faridabad Call Girls(Badarpur) : ☎ 8168257667, @4999
 

Investor-Overview-Deck-Q2-2022.pdf

  • 2. This presentation contains forward-looking statements that are based on our management’s current estimates, beliefs and assumptions, which are based on management’s perception of historic trends, current conditions and expected future developments, as well as other factors management believes are appropriate in the circumstances. Although we believe that the plans, intentions, expectations, assumptions and strategies reflected in these forward-looking statements are reasonable, these statements relate to future events or our future financial performance, and involve known and unknown risks, uncertainties and other factors that may cause our actual results to be materially different from any future results expressed or implied by these forward-looking statements. Although the forward-looking statements contained in this presentation are based upon what we believe are reasonable assumptions, investors are cautioned against placing undue reliance on these statements since actual results may vary from the forward-looking statements. Forward-looking statements involve known and unknown risks, uncertainties and other factors, which are, in some cases, beyond our control and which could materially affect our results. These risks include the risks due to the uncertainty around the duration and scope of the COVID-19 pandemic and the impact of the pandemic and actions taken in response on global and regional economies and economic activity and are described in further detail in our Management's Discussion and Analysis for the year ended December 31, 2021 and in the section entitled “Risk Factors” in our Annual Information Form for the year ended December 31, 2021 available on www.sec.gov and on www.sedar.com and elsewhere in our filings with regulatory agencies. If one or more of these risks or uncertainties occur, or if our underlying assumptions prove to be incorrect, actual results may vary significantly from those expressed, implied or projected by the forward-looking statements. References to long-term trends in our model are forward-looking and made as of the current date. Nothing in this presentation should be regarded as a representation by any person that these long-term trends will be achieved and we undertake no duty to update these long-term trends or any other forward-looking statements contained in this presentation, except as required by law. July 2022 We believe that the case studies presented in this presentation provide a representative sample of how our merchants have been able to use various features of our platform to grow their respective businesses. References in this presentation to increased visits, growth and sales following implementation of our platform do not necessarily mean that our platform was the only factor contributing to such increases. To supplement the financial measures prepared in accordance with generally accepted accounting principles (GAAP), we use non-GAAP financial measures that exclude certain items. Non-GAAP financial measures are not prepared in accordance with GAAP; therefore, the information is not necessarily comparable to other companies and should be considered as a supplement to, not a substitute for, or superior to, the corresponding measures calculated in accordance with GAAP. Please refer to the slides titled “Non-GAAP Financial Measures” and “Reconciliation of GAAP to Non-GAAP Figures” for further information. This presentation contains information concerning our industry, including information relating to the size of the markets in which we participate, that are based on industry surveys and publications or other publicly available information, other third-party survey data and research reports. This information involves many assumptions and limitations, there can be no guarantee as to the accuracy or reliability of such assumptions and you are cautioned not to give undue weight to this information. While we believe this information to be reliable, it has not been independently verified. This presentation contains trademarks, service marks, trade names and copyrights of Shopify and other companies, which are the property of their respective owners. Safe harbor
  • 3. One platform, every channel, any device Building essential internet infrastructure for commerce Online Marketplaces Brick & Mortar Pop-Ups + Online
  • 4. Single integrated back office Making commerce creative, and the important easy Order Management Inventory & Fulfillment Shipping Apps Payments Capital Marketing Analytics
  • 6. Basic Advanced Shopify Shopify Plus $29 per month $299 per month $79 per month $2,000+ per month + variable platform fee Entrepreneurs SMBs Larger Brands Shopify is the entrepreneurship company for merchants of all sizes Our market Lite $9 per month
  • 7. Anyone who wants to make more money from their site than they pay for it Total addressable market TAM $160B (1) Merchants defined as retailers with fewer than 500 employees. Includes commercially located businesses, sole proprietorships and home-based businesses. Does not include early-stage entrepreneurs or enterprises. (2) Average revenue per merchant of approximately $2,354 based on ARPU for 2021 and 68 million retail businesses globally (Source: AMI Partners, 2020) Entrepreneurs SMBs Larger Brands
  • 8. Entrepreneurs SMBs Larger Brands Merchant acquisition ✓ Shopify Plus Sales ✓ Partners and Affiliates ✓ Global Events ✓ Content Marketing ✓ Shopify Blog ✓ Digital Advertising ✓ Search Engine Marketing ✓ Brand and Studios ✓ Shopify POS Sales ✓ Word of Mouth ✓ Shopify Support ✓ Offline Marketing Casting a very wide net
  • 9. Larger brands Capturing the shift from SMB to large brands
  • 10. Indigenous Box Online store selling quarterly subscription boxes with curated products crafted by Indigenous entrepreneurs ✓ Shopify Payments ✓ Shop Pay ✓ Shopify Email Our platform grows with our merchants XO Marshmallow Sells handmade gourmet marshmallows direct-to-consumer on their online store and in-person at the world’s first marshmallow café Blender Bottle Market-leading fitness and nutrition brand known for their proprietary shaker bottles ✓ Shopify Payments ✓ Shop Pay ✓ Shopify Pay Installments ✓ Shopify Capital ✓ Shopify Payments ✓ Shop Pay ✓ Shop Pay Installments ✓ Shopify Audiences Joined Shopify in 2022 Joined Shopify in 2016 Joined Shopify Plus in 2015 Entrepreneur SMB Large Brands
  • 11. Merchant Journey Merchant-centred business model where merchant solutions grow hand-in-hand with merchant success Upgraded to the Advanced Plan Adopted Shopify Capital Adopted Shopify Audiences 2022 2021 2020 2019 Joined Shopify and subscribed to the Shopify Plan Adopted Shopify Payments and Shop Pay Upgraded to Shopify Plus Adopted Shop Pay Installments
  • 12. Ecommerce Powerful trends in our favor Source: Euromonitor, Blue Cart, Statista Note: Ecommerce market based on global goods market growth. Direct-to-consumer growth based on 2021 YoY growth. 1 Reflects FY21 YoY growth. 21% 2019 - 2021 global ecommerce CAGR 69% 2019 - 2021 Shopify GMV CAGR Direct-to-consumer Digital payments 15% Direct-to-consumer market growth in 2021 1M New Shopify merchants from 2019 to 2021 24% Global digital payments growth in 2021 59% GPV YoY growth1 Placeholder - find new image
  • 13. +75% 57 Million* More consumers are buying from Shopify stores +63% +32% +38% +52% +31% 2017 2018 2019 2020 2021 2015 2016 100 Million 163 Million 216 Million 300 Million 457 Million 597 Million *Number of online shoppers
  • 14. Multi-Channel Pinterest Amazon Facebook Google Instagram eBay Amazon TikTok Walmart Shop Pay on Facebook, Instagram, & Google JD.com Spotify Twitter YouTube Ecosystem App Store Theme Store Plus Partner Program All-New App Store Experts Marketplace Shipping & Fulfillment Shopify Shipping Shopify Fulfillment Network Deliverr Shop Promise Retail Shopify POS Locations All-New Shopify POS Tap & Chip Reader Tap to Pay (iPhone) Money Shopify Payments Shopify Capital Shop Pay Fraud Protect Local Payment Methods Multi-Currency Shopify Balance Shop Pay Installments Shopify Protect Marketing Marketing Dashboard Shopify Email Shop Shopify Markets Shopify Inbox Shopify Audiences 2009 - 2014 2015 - 2016 2017 - 2018 2019 - 2020 2021 - 2022 Merchant-first focus through product innovation Lowering barriers, simplifying operations, catalyzing merchant sales
  • 15. 8,000+ Apps extending product capabilities Ecosystem Partners referred at least one merchant to Shopify in the last 12 months 40,000+ Favorable terms encourage greater innovation on behalf of merchants while increasing the opportunity for developers to grow their businesses Rich & extensive partner ecosystem Figures as of December 31, 2021
  • 16. Creating Economic Impact* Making commerce better for everyone in everything we do * 2021 data from The Shopify Effect Combating Climate Change $5M minimum annual spend for Shopify’s Sustainability Fund Committed to carbon-neutral operations and platform Offset carbon emissions on all orders placed on our platform during BFCM 2021 Launched Frontier, the world’s largest combined financial commitment to buy carbon removal, in partnership with 4 other companies Signed a power purchase agreement to power 100% of office buildings and employee home offices across North America with wind energy Making a Social Impact Operation HOPE to help create 1M new Black-owned businesses by 2030 Government partnerships to help bring thousands of small businesses online Increase visibility for local shops, sustainable shops, Black-owned businesses, Asian-owned businesses, women-owned businesses, LGBTQ+ businesses, and Indigenous-owned businesses through Shop app
  • 17. Growth-minded culture + + + + Recruit talented, deeply caring individuals Digital by Design allows employees to easily work almost anywhere in the world Invest heavily in personal growth and development Build a team that reflects the world we live in
  • 19. Strong & competitive market position Share of US retail ecommerce sales 2021 Source: eMarketer, October 2021 Shopify market share based on Shopify’s 2021 US GMV (excluding merchant sales made through POS)
  • 21. Q2 2017 Q2 2018 Q2 2019 35% CAGR Q2 2020 Q2 2021 $107.2M Q2 2022 $23.7M More new merchants building businesses on the platform Q2 YoY MRR grew as more merchants joined the platform… *Monthly Recurring Revenue, or MRR, is calculated at the end of each period by multiplying the number of merchants who have subscription plans with us at the period end date by the average monthly subscription plan fee in effect on the last day of that period, assuming they maintain their subscription plans the following month. **Due to the extended 90-day free trial (offered from March 21 through May 31, 2020), MRR that normally would have been counted in Q2 2020 did not start getting charged until Q3 2020.
  • 22. 24% 14% $196.4M $366.4M +10% 62% 16% 21% 63% 19% 21% 60% 17% 22% 61% 59% 20% 22% Monthly Recurring Revenue - Core Apps, Themes, Domains, Shopify Plus Platform Fee Revenue* Monthly Recurring Revenue - Shopify Plus 63% 23% 14% $334.2M +70% 61% 24% 14% Subscription solutions revenue growth in Q2 …contributing to solid Subscription Solutions revenue growth *Approximate Apps, Themes, Domains, Shopify Plus Platform Fee Revenue is calculated by averaging current and previous quarter MRR, multiplying by 3 and subtracting total from Subscription Solutions revenue. Numbers may not foot due to rounding. 63% 27% 10% 60% 13% 27%
  • 23. $26.3B $41.1B +56% $61.1B +49% $42.2B $46.9B +11% $119.6B +96% $175.4B +47% Merchants are joining, scaling and succeeding on Shopify Strong consistent GMV growth *Gross Merchandise Volume, or GMV, represents the total dollar value of orders facilitated on the Shopify platform including certain apps and channels for which a revenue-sharing arrangement is in place in the period, net of refunds, and inclusive of shipping and handling, duty and value-added taxes.
  • 24. Shopify Payments $20.3B Gross Payments Volume (GPV)* Shopify Capital Merchant Cash Advances and Loans 48% GMV Penetration 53% GMV Penetration $416.4M +15% $363.0M $24.9B +22% Increased adoption of Shopify products over time *Gross Payments Volume (GPV) is the amount of GMV processed through Shopify Payments.
  • 25. $627.0M $665.0M +6% $1,568.5M +78% $2,509.2M +60% Powerful business model that focuses on gross profit dollar growth Solid adjusted gross profit* growth *Excludes the effect of stock-based compensation (SBC) expenses and related payroll taxes, and amortization of acquired intangibles. Adjusted Gross Profit is a non-GAAP measure, see Appendix for reconciliation. $879.4M +46% $603.6M +57% $384.6M
  • 26. 30% 16% 8% 32% 15% 7% 28% 16% 8% 19% 12% 6% 1% 2% 2% 39% 39% 53% 55% 56% 35% 55% 2% 8% 19% 17% 24% 3% 5% 11% Adjusted sales & marketing Adjusted general & administrative Adjusted research & development Transaction & loan losses 18% 13% 5% 2% Strong revenue growth backed by strategic allocation of capital Accelerated investments in Q2 for future growth Chart depicts operating leverage, which is measured using Adjusted Operating Expenses as a percentage of revenue. Excludes the effect of stock-based compensation expenses and related payroll taxes, amortization of acquired intangibles, and impairment of right-of-use assets and leasehold improvements. Adjusted Operating Expenses is a non-GAAP measure, see Appendix for reconciliation. Numbers may not foot due to rounding. 2% As a percentage of revenue
  • 27. • Revenue growth within an annual cohort, driven by GMV growth and expanded wallet share, has offset revenue loss from merchants leaving the platform • Total combined revenue of all previous cohorts has also grown consistently Pre-2019 2019 2020 2021 Annual cohorts provide strong foundation for growth Revenue by cohort *Annual revenue from merchant cohorts that joined the Shopify platform in the period shown. **Note: the first year a merchant joins the platform may not be 12 full months and therefore is not fully comparable to the subsequent 12 month periods.
  • 28. Ambition Long-term initiatives Shopify Fulfillment Network 6 River Systems Shopify Balance Shop App Wholesale/B2B Core Near-term initiatives Platform Shopify Payments Shopify Shipping Shopify Capital Shopify Plus Expansion Medium-term initiatives International Expansion Retail POS Shopify Markets Shop Pay Installments Shopify Audiences Expect to accelerate operating expenses in 2022 aimed at growth investments to build commerce infrastructure for the next decade Building for the long term
  • 29. More Merchants More Channels, Partners & Capabilities More GMV Growth investments aimed at emerging the Shopify flywheel well into the future Secular tailwinds • Ecommerce growth • Rise of entrepreneurship • Consumerization of the enterprise Opportunities • International • Share of wallet • Machine learning
  • 30. Large and growing opportunity Investment highlights Massive market with accelerated ecommerce penetration World-class product Multichannel commerce platform that enables merchants of all sizes to sell to anyone, anywhere Powerful business model Success-based business model that puts merchants first Economies of scale innovation & efficiencies Millions of merchants generating transaction volumes enables economies of scale that we share with our merchants Vast ecosystem Engaged and expanding partner ecosystem that is difficult to replicate Mission driven Product-driven team focused on making commerce better for everyone Healthy balance sheet Strong balance sheet with a proven, disciplined capital allocation approach Significant opportunity ahead Focus on investing in long-term growth while maintaining operational discipline and merchant-first orientation
  • 32. To supplement our consolidated financial statements, which are prepared and presented in accordance with United States generally accepted accounting principles ("GAAP"), Shopify uses certain non-GAAP financial measures to provide additional information in order to assist investors in understanding our financial and operating performance. Adjusted gross profit and adjusted operating expenses are non-GAAP financial measures that exclude the effect of stock-based compensation expenses and related payroll taxes, amortization of acquired intangibles and, in the case of adjusted operating expenses, a real estate-related impairment charge. Management uses non-GAAP financial measures internally for financial and operational decision-making and as a means to evaluate period-to-period comparisons. Shopify believes that these non-GAAP measures provide useful information about operating results, enhance the overall understanding of past financial performance and future prospects, and allow for greater transparency with respect to key metrics used by management in its financial and operational decision making. Non-GAAP financial measures are not recognized measures for financial statement presentation under U.S. GAAP and do not have standardized meanings, and may not be comparable to similar measures presented by other public companies. Such non-GAAP financial measures should be considered as a supplement to, and not as a substitute for, or superior to, the corresponding measures calculated in accordance with GAAP. See the financial tables below for a reconciliation of the non-GAAP measures. July 2022 Non-GAAP financial measures
  • 33. Expressed in US$000s 2019 2020 2021 Q2’21 Q2’22 GAAP Gross profit 865,643 1,541,520 2,481,144 620,860 655,642 add: SBC and SBC-related payroll taxes 4,090 7,472 7,642 1,809 2,409 add: Amortization of acquired intangibles 9,624 19,488 20,399 4,372 6,942 Non-GAAP Gross profit 879,357 1,568,480 2,509,185 627,041 664,993 % of Revenue 56% 54% 54% 56% 51% GAAP Sales and marketing 472,841 602,048 901,557 201,910 326,902 less: Sales and marketing SBC and SBC-related payroll taxes 38,167 46,390 47,283 10,990 17,375 less: Amortization of acquired intangibles 283 1,548 1,544 386 384 Non-GAAP Sales and marketing 434,391 554,110 852,730 190,534 309,143 % of Revenue 28% 19% 18% 17% 24% Reconciliation of GAAP to Non-GAAP figures
  • 34. Expressed in US$000s 2019 2020 2021 Q2’21 Q2’22 GAAP Research and development 355,015 552,127 854,383 183,557 346,667 less: Research and development SBC and SBC-related payroll taxes 104,645 188,249 250,787 55,988 98,767 less: Amortization of acquired intangibles 232 233 206 58 - Non-GAAP Research and development 250,138 363,645 603,390 127,511 247,900 % of Revenue 16% 12% 13% 11% 19% GAAP General and administrative 153,765 245,343 374,844 77,966 129,901 less: General and administrative SBC and SBC-related payroll taxes 29,861 52,195 91,337 23,759 22,560 less: Impairment of right-of-use assets and leasehold improvements - 31,623 30,145 - - Non-GAAP General and administrative 123,904 161,525 253,362 54,207 107,341 % of Revenue 8% 6% 5% 5% 8% GAAP Transaction and loan losses 25,169 51,849 81,717 17,986 42,380 % of Revenue 2% 2% 2% 2% 3% GAAP Operating expenses 1,006,790 1,451,367 2,212,501 481,419 845,850 less: Operating SBC and SBC-related payroll taxes 172,673 286,834 389,407 90,737 138,702 less: Amortization of acquired intangibles 515 1,781 1,750 444 384 less: Impairment of right-of-use assets and leasehold improvements - 31,623 30,145 - - Non-GAAP Operating expenses 833,602 1,131,129 1,791,199 390,238 706,764 % of Revenue 53% 39% 39% 35% 55%