Download to read offline

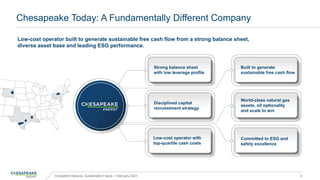
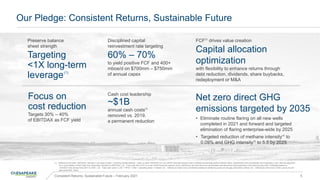
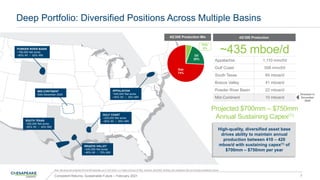


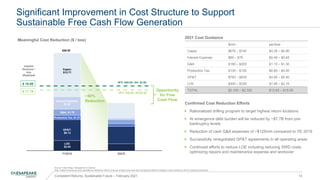
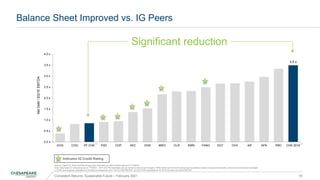
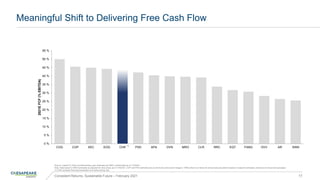
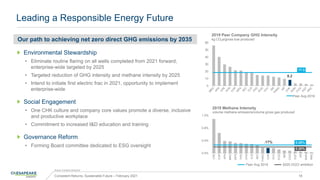
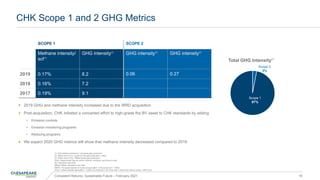


Chesapeake Energy is committed to generating sustainable free cash flow from a strong balance sheet and diverse low-cost asset base, while achieving top ESG performance. The company aims to preserve its balance sheet strength with less than 1x long-term leverage. It expects to reinvest 60-70% of annual capital expenditures of $700-750 million to produce over 400 thousand barrels of oil equivalent per day and achieve a 30-40% free cash flow yield. Chesapeake also targets net zero direct greenhouse gas emissions by 2035 by eliminating routine flaring and reducing methane and GHG intensities to lead the industry in ESG excellence and safety.