2
Disclaimer
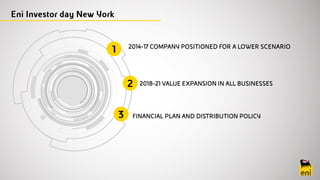
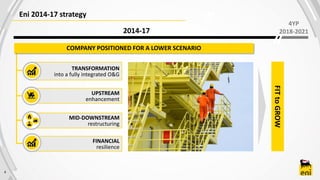
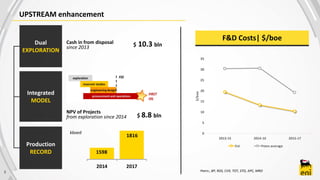
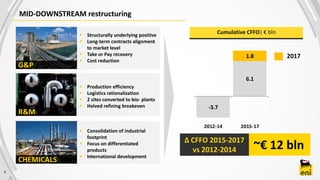
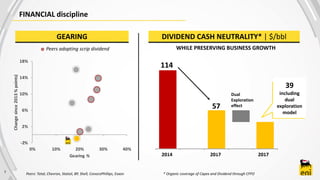
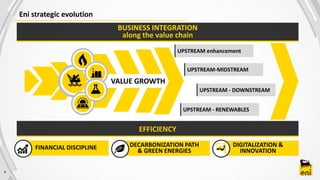
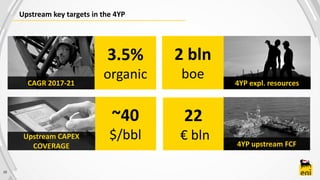
This document contains forward-looking statements regarding future events and the future results of Eni that are based on current expectations, estimates, forecasts, and projections about the
industries in which Eni operates and the beliefs and assumptions of the management of Eni. In addition, Eni’s management may make forward-looking statements orally to analysts, investors,
representatives of the media and others. In particular, among other statements, certain statements with regard to management objectives, trends in results of operations, margins, costs, return on
capital, risk management and competition are forward looking in nature. Words such as ‘expects’, ‘anticipates’, ‘targets’, ‘goals’, ‘projects’, ‘intends’, ‘plans’, ‘believes’, ‘seeks’, ‘estimates’,
variations of such words, and similar expressions are intended to identify such forward-looking statements. These forward-looking statements are not guarantees of future performance and are
subject to risks, uncertainties, and assumptions that are difficult to predict because they relate to events and depend on circumstances that will occur in the future. Therefore, Eni’s actual results
may differ materially and adversely from those expressed or implied in any forward-looking statements. Factors that might cause or contribute to such differences include, but are not limited to,
those discussed in Eni’s Annual Reports on Form 20-F filed with the U.S. Securities and Exchange Commission (the “SEC”) under the section entitled “Risk factors” and in other sections. These
factors include but are not limited to:
Fluctuations in the prices of crude oil, natural gas, oil products and chemicals;
• Strong competition worldwide to supply energy to the industrial, commercial and residential energy markets;
• Safety, security, environmental and other operational risks, and the costs and risks associated with the requirement to comply with related regulation, including regulation on GHG emissions;
• Risks associated with the exploration and production of oil and natural gas, including the risk that exploration efforts may be unsuccessful and the operational risks associated with development
projects;
• Uncertainties in the estimates of natural gas reserves;
• The time and expense required to develop reserves;
• Material disruptions arising from political, social and economic instability, particularly in light of the areas in which Eni operates;
• Risks associated with the trading environment, competition, and demand and supply dynamics in the natural gas market, including the impact under Eni take-or-pay long-term gas supply
contracts;
• Laws and regulations related to climate change;
• Risks related to legal proceedings and compliance with anti-corruption legislation;
• Risks arising from potential future acquisitions; and
• Exposure to exchange rate, interest rate and credit risks.
Any forward-looking statements made by or on behalf of Eni speak only as of the date they are made. Eni does not undertake to update forward-looking statements to reflect any changes in Eni’s
expectations with regard thereto or any changes in events, conditions or circumstances on which any such statement is based. The reader should, however, consult any further disclosures Eni may
make in documents it files with or furnishes to the SEC and Consob.
4
Eni 2014-17 strategy
2014-17
UPSTREAM
enhancement
MID-DOWNSTREAM
restructuring
FINANCIAL
resilience
TRANSFORMATION
into a fully integrated O&G
FITtoGROW
COMPANY POSITIONED FOR A LOWER SCENARIO
4YP
2018-2021
5
UPSTREAM enhancement
Cash in from disposal
since 2013
NPV of Projects
from exploration since 2014
Dual
EXPLORATION
Integrated
MODEL
Production
RECORD
$ 10.3 bln
$ 8.8 bln
kboed
F&D Costs| $/boe
Peers:, BP, RDS, CVX, TOT, STO, APC, MRO
0
5
10
15
20
25
30
35
2013-15 2014-16 2015-17
$/boe
Eni Peers average
1598
1816
2014 2017
∆ CFFO 2015-2017
vs 2012-2014
6
MID-DOWNSTREAM restructuring
G&P
2017
~€ 12 bln
R&M
CHEMICALS
 Structurally underlying positive
 Long-term contracts alignment
to market level
 Take or Pay recovery
 Cost reduction
 Consolidation of industrial
footprint
 Focus on differentiated
products
 International development
 Production efficiency
 Logistics rationalization
 2 sites converted to bio- plants
 Halved refining breakeven
Cumulative CFFO| € bln
-3.7
6.1
1.8
2012-14 2015-17
7
FINANCIAL discipline
* Organic coverage of Capex and Dividend through CFFO
2014 2017
Dual
Exploration
effect57
2017
GEARING DIVIDEND CASH NEUTRALITY* | $/bbl
WHILE PRESERVING BUSINESS GROWTH
39
including
dual
exploration
model
Peers adopting scrip dividend
Peers: Total, Chevron, Statoil, BP, Shell, ConocoPhillips, Exxon
-2%
2%
6%
10%
14%
18%
0% 10% 20% 30% 40%
Changesince2013%points)
Gearing %
114
1 2 3 4 5
3
Eni strategic evolution
BUSINESS INTEGRATION
along the value chain
UPSTREAM-MIDSTREAM
UPSTREAM - DOWNSTREAM
UPSTREAM - RENEWABLES
UPSTREAM enhancement
EFFICIENCY
DECARBONIZATION PATH
& GREEN ENERGIES
DIGITALIZATION &
INNOVATIONFINANCIAL DISCIPLINE
9
VALUE GROWTH
10
Upstream key targets in the 4YP
CAGR 2017-21
3.5%
organic
~40
$/bbl
4YP expl. resources
Upstream CAPEX
COVERAGE
2 bln
boe
4YP upstream FCF
22
€ bln
2 BILLION BOE EQUITY
A global range of exploration opportunities
Eninet
acreage|
sqkm
Transform
Margin
Barents Sea
North Slope
Angoche
Basin
Mexico
offshore
Egypt &
Levantine
Lower Congo
Basin
Oman
offshore
Lamu
Basin
Durban
Basin
East
Kalimantan
Vietnam
Myanmar
100
Mln acres
at YE 2017
Net Acreage
10
bln boe
3.5
€ bln
Equity
Risked Potential
4YP Spending *
Morocco
offshore
Porcupine
Basin
* Including G&G costs
11
4YP EXPLORATION TARGET
Mexico: the power of exploration
12
Area 1
 Eni Operator with 100% working interest
 Fields: Amoca, Miztón, Tecoalli
 Shallow water
 2 Billion boe OHIP (+ 1.2 vs original estimate)
 Progress: PoD under authorization
 Production start-up: 1H 2019
 Plateau 100%: 90 kboed @2022
New blocks recently acquired in Sureste – Cuenca Salina Basin
 Operator of Blocks 7, 10, 14, 28 in Campeche Bay
 Operator of Deep Water Block 24
 Two exploration wells planned in 1H 2019 in the new blocks
Ciudad del
Carmen
Area 1
Eni Mexico 100%
Zona Sur
Block 7
Eni Mexico (45%),
Capricorn (30%)
Citla (25%)
Block 10
Eni Mexico 100% Block 14
Eni Mexico (60%)
Citla (40%)
Block 24
Eni Mexico (65%)
Qatar Petroleum (35%)
Low cost developmentHigh Prospectivity
A rapidly-growing / high-quality portfolio, coupled
with a fast track development of material resources
28
Block 28
Eni Mexico (75%),
Lukoil (25%)
2021
 OCTP Gas
 West Hub - Ochigufu
 Bahr Essalam Ph.2
 Wafa Compression
13
Ramp-ups and start-ups driving growth
 Zohr
 Jangkrik Complex
 Nidoco Ph. 2/3
 East Hub
 OCTP Oil
 Nenè Ph. 2A
 CAFC
 Abu Dhabi fields
MAIN ONSTREAM
PROJECTS
2018
 Area 1 Mexico
 Baltim SW (Barakish)
 West Hub - Vandumbu
 Trestakk
 Nenè ph. 2B
 Smorbukk North
 Cassiopea
 KPC Debottlenecking
 BRN New Pipeline
 Merakes
 Melehia deep Ph. 2
2019
2020
1816
CAGR 2017-2021
3.5%
CAGR 2021-2025
3%
2018
4%
MAJOR START-UPS15OIL & GAS PRODUCTION | kboed
2017 2018 2021 2025
base production start-ups/ramp-ups
14
Production trends
2017 2021
Mexico
Abu Dhabi
New producing Countries
GEOGRAPHICAL SPLIT %
North Africa
Europe
Caspian
Africa Sub-Saharan
America
Asia Pacific &
Middle East
15
Asia Pacific & Middle East: an expanding high-potential area
>250 kboed
Asia Pacific and Middle East
Production contribution @ 2021
Oman
offshore
East
Kalimantan
Vietnam
Myanmar
MERAKES
JANGKRIK
ABU DHABINASR
UMM SHAIF
LOWER ZAKUM
Exploration activity
Zohr is ramping up
16
Accelerated start-up
 6 wells + 26’’ line + 14” line
 1 control platform + 1 umbilical
 New onshore plant (EPF + 3 trains)
 Current gross production: 400 Mcfd
Ramp-up to plateau
 14 additional wells + 2x30’’ export lines
 1 umbilical
 Onshore plant extension (4 trains)
 Gross Plateau 2.7 Bcfd by 2019
Plateau Extension
 5 additional wells + 2x30’’ export lines
 1 umbilical
 Onshore compression
 Total of 8 gas treatment trains
2.7
RAMP UP BCF/D
0.4
2.0
Accelerated start-up
Ramp-up to plateau
01/2018 01/2019 01/2020
2017 2018 2020-21
4YP start up
25.2
17
Value expansion of production growth
CASH FLOW PER BARREL | $/boe
18
@ $60/bl scenario
4YP start up
24.5
legacy
15.8 legacy
15.5
HIGH QUALITY LONG TERM CASH FLOW
16.7
17.5
@ 2017 scenario
14
$22/boe
@ $70
scenario
3
5
7
9
11
13
2017 2018 End of plan
18
The rise of upstream cash flow
Brent $/bbl 60 60 60
Capex
Upstream
FULL COVERAGE OF DIVIDEND WITH UPSTREAM FCF
Upside
@ $ 70/bl
Upstream CFFO
€ bln
19
Mid-downstream key targets
2
€ bln
4.7
€ bln
Total 4YP FCFEBIT end of plan
Gas & LNG Marketing and Power
20
Gas & Power - bigger and stronger
€ 2.4 bln
FCF 2018-21
Gas & LNG
Marketing and
Power
Retail
EBIT | € bln
 Integration with upstream
 Focus on Asia and new markets
 2025 contracted volumes: 14 MTPA
 Contract modernization with key gas
suppliers
 Maximizing returns from power
assets in Italy
 2021 clients: 11 mln (+25% vs 2017)
 Focus on high-growth customer-
tailored services
Retail – Eni gas e luce
0.3
0.8
0.2
2017 2018 End of plan
G&P and Upstream integrated projects
Indonesia
(Jangkrik e
Merakes)
East MED
(Damietta)
Mozambico
(Mamba)
New integrated projects
Sales Destination market
Marine XII
(Congo)
Angola
Nigeria
Source: IHS Feb-18
International gas prices|$/MMbtu
21
0
2
4
6
8
10
12
14
2015
2016
2017
2018
2019
2020
2021
2022
2023
2024
2025
2026
2027
2028
2029
2030
Asian Spot NBP Henry Hub
22
A top player in the LNG market
LNG contracted volumes 12 MTPA @ 2021
Equity Third Party
2017 2021
LNG SUPPLY - EQUITY VS THIRD PARTY
30%
0
5
10
15
2017 2018 2021 2025
LNG Equity existing LNG Equity New LNG Third Party
70%30%
23
R&M – leaner and greener
€ 2.1 bln
FCF 2018-21
Refining
Biofuels
Marketing
 Venice and Gela plants onstream
 Ecofining proprietary technology
 2021: 1 Mton/y green production
 Feedstock diversification and
“circular” economy
EBIT | € bln  Breakeven margin $3/bbl end 2018
 Deep conversion proprietary
technology licensing
 Asset optimization
 Focus on wholesale
 Digital Transformation and
Sustainable Mobility
 Stable retail market share
Refining
Marketing
0.5
0.6
0.9
2017 2018 End of plan
24
Versalis – an international player
~ € 300 mln
FCF 2018-21
Chemicals
Differentiated
products
Bio- based
chemistry
EBIT | € bln
 Consolidation industrial footprint
 Strengthening international
presence
 Business integration
 New products’ development
 Focus on high margin products
 Acquisitions/partnerships on new
technologies
 New industrial platforms from
renewable sources
 “Circular economy” projects
0.5
0.3
0.4
2017 2018 End of plan
2017
Scenario
effect
2018 2019 2020 2021 2025
~ 1
25
New energy solutions
 Synergies with Eni assets and activities
 International expansion in Eni Countries
 Solar, Wind and Hybrid Technologies
 R&D Deployment
Capacity end year| GWp
4YP CAPEX € 1.2 Bln
5
AN INTEGRATED MODEL
Digital transformation
BUILD ON OUR
SUCCESSFUL
DIGITAL
HISTORY
DIGITAL ACCELERATION along our value chain
SUBSURFACE
BIG DATA
PROPRIETARY
ALGORITHMS
(SINCE EARLY 2000’S)
INVESTMENT IN
TECHNOLOGY
INTEGRATION WITH
COMPETENCES
26
Mid- DownstreamUpstream
Exploration Development Drilling Operations Refining/Chemicals Trading Retail
Advanced
simulations to
speed up
design
Advanced
Algorithms to
reduce NPT
events
Blockchain
for trading
platforms
Data to offer
personalization,
up & cross selling
Drilling
Automation
for
repetitive
tasks
Integrated
internal and
external
information for
better decision
making
Drones for
progress
monitoring
New mobility
service:
car sharing
Enhanced Seismic Imaging & data processing ASSET INTEGRITY
Advanced algorithms
for asset integrity and
production
optimization
SMART OPERATOR
Mobile applications and
advanced safety devices
for field personnel
Green Data Center –
HPC4
Top 10 World Supercomputer
150+
GLOBAL PROJECTS
2017 2021
27
Carbon footprint reduction
zero
ROUTINE
GAS FLARING
-80%
vs 2014
FUGITIVE METHANE
EMISSIONS | MtCH4
-43%
vs 2014
UPS UNITARY
DIRECT EMISSIONS
TARGETS @ 2025 O&G resources | %
Oil
Gas
29
CAPEX Plan
Upstream>80%
15%Mid-Downstream
Other
2018-2021 capex: < € 32 bln2018 capex: ~ € 7.7 bln
7%
26%
49%
3%
7%
4%
4%
Exploration Prod. optimiz. & stay in business
Development Upstream G&P
R&M Chemicals
Energy solutions
30
Upstream: focus on projects under development
$50/b $60/b $70/b
13%
16%
18%
< $30/bbl
BREAKEVEN
$bln
Anticipated payback
Dual Exploration benefit not included
Cumulative Net Cash flow IRR
-15
-5
5
15
25
2017 2018 2019 2020 2021 2022 2023 2024 2025
NCF NCF including dual exp model
31
Upside exposure and downside resilience
Data @ 1.17 €/$ exchange rate
CAPEX CAPEX CAPEX
0
5
10
15
2017 2018 Plan End
€ bln
Working capital change + deferred cashin 2018 from Zohr disposal
Underlying operating cash flow @ $60 Underlying operating cash flow @ $70
48
53
58
2017 2018 end of plan
@ 2018 €/$
exchange rate = 1.17
@ 4YP €/$ exchange rate
$/bl
Free Cash flow Cash Neutrality
ROACE
12%
DIVIDEND POLICY PROGRESSIVE WITH
UNDERLYING EARNINGS AND FCF
€ 0.83 in 2018
+ 3.75 % vs 2017
BALANCE SHEET
STRENGTH
Leverage target
0.2 – 0.25
SHARE
BUY BACK
Excess cash
distribution
32
Remuneration policy and cash allocation
Committed to
Preserving
Upside
DEEPER INTEGRATION
High margin growth
in Upstream
Mid-downstream
upgrade
Sustainable
portfolio
Sizeable and
competitive LNG
ENHANCED RETURN TO SHAREHOLDERS
CAPITAL DISCIPLINE
Conclusions
33
1,795
1.650
1.700
1.750
1.800
1.850
1.900
1Q 2017 1Q 2018
34
1st Quarter 2018 Preview
European gas prices | €/kcmBrent | $/bbl Oil & Gas Production | kboed
~4%
Exchange rate | €/$ Std. Eni Refining Margin | $/bbl
,
,
,
,
,
,
53.8
66.8
1Q 2017 1Q 2018
219 240
195
227
1Q 2017 1Q 2018
PSV TTF
1.114 1.229
1Q 2017 1Q 2018
4.2
3.0
1Q 2017 1Q 2018
Assumptions and sensitivity
Sensitivity* EBIT adj (€ mln) net adj (€ mln) FCF (€ mln)
Brent (-1 $/bl) -310 -175 -205
Std. Eni Refining Margin (-1 $/bl) -160 -115 -160
Exchange rate $/€ (+0.05 $/€) -310 -120 -200
4YP Scenario 2018 2019 2020 2021
Brent dated ($/bl) 60 65 70 72
FX avg ($/€) 1.17 1.18 1.20 1.25
Std. Eni Refining Margin ($/bl) 5.0 5.0 5.0 5.0
NBP ($/mmbtu) 5.8 5.6 5.5 5.8
PSV (€/kmc) 188 178 171 175
* sensitivity 2018. Sensitivity is applicable for limited variations of prices
36
Main start ups 2018-21
37
OCHIGUFU - ANGOLA
AREA 1 - MEXICO
1H 2019
1H 2018
OCTP GAS - GHANA Wafa Compression – Bahr Essalam ph.2
LIBYA
1H 2018
MERAKES - INDONESIA
2H 2020
BALTIM SW - EGYPT
2H 2019
WEST HUB - ANGOLA CASSIOPEA - ITALY NENÈ PH.2B - CONGO MELEHIA DEEP - EGYPT
2H 2019 2H 2020 2H 2020 2H 2021
Main start-ups in the 4YP
38
Main start ups 2018-2021 Country Op Start-up
Equity
peak in 4 YP
Working Liquids/Gas
kboed Interest
Zohr Egypt yes Achieved 12/2017 200 50% Gas
West Hub (Ochigufu) Angola yes Achieved 03/2018 <10 37% Liquids
Wafa Compression Libya yes 1H18 25 50% Liquids/Gas
OCTP Oil+Gas Ghana yes
Oil: 5/17
Gas:1H18
49 44% Liquids/Gas
Bahr Essalam Ph. 2 Libya yes 1H18 45 50% Liquids/Gas
Mexico Area 1 Mexico yes 1H19 60 100% Liquids
Baltim SW (Barakish) Egypt yes 2H19 29 50% Liquids/Gas
West Hub (Vandumbu) Angola yes 2H19 <10 37% Liquids
Merakes (Jangkrik area) Indonesia yes 2H20 50 85% Gas
Cassiopea Italy yes 2H20 16 60% Gas
Nenè phase 2B Congo yes 2H20 14 65% Liquids
Melehia deep phase 2 Egypt yes 2H21 <10 100% Liquids/Gas

2018-21 eni presentation NY inv day

  • 2.
    2 Disclaimer This document containsforward-looking statements regarding future events and the future results of Eni that are based on current expectations, estimates, forecasts, and projections about the industries in which Eni operates and the beliefs and assumptions of the management of Eni. In addition, Eni’s management may make forward-looking statements orally to analysts, investors, representatives of the media and others. In particular, among other statements, certain statements with regard to management objectives, trends in results of operations, margins, costs, return on capital, risk management and competition are forward looking in nature. Words such as ‘expects’, ‘anticipates’, ‘targets’, ‘goals’, ‘projects’, ‘intends’, ‘plans’, ‘believes’, ‘seeks’, ‘estimates’, variations of such words, and similar expressions are intended to identify such forward-looking statements. These forward-looking statements are not guarantees of future performance and are subject to risks, uncertainties, and assumptions that are difficult to predict because they relate to events and depend on circumstances that will occur in the future. Therefore, Eni’s actual results may differ materially and adversely from those expressed or implied in any forward-looking statements. Factors that might cause or contribute to such differences include, but are not limited to, those discussed in Eni’s Annual Reports on Form 20-F filed with the U.S. Securities and Exchange Commission (the “SEC”) under the section entitled “Risk factors” and in other sections. These factors include but are not limited to: Fluctuations in the prices of crude oil, natural gas, oil products and chemicals; • Strong competition worldwide to supply energy to the industrial, commercial and residential energy markets; • Safety, security, environmental and other operational risks, and the costs and risks associated with the requirement to comply with related regulation, including regulation on GHG emissions; • Risks associated with the exploration and production of oil and natural gas, including the risk that exploration efforts may be unsuccessful and the operational risks associated with development projects; • Uncertainties in the estimates of natural gas reserves; • The time and expense required to develop reserves; • Material disruptions arising from political, social and economic instability, particularly in light of the areas in which Eni operates; • Risks associated with the trading environment, competition, and demand and supply dynamics in the natural gas market, including the impact under Eni take-or-pay long-term gas supply contracts; • Laws and regulations related to climate change; • Risks related to legal proceedings and compliance with anti-corruption legislation; • Risks arising from potential future acquisitions; and • Exposure to exchange rate, interest rate and credit risks. Any forward-looking statements made by or on behalf of Eni speak only as of the date they are made. Eni does not undertake to update forward-looking statements to reflect any changes in Eni’s expectations with regard thereto or any changes in events, conditions or circumstances on which any such statement is based. The reader should, however, consult any further disclosures Eni may make in documents it files with or furnishes to the SEC and Consob.
  • 4.
    4 Eni 2014-17 strategy 2014-17 UPSTREAM enhancement MID-DOWNSTREAM restructuring FINANCIAL resilience TRANSFORMATION intoa fully integrated O&G FITtoGROW COMPANY POSITIONED FOR A LOWER SCENARIO 4YP 2018-2021
  • 5.
    5 UPSTREAM enhancement Cash infrom disposal since 2013 NPV of Projects from exploration since 2014 Dual EXPLORATION Integrated MODEL Production RECORD $ 10.3 bln $ 8.8 bln kboed F&D Costs| $/boe Peers:, BP, RDS, CVX, TOT, STO, APC, MRO 0 5 10 15 20 25 30 35 2013-15 2014-16 2015-17 $/boe Eni Peers average 1598 1816 2014 2017
  • 6.
    ∆ CFFO 2015-2017 vs2012-2014 6 MID-DOWNSTREAM restructuring G&P 2017 ~€ 12 bln R&M CHEMICALS  Structurally underlying positive  Long-term contracts alignment to market level  Take or Pay recovery  Cost reduction  Consolidation of industrial footprint  Focus on differentiated products  International development  Production efficiency  Logistics rationalization  2 sites converted to bio- plants  Halved refining breakeven Cumulative CFFO| € bln -3.7 6.1 1.8 2012-14 2015-17
  • 7.
    7 FINANCIAL discipline * Organiccoverage of Capex and Dividend through CFFO 2014 2017 Dual Exploration effect57 2017 GEARING DIVIDEND CASH NEUTRALITY* | $/bbl WHILE PRESERVING BUSINESS GROWTH 39 including dual exploration model Peers adopting scrip dividend Peers: Total, Chevron, Statoil, BP, Shell, ConocoPhillips, Exxon -2% 2% 6% 10% 14% 18% 0% 10% 20% 30% 40% Changesince2013%points) Gearing % 114 1 2 3 4 5
  • 8.
  • 9.
    Eni strategic evolution BUSINESSINTEGRATION along the value chain UPSTREAM-MIDSTREAM UPSTREAM - DOWNSTREAM UPSTREAM - RENEWABLES UPSTREAM enhancement EFFICIENCY DECARBONIZATION PATH & GREEN ENERGIES DIGITALIZATION & INNOVATIONFINANCIAL DISCIPLINE 9 VALUE GROWTH
  • 10.
    10 Upstream key targetsin the 4YP CAGR 2017-21 3.5% organic ~40 $/bbl 4YP expl. resources Upstream CAPEX COVERAGE 2 bln boe 4YP upstream FCF 22 € bln
  • 11.
    2 BILLION BOEEQUITY A global range of exploration opportunities Eninet acreage| sqkm Transform Margin Barents Sea North Slope Angoche Basin Mexico offshore Egypt & Levantine Lower Congo Basin Oman offshore Lamu Basin Durban Basin East Kalimantan Vietnam Myanmar 100 Mln acres at YE 2017 Net Acreage 10 bln boe 3.5 € bln Equity Risked Potential 4YP Spending * Morocco offshore Porcupine Basin * Including G&G costs 11 4YP EXPLORATION TARGET
  • 12.
    Mexico: the powerof exploration 12 Area 1  Eni Operator with 100% working interest  Fields: Amoca, Miztón, Tecoalli  Shallow water  2 Billion boe OHIP (+ 1.2 vs original estimate)  Progress: PoD under authorization  Production start-up: 1H 2019  Plateau 100%: 90 kboed @2022 New blocks recently acquired in Sureste – Cuenca Salina Basin  Operator of Blocks 7, 10, 14, 28 in Campeche Bay  Operator of Deep Water Block 24  Two exploration wells planned in 1H 2019 in the new blocks Ciudad del Carmen Area 1 Eni Mexico 100% Zona Sur Block 7 Eni Mexico (45%), Capricorn (30%) Citla (25%) Block 10 Eni Mexico 100% Block 14 Eni Mexico (60%) Citla (40%) Block 24 Eni Mexico (65%) Qatar Petroleum (35%) Low cost developmentHigh Prospectivity A rapidly-growing / high-quality portfolio, coupled with a fast track development of material resources 28 Block 28 Eni Mexico (75%), Lukoil (25%)
  • 13.
    2021  OCTP Gas West Hub - Ochigufu  Bahr Essalam Ph.2  Wafa Compression 13 Ramp-ups and start-ups driving growth  Zohr  Jangkrik Complex  Nidoco Ph. 2/3  East Hub  OCTP Oil  Nenè Ph. 2A  CAFC  Abu Dhabi fields MAIN ONSTREAM PROJECTS 2018  Area 1 Mexico  Baltim SW (Barakish)  West Hub - Vandumbu  Trestakk  Nenè ph. 2B  Smorbukk North  Cassiopea  KPC Debottlenecking  BRN New Pipeline  Merakes  Melehia deep Ph. 2 2019 2020 1816 CAGR 2017-2021 3.5% CAGR 2021-2025 3% 2018 4% MAJOR START-UPS15OIL & GAS PRODUCTION | kboed 2017 2018 2021 2025 base production start-ups/ramp-ups
  • 14.
    14 Production trends 2017 2021 Mexico AbuDhabi New producing Countries GEOGRAPHICAL SPLIT % North Africa Europe Caspian Africa Sub-Saharan America Asia Pacific & Middle East
  • 15.
    15 Asia Pacific &Middle East: an expanding high-potential area >250 kboed Asia Pacific and Middle East Production contribution @ 2021 Oman offshore East Kalimantan Vietnam Myanmar MERAKES JANGKRIK ABU DHABINASR UMM SHAIF LOWER ZAKUM Exploration activity
  • 16.
    Zohr is rampingup 16 Accelerated start-up  6 wells + 26’’ line + 14” line  1 control platform + 1 umbilical  New onshore plant (EPF + 3 trains)  Current gross production: 400 Mcfd Ramp-up to plateau  14 additional wells + 2x30’’ export lines  1 umbilical  Onshore plant extension (4 trains)  Gross Plateau 2.7 Bcfd by 2019 Plateau Extension  5 additional wells + 2x30’’ export lines  1 umbilical  Onshore compression  Total of 8 gas treatment trains 2.7 RAMP UP BCF/D 0.4 2.0 Accelerated start-up Ramp-up to plateau 01/2018 01/2019 01/2020
  • 17.
    2017 2018 2020-21 4YPstart up 25.2 17 Value expansion of production growth CASH FLOW PER BARREL | $/boe 18 @ $60/bl scenario 4YP start up 24.5 legacy 15.8 legacy 15.5 HIGH QUALITY LONG TERM CASH FLOW 16.7 17.5 @ 2017 scenario 14 $22/boe @ $70 scenario
  • 18.
    3 5 7 9 11 13 2017 2018 Endof plan 18 The rise of upstream cash flow Brent $/bbl 60 60 60 Capex Upstream FULL COVERAGE OF DIVIDEND WITH UPSTREAM FCF Upside @ $ 70/bl Upstream CFFO € bln
  • 19.
    19 Mid-downstream key targets 2 €bln 4.7 € bln Total 4YP FCFEBIT end of plan
  • 20.
    Gas & LNGMarketing and Power 20 Gas & Power - bigger and stronger € 2.4 bln FCF 2018-21 Gas & LNG Marketing and Power Retail EBIT | € bln  Integration with upstream  Focus on Asia and new markets  2025 contracted volumes: 14 MTPA  Contract modernization with key gas suppliers  Maximizing returns from power assets in Italy  2021 clients: 11 mln (+25% vs 2017)  Focus on high-growth customer- tailored services Retail – Eni gas e luce 0.3 0.8 0.2 2017 2018 End of plan
  • 21.
    G&P and Upstreamintegrated projects Indonesia (Jangkrik e Merakes) East MED (Damietta) Mozambico (Mamba) New integrated projects Sales Destination market Marine XII (Congo) Angola Nigeria Source: IHS Feb-18 International gas prices|$/MMbtu 21 0 2 4 6 8 10 12 14 2015 2016 2017 2018 2019 2020 2021 2022 2023 2024 2025 2026 2027 2028 2029 2030 Asian Spot NBP Henry Hub
  • 22.
    22 A top playerin the LNG market LNG contracted volumes 12 MTPA @ 2021 Equity Third Party 2017 2021 LNG SUPPLY - EQUITY VS THIRD PARTY 30% 0 5 10 15 2017 2018 2021 2025 LNG Equity existing LNG Equity New LNG Third Party 70%30%
  • 23.
    23 R&M – leanerand greener € 2.1 bln FCF 2018-21 Refining Biofuels Marketing  Venice and Gela plants onstream  Ecofining proprietary technology  2021: 1 Mton/y green production  Feedstock diversification and “circular” economy EBIT | € bln  Breakeven margin $3/bbl end 2018  Deep conversion proprietary technology licensing  Asset optimization  Focus on wholesale  Digital Transformation and Sustainable Mobility  Stable retail market share Refining Marketing 0.5 0.6 0.9 2017 2018 End of plan
  • 24.
    24 Versalis – aninternational player ~ € 300 mln FCF 2018-21 Chemicals Differentiated products Bio- based chemistry EBIT | € bln  Consolidation industrial footprint  Strengthening international presence  Business integration  New products’ development  Focus on high margin products  Acquisitions/partnerships on new technologies  New industrial platforms from renewable sources  “Circular economy” projects 0.5 0.3 0.4 2017 2018 End of plan 2017 Scenario effect
  • 25.
    2018 2019 20202021 2025 ~ 1 25 New energy solutions  Synergies with Eni assets and activities  International expansion in Eni Countries  Solar, Wind and Hybrid Technologies  R&D Deployment Capacity end year| GWp 4YP CAPEX € 1.2 Bln 5 AN INTEGRATED MODEL
  • 26.
    Digital transformation BUILD ONOUR SUCCESSFUL DIGITAL HISTORY DIGITAL ACCELERATION along our value chain SUBSURFACE BIG DATA PROPRIETARY ALGORITHMS (SINCE EARLY 2000’S) INVESTMENT IN TECHNOLOGY INTEGRATION WITH COMPETENCES 26 Mid- DownstreamUpstream Exploration Development Drilling Operations Refining/Chemicals Trading Retail Advanced simulations to speed up design Advanced Algorithms to reduce NPT events Blockchain for trading platforms Data to offer personalization, up & cross selling Drilling Automation for repetitive tasks Integrated internal and external information for better decision making Drones for progress monitoring New mobility service: car sharing Enhanced Seismic Imaging & data processing ASSET INTEGRITY Advanced algorithms for asset integrity and production optimization SMART OPERATOR Mobile applications and advanced safety devices for field personnel Green Data Center – HPC4 Top 10 World Supercomputer 150+ GLOBAL PROJECTS 2017 2021
  • 27.
    27 Carbon footprint reduction zero ROUTINE GASFLARING -80% vs 2014 FUGITIVE METHANE EMISSIONS | MtCH4 -43% vs 2014 UPS UNITARY DIRECT EMISSIONS TARGETS @ 2025 O&G resources | % Oil Gas
  • 29.
    29 CAPEX Plan Upstream>80% 15%Mid-Downstream Other 2018-2021 capex:< € 32 bln2018 capex: ~ € 7.7 bln 7% 26% 49% 3% 7% 4% 4% Exploration Prod. optimiz. & stay in business Development Upstream G&P R&M Chemicals Energy solutions
  • 30.
    30 Upstream: focus onprojects under development $50/b $60/b $70/b 13% 16% 18% < $30/bbl BREAKEVEN $bln Anticipated payback Dual Exploration benefit not included Cumulative Net Cash flow IRR -15 -5 5 15 25 2017 2018 2019 2020 2021 2022 2023 2024 2025 NCF NCF including dual exp model
  • 31.
    31 Upside exposure anddownside resilience Data @ 1.17 €/$ exchange rate CAPEX CAPEX CAPEX 0 5 10 15 2017 2018 Plan End € bln Working capital change + deferred cashin 2018 from Zohr disposal Underlying operating cash flow @ $60 Underlying operating cash flow @ $70 48 53 58 2017 2018 end of plan @ 2018 €/$ exchange rate = 1.17 @ 4YP €/$ exchange rate $/bl Free Cash flow Cash Neutrality ROACE 12%
  • 32.
    DIVIDEND POLICY PROGRESSIVEWITH UNDERLYING EARNINGS AND FCF € 0.83 in 2018 + 3.75 % vs 2017 BALANCE SHEET STRENGTH Leverage target 0.2 – 0.25 SHARE BUY BACK Excess cash distribution 32 Remuneration policy and cash allocation Committed to Preserving Upside
  • 33.
    DEEPER INTEGRATION High margingrowth in Upstream Mid-downstream upgrade Sustainable portfolio Sizeable and competitive LNG ENHANCED RETURN TO SHAREHOLDERS CAPITAL DISCIPLINE Conclusions 33
  • 34.
    1,795 1.650 1.700 1.750 1.800 1.850 1.900 1Q 2017 1Q2018 34 1st Quarter 2018 Preview European gas prices | €/kcmBrent | $/bbl Oil & Gas Production | kboed ~4% Exchange rate | €/$ Std. Eni Refining Margin | $/bbl , , , , , , 53.8 66.8 1Q 2017 1Q 2018 219 240 195 227 1Q 2017 1Q 2018 PSV TTF 1.114 1.229 1Q 2017 1Q 2018 4.2 3.0 1Q 2017 1Q 2018
  • 36.
    Assumptions and sensitivity Sensitivity*EBIT adj (€ mln) net adj (€ mln) FCF (€ mln) Brent (-1 $/bl) -310 -175 -205 Std. Eni Refining Margin (-1 $/bl) -160 -115 -160 Exchange rate $/€ (+0.05 $/€) -310 -120 -200 4YP Scenario 2018 2019 2020 2021 Brent dated ($/bl) 60 65 70 72 FX avg ($/€) 1.17 1.18 1.20 1.25 Std. Eni Refining Margin ($/bl) 5.0 5.0 5.0 5.0 NBP ($/mmbtu) 5.8 5.6 5.5 5.8 PSV (€/kmc) 188 178 171 175 * sensitivity 2018. Sensitivity is applicable for limited variations of prices 36
  • 37.
    Main start ups2018-21 37 OCHIGUFU - ANGOLA AREA 1 - MEXICO 1H 2019 1H 2018 OCTP GAS - GHANA Wafa Compression – Bahr Essalam ph.2 LIBYA 1H 2018 MERAKES - INDONESIA 2H 2020 BALTIM SW - EGYPT 2H 2019 WEST HUB - ANGOLA CASSIOPEA - ITALY NENÈ PH.2B - CONGO MELEHIA DEEP - EGYPT 2H 2019 2H 2020 2H 2020 2H 2021
  • 38.
    Main start-ups inthe 4YP 38 Main start ups 2018-2021 Country Op Start-up Equity peak in 4 YP Working Liquids/Gas kboed Interest Zohr Egypt yes Achieved 12/2017 200 50% Gas West Hub (Ochigufu) Angola yes Achieved 03/2018 <10 37% Liquids Wafa Compression Libya yes 1H18 25 50% Liquids/Gas OCTP Oil+Gas Ghana yes Oil: 5/17 Gas:1H18 49 44% Liquids/Gas Bahr Essalam Ph. 2 Libya yes 1H18 45 50% Liquids/Gas Mexico Area 1 Mexico yes 1H19 60 100% Liquids Baltim SW (Barakish) Egypt yes 2H19 29 50% Liquids/Gas West Hub (Vandumbu) Angola yes 2H19 <10 37% Liquids Merakes (Jangkrik area) Indonesia yes 2H20 50 85% Gas Cassiopea Italy yes 2H20 16 60% Gas Nenè phase 2B Congo yes 2H20 14 65% Liquids Melehia deep phase 2 Egypt yes 2H21 <10 100% Liquids/Gas