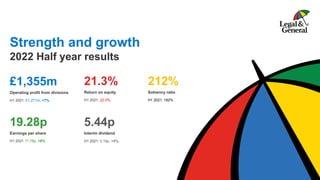
1. Strength and growth
2022 Half year results
£1,355m
Operating profit from divisions
H1 2021: £1,271m, +7%
19.28p
Earnings per share
H1 2021 17.78p, +8%
5.44p
Interim dividend
H1 2021: 5.18p, +5%
21.3%
Return on equity
H1 2021: 22.0%
212%
Solvency ratio
H1 2021: 182%
2. Forward looking statements
This document may contain certain forward-looking statements relating to Legal & General, its plans and its
current goals and expectations relating to future financial condition, performance and results. By their nature,
forward-looking statements involve uncertainty because they relate to future events and circumstances which
are beyond Legal & General’s control, including, among others, UK domestic and global economic and
business conditions, market related risks such as fluctuations in interest rates and exchange rates, the policies
and actions of regulatory and Governmental authorities, the impact of competition, the timing impact of these
events and other uncertainties of future acquisitions or combinations within relevant industries. As a result,
Legal & General’s actual future condition, performance and results may differ materially from the plans, goals
and expectations set out in these forward-looking statements and persons reading this document should not
place reliance on forward-looking statements. These forward-looking statements are made only as at the date
on which such statements are made and Legal & General Group Plc does not undertake to update forward-
looking statements contained in this document or any other forward-looking statement it may make.
2
4. Good financial performance and a strong balance sheet
212%
Solvency II coverage ratio
H1 2021: 182%
£1,355m
Operating profit from divisions
H1 2021 £1,271m, +7%
£0.9bn
SII operational surplus generation
H1 2021: £0.8bn, +14%
19.28p
Earnings per share
H1 2021: 17.78p, +8%
4
5.44p
Interim dividend
H1 2021: 5.18p, +5%
21.3%
Return on equity
H1 2021: 22.0%
Strong
profitability…
Supported by a strong
balance sheet…
Driving strong
shareholder returns
5. We have four strong divisions, operating at scale
Division Provision Description
H1 2022
Operating
Profit (£m)
LGC Asset Origination
An alternative asset origination platform, originating assets for L&G
and for third parties, and generating attractive shareholder returns
263
LGIM Asset Management
A global £1.3tn asset manager with deep expertise in DB and DC
pensions
200
LGRI Retirement Solutions
A leading multi-national manager of institutional Pension Risk
Transfer business
560
Retail
Retirement &
Protection Solutions
A leading provider of UK retail retirement solutions and of UK and
US life insurance & income protection
332
1,355
5
H1 2022 operating profit by division
6. Structural and
capital synergies
result in
~20% ROE
The synergies between them underpin our 20%+ ROE
Institutional
Retirement
(LGRI)
Providing
capital
Retail
Creating
Alternative
assets
Capital
Investment
(LGC)
Investment
Management
(LGIM)
Co-investing
Providing asset
management
services Creating
Alternative
assets
Protection
capital
benefits
Lifetime
Mortgage
origination
Contributing
DC and
Annuity AUM
Workplace
client
relationships
Asset
management
services
Contributing
captive AUM
Asset
management
services
Annuity asset
portfolio
management
6
7. Collectively, these businesses have delivered good growth in
operating profits, demonstrating resilience in volatile markets
7
£m H1 2021 H1 2022 %
LGRI 525 560 7
LGC 250 263 5
LGIM 204 200 (2)
Retail 292 332 14
Operating profit from divisions 1,271 1,355 7
Operating profit 1,079 1,160 8
Operating profit from divisions
8. Our business is aligned to six long-term growth drivers, providing
immunity to a low / no economic growth environment
8
Growth drivers Strategic priorities
Market
opportunity
Primary
divisions
Ageing
demographics
Be global leaders in pensions de-risking and retirement income solutions,
building upon success in the UK and US
$57tn
LGRI, Retail,
LGIM
Globalisation of
asset markets
Build a global asset management business, entering new markets and
expanding our existing operations
$149tn LGIM
Investing in the
real economy
Be leaders in long-term direct investments, whilst benefitting society through
socially responsible investments
£100bn
LGC, LGRI,
Retail, LGIM
Welfare
reforms
Help people take responsibility for their own financial security through
insurance, pensions and savings
£1.6tn Retail, LGIM
Technological
innovation
Be market leaders in the digital provision of insurance and other financial
solutions
$30bn Retail
Addressing
climate change
Support the fight against climate catastrophe through the positioning of our own
investments, our influence as one of the world’s largest asset managers and
by managing our own operational footprint
$20tn All
Willis Towers Watson, Global Pensions Asset Study, 2022: $53tn of global private DB and DC pension assets; BCG Global Asset Management 2022: $149tn global AUM by 2026e; 400k (x £250k
average selling price) homes to be built in the UK per annum by 2025; £1.6tn of UK DC assets and UK ISA AUM by 2025e; $30bn US retail protection market by 2025e; $20tn of investment needed
by 2025 to achieve global net zero emissions by 2050
9. We are well positioned to navigate the prevailing market
environment
Normalising interest rates Widening credit spreads Rising inflation
Solvency ratio up =
greater capital optionality
Reduced DB scheme deficits
(for unmatched schemes) =
increased demand for PRT
Positive Insurance investment
variances = higher EPS
+
-
Reduced DB scheme deficits =
increased demand for PRT
Improved PRT
pricing and margins
Annuity assets and
liabilities closely matched
Lower loan to value ratios
on lifetime mortgages =
greater security
LGIM fixed income and
LDI asset values down
Greater market concern
over credit risk reflected
in our share price*
Spread of market-sourced direct
investments over credit is
temporarily lower
Wage inflation
Focus on managing construction
supply chain exposure
Indicative impact of prevailing market conditions on L&G
9 * We have a strong track record in managing credit risk. We have a high quality portfolio (99% investment grade) with no defaults since 2008 and strong DI cash flows (100% received in H1)
10. We are on track to achieve or beat our cumulative cash and
capital ambitions
10
£bn
Growth from
2H 2022 to 2024 at
2020a 2021a 2022 2023 2024
Cumulative cash generation
0% 1.5 3.2 5.1 6.8 8.5
5% 1.5 3.2 5.1 7.0 8.9
10% 1.5 3.2 5.2 7.1 9.3
Cumulative capital generation
0% 1.5 3.1 4.9 6.7 8.5
5% 1.5 3.1 4.9 6.8 8.8
10% 1.5 3.1 4.9 6.9 9.1
2020-2024
Ambition
8.0 – 9.0
8.0 – 9.0
Cash generation: Actuals to H1 2022. From H2 2022 onwards, assumes variously 0%, 5% and 10% annual growth from 2021 baseline
Capital generation: Actuals to H1 2022. FY 2022 capital generation of £1.8bn and from 2023 onwards assumes variously 0%, 5% and 10% annual growth from 2022 baseline
These do not represent forecasts and are for illustrative purposes only
Illustrative growth in cash and capital
We are confident that we will consistently grow cash and capital faster than our dividend
commitment. Widening “jaws” over the dividend create positive capital optionality.
Even zero growth in cash and capital generation from now to 2024 would see us meet our ambitions.
11. We achieved self-sustainability on the UK annuity portfolio
(and for Group) in 2020, 2021 and expect to do so again in 2022
• We expect to achieve self-
sustainability again in 2022,
driven by double digit
growth in OSG (i.e. capital
generation) to c£1.8bn
• Our growing annuity
portfolio generates
increasing OSG year on
year, increasing dividend
headroom
£bn
UK annuity portfolio Group
2020 2021 2022 2020 2021 2022
UK PRT and Retail Annuity Volumes 8.5 7.2 8.0-12.0
Operational Surplus Generation (OSG) 1.0 1.1 1.2 1.5 1.6 1.8
New Business Strain (0.3) (0.3) (0.3-0.5) (0.3) (0.4) (0.4-0.6)
Net Surplus Generation 0.8 0.8 0.9-0.7 1.2 1.3 1.4-1.2
Dividend (0.7) (0.7) (0.7) (1.0) (1.1) (1.1)
Net Surplus Generation – Dividend 0.1 0.1 0.2-0 0.1 0.2 0.3-0.1
UK annuity portfolio: self-sustainability
Notes:
The UK annuity portfolio OSG figures also include contributions from LGIM and LGC, reflecting the total Group value of writing UK PRT. Management actions are also included
Whilst we may choose not to prioritise self-sustainability in every discrete year, our ambition is for net surplus generation to exceed dividends for the Group over the period 2020-2024
Numbers in the table above do not sum due to rounding
11
12. Our newly created Retail division has multiple growth
opportunities across protection, retirement and fintech
Notes: Market data and L&G position are 2021 unless stated otherwise. 1 – Estimated for end 2020. 2 – Assuming c.£350 average per policy and c.20.7m total in-force policies (ABI). 3 – Internal estimate.
Sources: ABI, FCA Retirement Income Data, FCA PSD, SwissRE, Broadridge UK DC and RI Navigator Report, Savills, Equity Release Council, Deloitte FinTech Landscape, KPMG, UK Finance
12
L&G Retail
Retirement Income
Retail Protection
Workplace Savings
Group Protection
Home Finance
(Later life lending)
US Protection
FinTech
Mortgage Services
Multiple Attractive Markets
c£32bn at-retirement annual flows1 of which c.£4bn from annuity. Market growth from
improving annuity rates and growth in DC savings
Est. £7bn2 total in-force premiums; modest single digit growth
Workplace DC stock expected to grow 140% over next 10 years from £515bn to
c£1.25tn – fuelled by growth into Master Trust
c£2.8bn total in-force premiums, increasing with salary inflation
UK: c£5bn growing at 20%+; over-55’s hold c£2.6tn housing equity. Inevitable source
of retirement funding worldwide
$30bn3 total annual premium market
Highly fragmented – over 500 carriers – slowly digitising
Over 2,500 UK FinTechs, which saw over $37.3bn in investment in 2021 – up seven
fold from 2020
Over 1.2m UK mortgages arranged per year, >75% intermediated
c.21% Annuity
market share
c.25% market share
(New business)
c.15% Master Trust
market share
c.14% market share
(New business)
c.17% market share
9 strategic
investments
c.30% market share
(intermediary lending)
Multiple Attractive Markets L&G Position
c.4% market share
(New business)
13. Our strategy is underpinned by a clear purpose and a focus
on execution
13
To improve the lives of our customers, build a better society for the long term and create value
for our shareholders. We use our long-term assets in an economically effective and socially useful
way to benefit everyone in society
Our purpose
ESHG approach
We think about the long-term ESHG impact of our businesses in terms of:
• How we invest our £88bn of proprietary assets1
• How we influence as one of the world’s largest asset managers with £1.3tn AUM
• How our businesses operate
Environmental
Social
Governance
• Decarbonising the assets on our balance sheet to align with the Paris objective
• Committed to the Science Based Target Initiative
• Investments in onshore and offshore wind, ground source heat pump technology and electric vehicles
• Addressing the affordable housing shortage, e.g. building 3,000 affordable homes by 2023
• Housing for the homeless, e.g. in partnership with Croydon council
• Creating a stronger society, e.g. Advanced Care research investment at Edinburgh University
• Engaging with investee companies, e.g. promoting Board diversity, director independence
• Improving diversity and inclusion at L&G, e.g. addressing areas of under-representation
• Maintaining focus on our supply chain, modern slavery, human rights and health & safety
Health
• Established a partnership with Sir Michael Marmot to address UK health inequality
• Continuing to invest in pioneering health VC start-ups, e.g. CMR Surgical, Hinge Health
• £5m gift to Newcastle City Council to pioneer new post-COVID approach to elderly care
1. As at 30th June 2022, excluding derivatives, cash & cash equivalents and loans; please see the appendix for further quantitative data on our ESHG progress and commitments
Long-term, sustainable strategy delivering for our stakeholders
14. 14
L&G has a strong balance sheet and is well positioned to
continue to deliver profitable growth
1. Our six long-term strategic growth drivers are as relevant today as they have ever been. They also help to
immunise our business to a low / no growth economic environment
2. Year to date operating performance is in line with our expectations. Operating profit and EPS are both up 8%,
cash and capital generation up double digits, and DPS up 5%
3. Solvency is strong at 212% (FY 2021: 187%). Our annuity portfolio continues to perform resiliently with no
defaults. 100% of scheduled DI cash-flows were paid in H1
4. The market environment is accelerating global demand for PRT. H1 2022 volumes were written at good
margins and low capital strain. The UK annuity business (and Group) was self-financing in 2020, 2021 and is
expected to be self-financing again in 2022
5. LGC continues to perform strongly and remains on track to achieve our stated 2025 ambitions: operating
profits of at least £600-700m and fee-generating third party capital of £25-30bn
16. Strong financial performance
Metric H1 2021 H1 2022 %
Operating profit from divisions (£m) 1,271 1,355 7
Group debt costs (£m) (120) (108)
Group investment projects & expenses (£m) (72) (87)
Operating profit (£m) 1,079 1,160 8
Investment & other variances (£m) 241 207
Profit before tax (£m) 1,320 1,367
Earnings per share (p) 17.78 19.28 8
Return on equity (%) 22.0 21.3
SII operational surplus generation (£bn) 0.8 0.9 14
SII coverage ratio (%) 182 212
16
17. Financial Highlights H1 2021 H1 2022
Operating profit (£m) 525 560
Investment and other variances (£m) 75 133
Profit before tax (£m) 600 693
Total LGRI new business (£m) 3,072 4,449
Total annuity AUM1
(£bn) 85.8 78.82
17
LGRI: Consistently delivering strong profits
1. Annuity AUM includes LGRI and Retail Retirement business
2. Total annuity AUM has reduced due to the higher interest rate environment
• Operating profit of £560m, reflecting:
‒ The scale of the business as prudential
margins unwind from the back book
‒ An effective ongoing asset strategy – including
the allocation of some Direct Investment assets
to our back-book – that is increasing the total
yield on our portfolio
‒ £4.4bn of PRT new business written at
attractive margins
• H1 2021 result included positive variances driven
by COVID-driven excess deaths which have not
been repeated at the same scale in H1 2022
18. Total Sales (£m) H1 2021 H1 2022
UK PRT1
2,965 3,715
US PRT 107 593
Other International PRT - 141
Total LGRI New Business 3,072 4,449
Solvency II New business value2
(£m) 241 323
Solvency II New business margin2
(%) 8.7 8.7
18
LGRI: Disciplined approach for value
1. Includes Assured Payment Policy
2. UK PRT business only
• Strong H1 2022 volumes: £4.4bn of global PRT across 25
transactions
• In the UK, continued momentum and financial discipline, despite
a competitive market:
• LGRI achieved consistent SII new business margin
supported by good asset origination and reinsurance terms.
Volumes were written at a capital strain of less than 4%
• c£3.7bn of UK PRT premium across 20 transactions.
Committed presence across all market segments, writing our
smallest deal of less than £1m through to our largest deal of
c£2.2bn (a follow-on transaction with British Steel pension
scheme under an umbrella agreement)
• $0.7bn of US PRT across 4 transactions including our largest
transaction at over $550m. Another Canadian deal (for
CAD$230m) building on our strategic partnerships in that market
• c£25bn pipeline leading into H2 2022 and 2023. We are
delivering against our five-year ambition of £40-50bn UK PRT
and $10bn of International PRT
19. 3%
17%
11%
8%
11%
12%
11%
27%
Bond - Government Bond - Economic Infrastructure (incl. renewables)
Bond - Social Infrastructure Bond - Utilities
Bond - Private Corporate Debt (other) Bond - Real Estate (debt)
Property - Vacant Value Long-term Rental Income
BBB, 35% (£25.5bn)
A, 33% (£24.2bn)
AA, 21% (£15.3bn)
AAA, 10% (£7.1bn)
• Defensively positioned, high quality portfolio.
£2.7bn IFRS credit default reserve remains
unutilised
• Approximately two-thirds A-rated or better.
Only 12% of BBB are BBB-
• 14% of bonds in Sovereign-like assets
• 8% high quality Lifetime Mortgage book:
average customer age 74; weighted average
loan-to-value of c.28.5%
• Lower-rated, cyclical exposures kept to a
minimum: <1% airlines, hotels, leisure and
traditional retail combined
• Geographically diversified portfolio
(49% UK, 33% US, 10% EU, 8% RoW)
Annuity Bond Portfolio: £73.2bn (out of £78.8bn)
H1 2022
£73.2bn
Other, 9%
Sovereigns, Supras and Sub-Sovereigns, <1%
Utilities, Commodities, Energy, 10%
Non-cyclical consumer goods and services, 5%
Infrastructure, 6%
Technology, Telecoms and Industrials, 5%
BB or below, 1%
(£1.1bn)
19
Annuity assets: Diversified bond portfolio complemented by
high quality direct investments
Annuity DI portfolio: £20.5bn, 26% of total assets
Direct investments
by type
• No defaults and 100% of scheduled cash-flows paid. Primary exposure
is to the underlying high quality tenant on rental income, e.g. Amazon,
not to property risk. Around two-thirds of portfolio rated ‘A’ or above
• Originated £1.6bn of new, high quality direct investments during H1
2022. Continue to benefit from LGC ESG-focused asset creation via
Affordable Homes, Build to rent and Urban Regeneration
Across these
asset classes, the
primary exposure
is to high quality
counterparties,
not to property
valuations: 89% of
DI portfolio
Note: Annuity DI portfolio of £20.5bn excludes Lifetime Mortgage assets of £5.8bn
20. L&G invests primarily in investment grade credit. We adopt a
prudent default assumption. Default experience has been low
20
99% Percentage of L&G’s bond portfolio that is investment grade
43bps L&G prudent annual IFRS default assumption
<1bp Actual L&G annual default rate (2007-H1 2022)
L&G prudent annual IFRS default assumption is for corporate bonds and direct investments and equivalent to £2.7bn IFRS default reserve
Actual L&G annual default rate of 0.9bps equivalent to £25m of defaults since 2007
Market-implied IFRS base default assumption is for credit assets. Note: we assume a buy and maintain strategy as opposed to a “straight to default” assumption
18bps Market-implied IFRS base default assumption
21. We have improved the quality of our portfolio as it has grown.
Investment variances are net positive
21
Annuity bond portfolio 2007 Today
Assets under management (£bn) 16.2 73.2
% of assets that are investment grade 90 99
Credit default reserve (£bn) 0.5 2.7
Credit default reserve as % of AUM 3.1 3.7
Note: For the complete data set since 2007 see the appendix. Investment variances for 2007 are for the Risk division which incorporated Annuities, UK Protection and General Insurance business.
We had c£130m of Russian exposures in the bond portfolio at FY21. These were subsequently downgraded from BBB to un-rated and have now been marked at c£35m. They have not yet defaulted.
Since 2007:
• Our annuity book has more than
quadrupled in size
• The quality of the assets backing
the portfolio has increased
• The credit default provision has
grown in line with the portfolio
• We have experienced:
‒ Actual default losses of just
£25m, and none since 2008
‒ Net positive investment
variances: £720m
2007 to H1-2022 Cumulative
Actual default losses (£m) 25
Investment variances (£m) 720
22. Our balance sheet is well positioned to absorb a significant
credit event, should it occur
22
212%
180%
(3%)
(29%)
10%
190%
H1 2022 ratio Default
impact
Downgrade
impact
Partial
rebalancing
of portfolio
Post management
actions ratio
• We apply a potential credit stress scenario to our current
balance sheet. We assume a credit scenario broadly in line
with 2001/2002:
‒ Default rates: 1.0% of credit assets default
pre-recoveries (0.03% AA defaults, 0.7% A defaults,
1.4% BBB defaults and 7% sub-investment grade
defaults). 40% assumed recoveries
‒ Downgrades: an immediate big letter downgrade on
20% of all assets1
‒ Note: we do not recognise any benefit from widening
credit spreads. Indicatively, 100bps widening of credit
spreads would increase the solvency ratio by 12pp
• In this scenario we would see a decline in our solvency ratio.
We could improve the impact by c10pp from a partial
rebalancing of sub-investment grade assets2
• We could therefore reasonably expect the solvency ratio to
be at c190% shortly after this scenario
Indicative impact of a significant
credit event on L&G’s solvency ratio
1. The main impact on the ratio from downgrades is from assets downgraded to sub-IG. Our assumption is consistent with the aggregate level of IG assets being downgraded to sub-IG experienced in 2001/2002.
2. We assume portfolio rebalancing to replace downgraded BBB assets, including the rebalancing of all Traded assets, and 50% of Direct Investments, downgraded to sub-IG.
23. Financial Highlights H1 2021 H1 2022
Operating profit (£m) 250 263
- Alternative asset portfolio 195 202
- Traded portfolio and Treasury 55 61
Investment and other variances (£m) 48 (308)
Profit before tax (£m) 298 (45)
Assets (£m) 8,656 8,250
- Alternative asset portfolio 3,426 3,739
- Traded portfolio 2,380 1,979
- Cash and Treasury assets 2,850 2,532
23
LGC: On track to achieve ambitious targets
• Strong commitment to ESG-aligned investing, with proven asset expertise in
clean energy, residential property, digital infrastructure and SME finance
• Recent successful origination for LGRI and Retail Retirement in Urban
regeneration, Build to Rent, Affordable Homes and Alternative Finance. Remain
on track to deliver close to £1bn of new assets for the annuity portfolio over 2022
• Announced first US investment: a 50:50 partnership with US retail estate
developer, Ancora, to create a real estate platform driving life science, research
and technology growth across the US
• Operating profit of £263m, up 5%, principally reflecting
profits from our alternative asset portfolio
• Alternative asset profits of £202m were driven by continued
valuation increases over H1 2022, notably in the Venture
Capital portfolio and Pemberton, complemented by another
period of strong trading performance from Cala and
Affordable Homes. Note: the prior year included a
conservative valuation uplift of Pod Point ahead of its IPO
– The alternative asset portfolio is up 9% to £3,739m
(H1 2021: £3,426m). Net portfolio return of 9.3%
(H1 2021: 10.7%)
• Profit before tax £(45)m, reflecting volatile global equity
market performance in H1 2022
• Our ambition is to build our diversified alternative AUM to
c.£5bn (H1 2022: £3.7bn) with a target blended portfolio
return of 10-12% and to increase third party capital to over
£25bn (H1 2022: £15.6bn). We therefore expect to
manage over £30bn of alternative AUM by 2025 and
deliver £600-700m of operating profit
24. • Operating profit down 2% to £200m following significant moves
in interest rates, inflation and global equity markets impacting asset
values in our Index, Fixed Income and LDI Portfolios
• Record net flows of £66bn combined with disciplined approach
to cost management leading to cost:income ratio of 59%
• AUM down 3% to £1.3tn, due to falling markets
‒ International AUM of £468bn, 36% of total AUM
‒ A market leader in UK DC with £129bn of AUM, and 4.7m
Workplace members
‒ Wholesale AUM at £46bn with gross inflows of £4.1bn. Top 3 in
both gross and net UK retail sales² over Q2 2022
• Continuing to make progress across our three strategic pillars:
– Modernise: Continued execution of the transformation of our
strategic operating model through partnership with State Street
and use of their Charles River technology
– Diversify: Expansion of ESG product range; preparing for launch
of new renewable infrastructure equity offering in partnership with
NTR (first close expected in Q4 2022)
– Internationalise: >50% of net flows from International channels
and continued investment in expanding European footprint and
building out US product proposition
Financial Highlights H1 2021 H1 2022
Asset management revenue1
(£m) 480 494
Asset management expenses1
(£m) (276) (294)
Total LGIM operating profit (£m) 204 200
Closing AUM (£bn) 1,327 1,290
International AUM (£bn) 434 468
UK DC AUM (£bn) 125 129
Wholesale AUM (£bn) 45 46
External net flows (£bn) 27.4 65.6
Asset management cost:income ratio (%) 58 59
1. Revenue and expenses exclude income and costs of £15m in relation to the provision of 3rd party market data (H1 2021: £18m)
2. Pridham Report Q2 2022
3. AUM in responsible investment strategies represents only the AUM from funds or client mandates that feature a deliberate and positive expression of ESG criteria, in the fund documentation for pooled fund
structures or in a client’s Investment Management Agreement.
LGIM: Resilient performance despite market volatility
24
• Continue to build on credentials as a responsible investor and remain
committed to addressing environmental and social challenges
‒ As at H1 2022, £271.2bn managed in responsible investment
strategies explicitly linked to ESG criteria3
25. 22.5
6.9 1.3
34.9
UK DB UK DC Wholesale International
1 1
1,421.5
1,289.7 1,289.7
65.6
(0.9)
(196.5)
AUM progression from FY21 to HY22 (£bn)
• Record external net flows of £65.6bn driven by:
– International flows of £34.5bn, representing
53% of the total, reflecting deepening strategic
relationships with clients across Asia, Japan and
US
– Strong UK DB flows into LDI/Active Fixed
Income of £27.0bn as clients seek to de-risk in
volatile markets and benefit from LGIM’s growing
Responsible Investing product range
– UK DC external net flows of £6.9bn with 22
scheme wins in H1 2022. The default strategy for
the majority of schemes is multi-asset or target
date funds
• Annualised Net New Revenue of £13m from these
net flows reflecting continued growth in higher margin
areas including multi-asset, ETFs and index solutions
HY 2022
FY 2021 Markets & Other
Movements
External
flows
25
Internal Flows &
PRT transfers
LGIM: Record net flows in volatile markets
1. Includes ETF net flows
26. Financial Highlights H1 2021 H1 2022
Operating profit (£m) 292 332
- UK & US Insurance 134 185
- Retail Retirement 158 147
Investment and other variances (£m) 260 670
Profit before tax (£m) 552 1,002
Protection Annual premium (£m) 203 196
Protection Gross written premium (£m) 1,500 1,605
Retirement new business (£m) 897 791
Workplace Savings net flows (£bn) 6.0 4.3
Solvency II New business value (£m) 164 124
- UK & US Protection 131 92
- Individual annuities 33 32
26
Retail: Robust Trading Performance
• Operating Profit of £332m, up 14%, driven by the on-going
release from the growing UK protection and individual annuity
portfolios, in addition to valuation uplifts in two of our retail
Fintech businesses over H1 2022
• US Insurance continued to experience significant adverse
mortality experience, in line with the wider market, with total
Covid claims in line with the £57m provision set up at year end
• Profit before tax up to £1bn, with investment variance driven by
the formulaic impact on reserves of rising government yields in
both the UK and US
• Insurance gross written premium up 7% to £1.6bn, reflecting
robust new business volumes across all businesses
• Individual annuity volumes of £453m. Lifetime mortgage and
RIO1 mortgage advances of £338m, achieved in highly
competitive retail markets
• Solvency II NBV down 24% to £124m, reflecting lower volumes
in Retail Protection, after a strong first half in 2021 aided by the
buoyant housing market
• $114m dividend paid by LGIA on 3rd March 2022 (2021: $111m)
1. Retirement Interest Only
28. In summary
£1,160m
Operating profit
H1 2021: £1,079m, +8%
£0.9bn
SII operational surplus
generation
H1 2021: £0.8bn, +14%
21.3%
Return on equity
H1 2021: 22.0%
28
• We have delivered a strong set
of results, and are confident in
achieving our five year ambitions
• Our balance sheet is strong and
resilient to market events
• For FY 2022 we expect to deliver:
‒ Full year operating profit
growth in line with H1
‒ £1.8bn of capital
generation (OSG)
212%
Solvency II coverage
ratio
H1 2021: 182%
30. A compelling investment case
30
An established track record of consistent and profitable growth: between HY11-HY22 we
delivered 11% CAGR in EPS, 11% CAGR in DPS and 8% CAGR in Book Value per Share
A highly synergistic and growth-oriented business model, driving c20% ROE, and strongly
aligned to six long-term, macro growth drivers. Delivering domestic and international growth
Long-term and predictable value creation: very long duration business (30-40 years), with
earnings driven by a growing stock of accumulated assets
A proven robust and resilient balance sheet: with no defaults and 100% of scheduled cash flows
from Direct Investments
A clear purpose, a longstanding commitment to Inclusive Capitalism and a leader in ESG,
with a focus on execution and delivery
A clear set of growth ambitions to 2024 – with attractive annual growth in the dividend and
ongoing investment in high quality new business – against which we are making good progress
1
2
3
4
5
6
31. Strength and growth
2022 Half year results
£1,355m
Operating profit from divisions
H1 2021: £1,271m, +7%
19.28p
Earnings per share
H1 2021 17.78p, +8%
5.44p
Interim dividend
H1 2021: 5.18p, +5%
21.3%
Return on equity
H1 2021: 22.0%
212%
Solvency ratio
H1 2021: 182%
33. We have improved the quality of our portfolio as it has grown. Our
default experience is low and investment variances net positive
33
2007 2008 2009 2010 2011 2012 2013 2014 2015 2016 2017 2018 2019 2020 2021 H1-22
Annuity bond portfolio (£bn) 16.2 17.1 21.4 23.4 26.3 29.3 30.0 40.7 39.4 49.9 52.5 57.4 70.1 80.4 81.8 73.2
% that is investment grade 90 90 89 91 92 91 89 88 97 98 99 99 99 98 99 99
Credit default reserve (£bn) 0.5 1.2 1.5 1.5 1.6 1.7 1.8 2.3 2.2 2.7 2.7 2.9 3.2 3.5 3.4 2.7
Actual default losses (£m) 1 24 0 0 0 0 0 0 0 0 0 0 0 0 0 0
Investment Variance (£m) (9) (204) (168) 102 172 (3) 63 67 78 37 4 95 43 15 242 186
Annuity bond portfolio ratings, credit default reserve and investment variance
Investment variances have netted positive £720m over this time period
Note: Investment variances for 2007-2012 are for the Risk division which incorporated Annuities, UK Protection and General Insurance business
We had c£130m of Russian exposures in the bond portfolio at FY21. These were subsequently downgraded from BBB to un-rated and have now been marked at c£35m. They have not yet defaulted.
34. Bond portfolio by rating Bond portfolio by geography Bond portfolio by asset type Bond portfolio by sector
We have a high quality, diversified investment grade book
34
£73.2bn
93% of total
Annuity
assets
£73.2bn
93% of total
Annuity
assets
£73.2bn
93% of total
Annuity
assets
£73.2bn
93% of total
Annuity
assets
AAA 10%
AA 21%
A 33%
BBB 35%
BB or below 1%
UK 49%
USA 33%
Europe 10%
RoW 8%
Traded credit 72%
Direct investments 20%
Lifetime mortgages 8%
Infrastructure 15%
Utilities 15%
Consumer services & goods 15%
Sovereign-like assets 14%
Lifetime mortgages 8%
Technology & telecoms 6%
Real Estate 5%
Other 22%
35. Counterparty Sector Country of Risk
Investment
value (£m)
1 National Grid PLC Utilities UK 558
2 E.ON SE Utilities Germany 481
3 FGP TopCo Ltd Economic Infrastructure UK 343
4 CK Hutchison Holdings Ltd Economic Infrastructure UK 300
5 Severn Trent PLC Utilities UK 297
6 Bayer AG Consumer, Non-cyclical Germany 225
7 Quadgas Holdings Topco Ltd Utilities UK 220
8 Kemble Water Holdings Ltd Utilities UK 210
9 Verizon Communications Inc Communications & Technology USA 206
10 Centrica PLC Utilities UK 203
3,043
12% of BBB
portfolio
35
Our BBB exposure is to high quality names
Annuity Portfolio: Top 10 BBB exposure
36. Our Direct Investments are with high quality counterparties
Counterparty Sector
Year of
Investment
Investment value
(£m)
1 HMRC Government 2016-2019 1,347
2 Amazon Communications & Technology 2016-2020 922
3 Other UK Government Government 2017-2020 871
4 Corporate Media Media 2015-2017 326
5 Comcast Corp Communications & Technology 2020 321
6 Places for People Group Ltd Social Infrastructure 2014 319
7 UK Water Utility Utilities 2018-2021 314
8 Railway Transportation Economic Infrastructure 2021 306
9 Tesco PLC Consumer, Non-cyclical 2012-2021 291
10 UK Water Utility Utilities 2018-2019 279
11 Hornsea Offshore Wind Farm Economic Infrastructure 2018 272
12 F&C Commercial Trust Real Estate (Debt) 2014 263
13 Thames Tideway Economic Infrastructure 2016-2019 254
14 London Gateway Economic Infrastructure 2016 247
15 Walney Offshore Wind Farm Economic Infrastructure 2017 237
Total 6,570
32% of DI portfolio
Assets are predominantly in city locations, with long duration cash flows secured against high
quality tenants, with limited downside valuation risk e.g. HMRC, Amazon, BBC
* Based on direct investments sourced in the UK
** Based on a weighted average
36
Annuity Portfolio: Top 15 Direct Investments by exposure*
37. ESG at L&G: Ratings and collaborations
37
ESG ratings
Year ended 31 December
2019 2020 2021
Sustainalytics1 17.5 (Low Risk) 16.0 (Low Risk) 16.5 (Low Risk)
CDP B A- B
DJSI / RobecoSAM 32nd percentile 74th percentile 79th percentile
MSCI2 AA AA AAA
Bloomberg Gender Equality Score 79% 79% 79%
FTSE4Good 78th percentile 89th percentile 91st percentile
Third party collaborations
• Aldersgate Group
• ClimateAction 100+ (LGIM)
• Get Nature Positive
• Glasgow Financial Alliance for Net Zero
• UN Global Compact
• UN Net Zero Asset Managers Initiative (LGIM)
• UN Net-Zero Asset Owner Alliance
• UN Principles for Responsible Investment
• Race to Zero
• Science-based targets initiative (SBTi)
1. Sustainalytics risk rating from 0 (negligible risk) to >40 (severe risk)
2. The use by Legal & General of any MSCI ESG Research LLGC or its affiliates (“MSCI”) data, and the use of MSCI logos, trademarks, service marks or index names herein, do not constitute a sponsorship, endorsement, recommendation, or
promotion of Legal & General by MSCI. MSCI services and data are the property of MSCI or its information providers and are provided ‘as-is’ and without warranty. MSCI names and logos are trademarks or service marks of MSCI.
Disclosure frameworks
• Task Force on Climate-related Financial Disclosures
(TCFD)
• Global Reporting Initiative (GRI)
• Sustainability Accounting Standards Board (SASB)
The following slides provide a data-driven overview of environment, social and governance (ESG) activity at L&G. We demonstrate achievements to date, key metrics
and some of our future commitments but these slides do not cover all ESG activity. Please refer to the Group’s Climate Report (published in March) and Sustainability
Report (published in May) for further details.
38. ESG at L&G: Journey to net zero
38
Environmental metrics
Year ended 31 December
2019 2020 2021
Scope 1 and Scope 2 emissions (tCO2e)5 38,942 31,640 30,706
Balance sheet investments (tCO2e/£m)6 120 89 74
Business travel (tCO2e) 7,223 3,045 2,070
1. See Climate Report and Sustainability Report for full list of achievements to date and commitments in detail.
2. From a 2019 baseline.
3. This was driven in part by COVID-19 and market volatility impacts. In particular, the impact of COVID-19 on 2020 emissions is seen in the 2021 numbers due to the carbon data lag. We may see a partial reversal in future years.
4. LETI 2030 target: <300kgCO2/m2 Upfront carbon A1-5, excl sequestration. RIBA 2030 target: <625kgCO2/m2 Embodied carbon A1-5, B1-5, C1-4, incl sequestration.
5. Calculated using The Greenhouse Gas Protocol Corporate Accounting and Reporting Standard. Emission Factors are from the UK Government Emissions Conversion Factors for Greenhouse Gas Company reporting (BEIS 2020).
6. 2019 calculated using Enterprise Value (EV); 2020 and 2021 calculating using Enterprise Value including Cash (EVIC) on updated methodology and emissions dataset.
Commitments1 Date Achievements to date
Invest
By the start of 2025, we will reduce portfolio greenhouse gas
emission intensity by 18.5%2 and increase financing of low carbon
technology and infrastructure.
2025
We reduced the greenhouse gas emission intensity of our proprietary assets by
17.0%3 compared to last year.
We are targeting a net zero carbon footprint asset portfolio by 2050
and continue to evolve our interim targets against this objective.
2050
Coal exclusions extended, including avoiding investment in new coal mining, plant
or business operations.
Influence
LGIM are committed to working in partnership with our clients to
reach net zero greenhouse gas emissions by 2050 or sooner across
all assets under management.
2050
We continue to develop investment solutions which support the low-carbon
transition and a number of funds have set accelerated net zero targets. We
continue to use our Climate Impact Pledge to drive change through engagement.
Operate
All homes delivered by CALA will be designed to meet the LETI and
RIBA 2030 target for embodied carbon standards from 20254.
2025
CALA are already delivering new homes in Scotland which meet LETI and RIBA
2030 targets for embodied carbon4.
We will set science-based targets in accordance with the Science
Based Target initiative (SBTi) by the end of 2022 and publish them
in 2023 (once SBTi verification has been achieved).
2022
We are building out our target metric suite, covering both our core operational and
our proprietary investment-financed emissions.
39. ESG at L&G: Building a better society
39
Year ended 31 December
Products 2019 2020 2021
Number of pension customers (‘000) 758 765 764
Life insurance payments (£m) 392 460 479
Percentage of life insurance claims paid (%) 97 97 98
Critical illness payments (£m) 224 203 209
Percentage of critical illness claims paid (%) 92 92 93
Number of employees of businesses whose lives we insure (m) 2.0 2.1 1.8
Amount paid to group protection customers who have died (£m) 232 243 252
Commitments1 Date
We will measure social value across 20% of our property assets by value 2023
We will deliver 3,000 new affordable homes each year 2023
LGIM will engage with investee companies on themes that create more resilient societies, including diversity, income inequality and financial inclusion Ongoing
What have we achieved so far
Our affordable homes business now has a pipeline of 5,500 homes across the UK
We established a multi-million pound charitable fund with the University College of London (UCL) to address UK health inequalities
We support community causes, including educational programmes and charity partnerships, and continued to match employee charity funding
1. See Sustainability Report for full list of commitments.
40. ESG at L&G: Growing our business responsibly
40
Year ended 31 December
Our people 2019 2020 2021
Number of employees 8,5071 10,099 10,743
UK employees on permanent contracts (%) 87.4 95.3 95.3
Female Board directors (%) 36 30 30
Female middle/senior management (%) 38 352 36
Difference in median hourly rate of pay between male and female employees (%) 28.5 26.6 24.1
Investment in UK employee learning and development (£m) 4.5 5.3 4.4
Employee satisfaction index (%) 72 77 76
Number of RIDDOR accidents 171 27 25
Commitments3 Date
Continue to report progress on narrowing our gender pay gap Ongoing
Continue to improve the data we hold on our people, including on ethnicity and other protected characteristics Ongoing
As a signatory of the Women in Finance Charter, we have committed to achieving overall workforce gender balance by 2025; 40% female representation among
managers and senior managers; and 33% female representation on our Board.
2025
1. Excludes employees of smaller LGC businesses.
2. 2020 impacted by the sale of our Mature Savings and General Insurance businesses, which had a more equal gender balance.
3. See Sustainability Report for full list of commitments.
What have we achieved so far
Our employee satisfaction score is 76, remaining above pre-pandemic levels
We improved ethnic minority representation on our Board in response to the Parker Review
We continue to make progress in narrowing the Gender Pay Gap to 24.1% (2020: 26.6%)
We have improved the D&I data we hold on our employees, increasing the number of employees for whom we hold ethnicity data to 67.9% (2020: 52.6%)
41. ESG at L&G: Growing our business responsibly
41
Year ended 31 December
2019 2020 2021
Number of companies covered by our Climate Impact Pledge c.80 c.1,000 c.1,000
Number of company engagements from our Investment Stewardship team 739 891 773
Number of worldwide resolutions on which we voted1 50,900 66,037 67,551
Number of directors whose election we opposed due to governance concerns 4,055 4,700 5,379
Number of new responsible investment strategies launched 14 20 37
AUM in responsible investment strategies (£bn) 150 207 290
Exclusions
• Coal and oil sands2
• Controversial weapons
• UN Global Compact violation (LGIM)
1. Voting instructions for main FTSE pooled funds.
2. See our Climate Report for our coal and oil sands policy.
LGIM Active Ownership
Additional resources
We release further details on ESG at L&G in our annual reporting,
including our Climate Report (prepared in line with TCFD
recommendations) and Gender Pay Gap Report (published later in
March) and Sustainability Report (published later in the year). These
can be found using the below links:
• Results, reports and presentations
• Sustainability reporting centre