Download as PDF, PPTX


![39
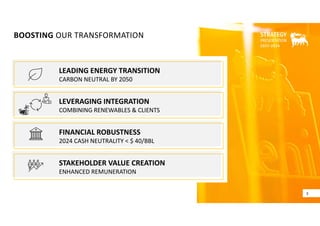
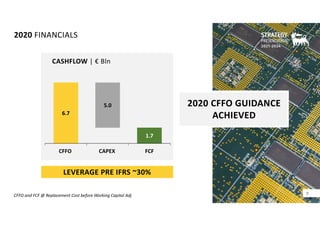
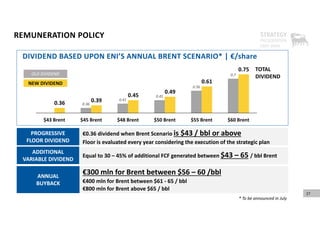
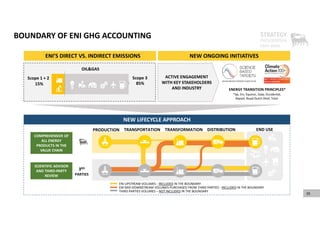
KEY PROJECTS STARTING UP IN 2021‐24 [1/2]
Start up: 2022 (Early Prod.: June ’19)
2021 Equity: 19 kboed
FF Progress: 53%
Production (kboed):
92 (100%) @ 2025 ‐ 60 (eq.) @2022
Area 1 Full Field 100% WI
MEXICO
LIQ
LIBYA
LIBYA
ANGOLA Nené ph. 2B Full Field 65% WI
Start up: 2022 (Early Prod.: March ’20)
2021 Equity: 1 kboed
Production (kboed):
15 (100%) – 10 (equity) @2024
CONGO
LIQ
Merakes 65% WI
Start up: Q2 2021
2021 Equity: 34 kboed
Progress: 88%
Production (kboed):
84 (100%) – 50 (equity) @2022
GAS
INDONESIA
Mahani 50% WI
Start up: January 2021
2021 Equity: 2 kboed
Production (kboed):
18 (100%) – 9 (equity ) @2023
GAS
UAE
Cabaça North 37% WI
Start up: H2 2021
2021 Equity: 1 kboed
Production (kboed):
10 (100%) – 4 (equity) @2023
ANGOLA
LIQ
NOTE: Average yearly production in peak year/ at plateau
Coral FLNG
Start up: 2022
Progress: 81%
Production (kboed):
107 (100%) – 28 (equity) @2023
25% WI
MOZAMBIQUE
GAS
INDONESIA
Balder X 63% WI
Start up: 2022
Progress: 26%
Production (kboed):
78 (100%) – 49 (equity) @2023
LIQ
NORWAY
Fenja 31% WI
Start up: 2022
Progress: 74%
Production (kboed):
31 (100%) – 10 (equity) @2024
LIQ
NORWAY
LIQ](https://image.slidesharecdn.com/2021enistrategyfinal-210222081551/85/Eni-Strategic-Plan-2021-2024-towards-zero-emissions-39-320.jpg)
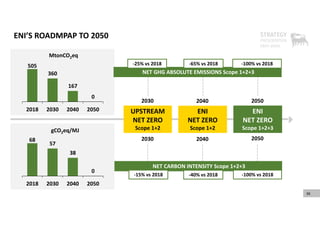
![40
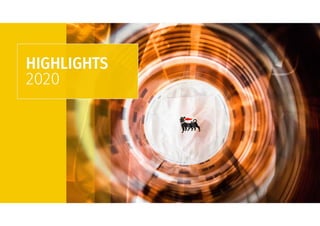
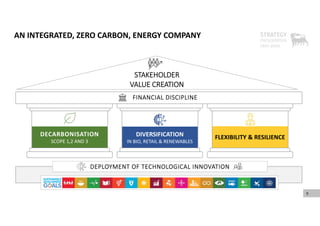
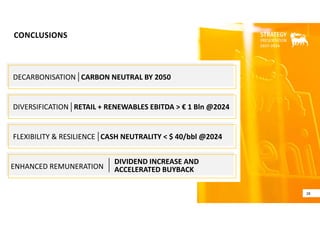
KEY PROJECTS STARTING UP IN 2021‐24 [2/2]
Dalma Gas 25% WI
Start up: 2023
Production (kboed):
54 (100%) – 13 (equity) @2024
UAE
GAS
LIQ
NORWAY
Breidablikk 29% WI
Start up: 2024
Progress: < 5%
Production (kboed):
57 (100%) – 17 (equity) @2026
NORWAY
LIQ
Johan Castberg 21% WI
NORWAY
Start up: 2023
Progress: 55%
Production (kboed):
190 (100%) – 40 (equity) @2025
LIQ
KEP 1A 29% WI
Start up: 2024
Production (kboed):
26 (100%) – 3 (equity) @2026
LIQ
KAZAKHSTAN
Northern Gas Complex 26% WI
Start up: 2024
Production (kboed):
130 (100%) – 33 (equity) @2025
GAS
ANGOLA
Agogo EP ph.2 37% WI
Start up: 2023 (Ph.1: Dec ‘19)
2021 Equity: 6 kboed
Production (kboed):
30 (100%) – 10 (equity) @2023
ANGOLA
LIQ
GAS](https://image.slidesharecdn.com/2021enistrategyfinal-210222081551/85/Eni-Strategic-Plan-2021-2024-towards-zero-emissions-40-320.jpg)

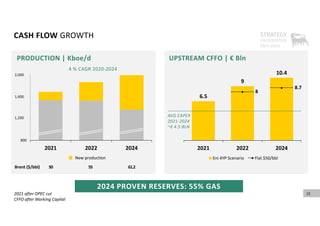
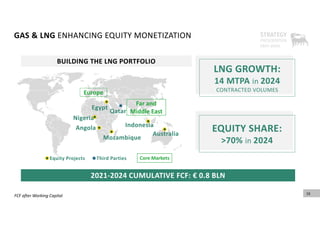
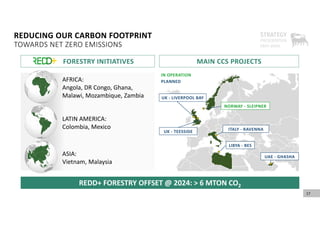
This document discusses Eni's strategic plan to transition to a zero-carbon integrated energy company by 2050. It outlines Eni's goals to reduce greenhouse gas emissions through increasing renewable energy capacity, developing biorefineries, implementing carbon capture projects, and leveraging natural gas. Eni expects to double adjusted EBITDA from retail and renewable businesses between 2021 and 2024. The plan also focuses upstream portfolio on short cycle projects with high returns, aims for annual cash flow growth of 4% through 2024, and establishes a progressive dividend policy tied to oil prices.


