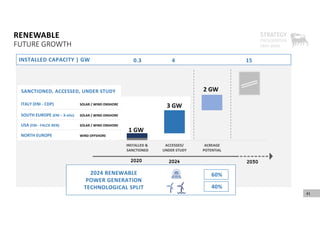
(MEERA) Dapodi Call Girls Just Call 7001035870 [ Cash on Delivery ] Pune Escorts
ENI strategy-2021-2024.pdf
1.
2. This document contains forward‐looking statements regarding future events and the future results of Eni that are based on current expectations, estimates, forecasts, and projections about
the industries in which Eni operates and the beliefs and assumptions of the management of Eni. In addition, Eni’s management may make forward‐looking statements orally to analysts,
investors, representatives of the media and others. In particular, among other statements, certain statements with regard to management objectives, trends in results of operations,
margins, costs, return on capital, risk management and competition are forward looking in nature. Words such as ‘expects’, ‘anticipates’, ‘targets’, ‘goals’, ‘projects’, ‘intends’, ‘plans’,
‘believes’, ‘seeks’, ‘estimates’, variations of such words, and similar expressions are intended to identify such forward‐looking statements. These forward‐looking statements are not
guarantees of future performance and are subject to risks, uncertainties, and assumptions that are difficult to predict because they relate to events and depend on circumstances that will
occur in the future. Therefore, Eni’s actual results may differ materially and adversely from those expressed or implied in any forward‐looking statements. Factors that might cause or
contribute to such differences include, but are not limited to, those discussed in Eni’s Annual Reports on Form 20‐F filed with the U.S. Securities and Exchange Commission (the “SEC”) under
the section entitled “Risk factors” and in other sections. These factors include but are not limited to:
• Fluctuations in the prices of crude oil, natural gas, oil products and chemicals;
• Strong competition worldwide to supply energy to the industrial, commercial and residential energy markets;
• Safety, security, environmental and other operational risks, and the costs and risks associated with the requirement to comply with related regulation, including regulation on GHG
emissions;
• Risks associated with the exploration and production of oil and natural gas, including the risk that exploration efforts may be unsuccessful and the operational risks associated with
development projects;
• Uncertainties in the estimates of natural gas reserves;
• The time and expense required to develop reserves;
• Material disruptions arising from political, social and economic instability, particularly in light of the areas in which Eni operates;
• Risks associated with the trading environment, competition, and demand and supply dynamics in the natural gas market, including the impact under Eni take‐or‐pay long‐term gas supply
contracts;
• Laws and regulations related to climate change;
• Risks related to legal proceedings and compliance with anti‐corruption legislation;
• Risks arising from potential future acquisitions; and
• Exposure to exchange rate, interest rate and credit risks.
Any forward‐looking statements made by or on behalf of Eni speak only as of the date they are made. Eni does not undertake to update forward‐looking statements to reflect any changes in
Eni’s expectations with regard thereto or any changes in events, conditions or circumstances on which any such statement is based. The reader should, however, consult any further
disclosures Eni may make in documents it files with or furnishes to the SEC and Consob.
DISCLAIMER
2
3. BOOSTING OUR TRANSFORMATION
3
LEADING ENERGY TRANSITION
CARBON NEUTRAL BY 2050
LEVERAGING INTEGRATION
COMBINING RENEWABLES & CLIENTS
FINANCIAL ROBUSTNESS
2024 CASH NEUTRALITY < $ 40/BBL
STAKEHOLDER VALUE CREATION
ENHANCED REMUNERATION
4.
5. 2020: FAST REACTION TO COVID CRISIS
>35% CAPEX REDUCTION
vs original 2020 guidance
‐€ 1.9 BLN COST SAVINGS
vs pre‐covid level
FID RESCHEDULING ON
LARGE UPSTREAM PROJECTS
INCREASED CAPEX ON
GREEN PROJECTS
COSTS PORTFOLIO FINANCIALS
PEOPLE HEALTH AND BUSINESS CONTINUITY
5
LEVERAGE* MAINTAINED
AT 30%
*Pre IFRS
NEW COMPANY ORGANIZATION
LONG TERM DECARBONISATION PLAN
FIRST ISSUANCE OF HYBRID
BONDS OF € 3 BLN
6. ENERGY EVOLUTION
2020 MAIN RESULTS
NATURAL RESOURCES
PRODUCTION: 1,733 KBOE/D
DISCOVERED RESOURCES: 400 MBOE
GAS & LNG: EBIT € 330 MLN (+70%)
FORESTRY REDD+: OFFSET 1.5 MTON CO2EQ.; CCUS UK LICENSE AWARDED
RENEWABLES: 1 GW CAPACITY INSTALLED AND SANCTIONED
ENTERED WORLD’S LARGEST OFFSHORE WIND PROJECT IN UK
RETAIL G&P: EBIT € 330 MLN (+ 17%)
BIO REFINING & MARKETING: EBIT € 550 MLN (+27%)
6
OIL, GAS, LNG CCS/CCUS AND FORESTRY
TRADITIONAL TO BIO, BLUE, GREEN PRODUCTS
7. CASHFLOW | € Bln
2020 FINANCIALS
CFFO and FCF @ Replacement Cost before Working Capital Adj
LEVERAGE PRE IFRS ~30%
1.7
6.7
5.0
CFFO CAPEX FCF
2020 CFFO GUIDANCE
ACHIEVED
7
8.
9. AN INTEGRATED, ZERO CARBON, ENERGY COMPANY
9
DIVERSIFICATION
IN BIO, RETAIL & RENEWABLES
FLEXIBILITY & RESILIENCE
DECARBONISATION
SCOPE 1,2 AND 3
DEPLOYMENT OF TECHNOLOGICAL INNOVATION
STAKEHOLDER
VALUE CREATION
FINANCIAL DISCIPLINE
10. 10
10
SUPPORTING BUSINESS…
SUPERCOMPUTING
CAPACITY
HSE
MODELING
ALGORITHMS
…SHAPING THE FUTURE
CIRCULAR ECONOMY &
CHEMICALS FROM
RENEWABLES
CCU
TECHNOLOGIES
SUSTAINABLE
MOBILITY
RENEWABLES &
BREAKTHROUGH
TECHNOLOGIES
ENHANCING VALUE
THROUGH DIGITALIZATION & NEW TECHNOLOGIES
CO2
ASSET
INTEGRITY
€ 1 BLN 4YP
INNOVATION EXPENDITURE
€ 4 BLN 4YP
GREEN ORGANIC CAPEX
Green capex: Decarbonisation, Circular and Renewables
11. ENI NET ZERO EMISSIONS BY 2050
ABSOLUTE NET SCOPE 1+2+3 GHG EMISSIONS
CARBON FREE PRODUCTS AND SERVICES
INCREASED SHARE OF GAS ON TOTAL
PRODUCTION
BIO‐METHANE FOR DOMESTIC USE AND
MOBILITY
BIOREFINERIES AND CIRCULAR ECONOMY
BLUE AND GREEN HYDROGEN
CCS AND REDD+ PROJECTS
LEVERS
2018 2030 2040 2050
‐25%
‐65%
NET
ZERO
11
11
NET CARBON
INTENSITY
Scope 1+2+3
‐15% ‐40% ‐100%
FULLY COMPREHENSIVE METHODOLOGY
CONSIDERING ALL OUR ACTIVITIES AND ALL PRODUCTS WE TRADE
12.
13. UPSTREAM FLEXIBILITY AND RESILIENCE
RESILIENCE
FLEXIBILITY
2021‐2024
CAPEX
€ 4.5 BLN
AVERAGE PER YEAR
UPSTREAM CAPEX COVERAGE| $/Bbl
>55% UNCOMMITTED IN 2023‐24
2021 2024
‐24%
37
28
13
Upstream capex coverage = Brent price at which upstream capex are covered by upstream CFFO
14. Oil Gas O&G Mboe Equity < 100 100‐200 > 200
14
44%
44%
12%
NEAR FIELD
PROVEN
BASINS
FRONTIER
2021‐2024 WELLS
2021‐2024
Target
2 Bln boe equity
UEC $ 1.6/boe
LOW RISK PORTFOLIO
Western Desert
Nile Delta
Levantine
EXPLORATION LED BY GAS, TIME TO MARKET & EFFICIENCY
Barents
Norwegian Sea
North Sea
Berkine
Arabic Gulf
Oman
Sureste
Transform Margin
Lower Congo
Lamu
Angoche
Andamane
Song Hong
Kutei
MAIN BASINS & DISCOVERY EXPECTATIONS IN 4Y PLAN
15. CASH FLOW GROWTH
4 % CAGR 2020‐2024
2024 PROVEN RESERVES: 55% GAS
2021 after OPEC cut
CFFO after Working Capital
50
Brent ($/bbl) 55 61.2
New production
UPSTREAM CFFO | € Bln
PRODUCTION | Kboe/d
15
6.5
9
10.4
8
8.7
2021 2022 2024
Eni 4YP Scenario Flat $50/bbl
AVG CAPEX
2021‐2024
~€ 4.5 BLN
800
1,200
1,600
2,000
2021 2022 2024
2,000
1,600
1,200
16. GAS & LNG ENHANCING EQUITY MONETIZATION
LNG GROWTH:
14 MTPA in 2024
CONTRACTED VOLUMES
16
Egypt
Nigeria
Angola
Mozambique
Indonesia
Australia
Equity Projects
Europe
Far and
Middle East
Third Parties
2021‐2024 CUMULATIVE FCF: € 0.8 BLN
BUILDING THE LNG PORTFOLIO
Qatar
EQUITY SHARE:
>70% in 2024
Core Markets
FCF after Working Capital
17. REDUCING OUR CARBON FOOTPRINT
TOWARDS NET ZERO EMISSIONS
AFRICA:
Angola, DR Congo, Ghana,
Malawi, Mozambique, Zambia
FORESTRY INITIATIVES
REDD+ FORESTRY OFFSET @ 2024: > 6 MTON CO2
MAIN CCS PROJECTS
LATIN AMERICA:
Colombia, Mexico
ASIA:
Vietnam, Malaysia
UK ‐ LIVERPOOL BAY
NORWAY ‐ SLEIPNER
17
UK ‐ TEESSIDE ITALY ‐ RAVENNA
UAE ‐ GHASHA
LIBYA ‐ BES
PLANNED
IN OPERATION
18.
19. REFINING & MARKETING
A PROGRESSIVE CONVERSION TO BIO‐PRODUCTS
Adj. EBIT* | € Bln BIO‐REFINERIES CAPACITY
19
PALM‐OIL FREE IN 2023
2020 2024
1.1
MTPA
2
MTPA
0.6
1.1
1.4
Bio‐Refining and Marketing
Oil Refining (incl. Adnoc)
2021 2024
Scenario
Eni
Flat Scenario
2021
*Pro‐forma with Adnoc
DOUBLING RESULTS BY 2024
Scenario
Eni
20. 20
20
RETAIL + RENEWABLE
INCREASING INTEGRATION ALONG THE GREEN POWER VALUE CHAIN
VALUE ADDED PROPOSITION LEVERAGING OUR RETAIL BASE
INSTALLED RENEWABLE
CAPACITY| GW
RETAIL BASE| MLN CLIENTS
GEOGRAPHICAL FOOTPRINT
0.7
4
15
>10
>11
15
2021 2024 2030
21. 21
RENEWABLE
RETAIL
Adj. EBITDA | € Bln
MAXIMISING
VALUE GENERATION
2021 2024
0.6
1
RETAIL + RENEWABLE
INCREASING INTEGRATION ALONG THE GREEN POWER VALUE CHAIN
22.
23. NEW BUSINESS COMBINATIONS
TO FOCUS AND MAXIMIZE GROWTH
M&A
TO SPEED UP PORTFOLIO TRANSFORMATION
NEW FINANCIAL TOOLS LINKED TO
SUSTAINABILITY KPIs
FLEXIBILITY AND SELECTIVITY
IN THE CAPEX PLAN
FINANCIAL STRATEGY
23
A PROGRESSIVE AND COMPETITIVE
DISTRIBUTION POLICY
STRONG
BALANCE
SHEET
24. SELECTIVE CAPEX AND HIGH VALUE PORTFOLIO
AVG CAPEX ~ € 7 BLN
UPSTREAM OTHERS
GREEN+RETAIL
FOCUS ON GREEN & RETAIL AND SHORT CYCLE PROJECTS
IRR – RENEWABLES
65%
20% 15%
16%
18%
20%
‐20% Eni Scenario +20%
IRR – UPSTREAM
Projects in execution
2%
6%
10%
14%
Unlevered Levered
Green: Decarbonisation, Circular and Renewables
24
25. PORTFOLIO OPTIMIZATION STRATEGY
NEW BUSINESS COMBINATIONS
(REPLICATE VÅR ENERGI SUCCESS)
UPSTREAM
RATIONALIZATION OF
NON CORE ASSETS
OTHER BUSINESSES
ASSETS OPTIMIZATION
2021 ‐ 2024
DISPOSAL
PLAN
€ >2 BLN
GROSS
25
26. CFFO and FCF @ Replacement Cost before Working Capital Adj. Eni Scenario 2021: Brent $50/bl, PSV €147/kcm & €/$ 1.19
RESILIENT CASH GENERATION AND FLEXIBILITY
26
2024 CASH NEUTRALITY @ FLOOR DIVIDEND < $40/BBL
CFFO| € Bln
4YP FCF
@Eni Scenario
€ 17 BLN
4YP FCF
@$50/bbl
€ 12 BLN
AVG CAPEX
2021‐2024
~ € 7 BLN
0
5
10
15
2022 2024
Eni Scenario @50$/bbl
2021
27. 27
ADDITIONAL
VARIABLE DIVIDEND
€0.36 dividend when Brent Scenario is $43 / bbl or above
Floor is evaluated every year considering the execution of the strategic plan
PROGRESSIVE
FLOOR DIVIDEND
Equal to 30 – 45% of additional FCF generated between $43 – 65 / bbl Brent
0.36
0.41
0.45
0.56
0.7
0.36 0.39
0.45
0.49
0.61
0.75
$43 Brent $45 Brent $48 Brent $50 Brent $55 Brent $60 Brent
DIVIDEND BASED UPON ENI’S ANNUAL BRENT SCENARIO* | €/share
TOTAL
DIVIDEND
OLD DIVIDEND
NEW DIVIDEND
ANNUAL
BUYBACK
€300 mln for Brent between $56 – 60 /bbl
€400 mln for Brent between $61 ‐ 65 / bbl
€800 mln for Brent above $65 / bbl
* To be announced in July
REMUNERATION POLICY
35. BOUNDARY OF ENI GHG ACCOUNTING
35
3RD
PARTIES
PRODUCTION TRANSPORTATION TRANSFORMATION DISTRIBUTION END USE
ENI UPSTREAM VOLUMES ‐ INCLUDED IN THE BOUNDARY
THIRD PARTIES VOLUMES – NOT INCLUDED IN THE BOUNDARY
ENI MID‐DOWNSTREAM VOLUMES PURCHASED FROM THIRD PARTIES ‐ INCLUDED IN THE BOUNDARY
COMPREHENSIVE OF
ALL ENERGY
PRODUCTS IN THE
VALUE CHAIN
SCIENTIFIC ADVISOR
AND THIRD‐PARTY
REVIEW
NEW LIFECYCLE APPROACH
NEW ONGOING INITIATIVES
ACTIVE ENGAGEMENT
WITH KEY STAKEHOLDERS
AND INDUSTRY ENERGY TRANSITION PRINCIPLES*
*bp, Eni, Equinor, Galp, Occidental,
Repsol, Royal Dutch Shell, Total
ENI’S DIRECT VS. INDIRECT EMISSIONS
OIL&GAS
Scope 1 + 2 Scope 3
15% 85%
36. 36
505
360
167
0
2018 2030 2040 2050
MtonCO2eq
gCO2eq/MJ
68
57
38
0
2018 2030 2040 2050
NET GHG ABSOLUTE EMISSIONS Scope 1+2+3
NET CARBON INTENSITY Scope 1+2+3
2050
2030 2040
ENI
NET ZERO
Scope 1+2+3
‐100% vs 2018
‐15% vs 2018 ‐40% vs 2018 ‐100% vs 2018
UPSTREAM
NET ZERO
Scope 1+2
ENI
NET ZERO
Scope 1+2
‐25% vs 2018 ‐65% vs 2018
2050
2030 2040
ENI’S ROADMAP TO 2050
37. MAIN DECARBONISATION TARGET
37
grafico
GHG
EMISSIONS
CCS
FORESTRY
2021 2035 2040 2050
NET ZERO CARBON FOOTPRINT SCOPE 1+2
2030
2025
2021 2035 2040
2030
2025
NET LIFECYCLE EMISSIONS SCOPE 1+2+3 VS 2018
NET CARBON INTENSITY SCOPE 1+2+3 VS 2018
PROCESS FLARING | msM3
UPSTREAM GHG EMISSION INTENSITY VS 2014
FUGITIVE METHANE EMISSIONS UPS VS 2014
CARBON EFFICIENCY INDEX (2014‐2021)
ENI NET ZERO
UPS NET ZERO
UPS ‐50%
@2024
‐25% NET ZERO
‐65%
NET ZERO
0
‐43%
‐80%
reached @2019
‐2% YoY
~ 7 50
>6 MTPA
@ 2024
CARBON CAPTURE & STORAGE CO2
(Mton CO2/y)
POTENTIAL ABSORPTION FORESTRY
(Mton CO2/y)
~ 40
20
‐15% ‐40%
2024
38. 2024
MAIN BUSINESSES TARGETS
38
RETAIL
2021 2035 2040 2050
CUSTOMER BASE | MLN POD
2030
2025
2021 2035 2040
2030
2025
PALM OIL FREE
INSTALLED CAPACITY | GW
NATURAL GAS PRODUCTION |
% ON PORTFOLIO
BIO
REFINING
RENEWABLES
OIL & GAS
BIO REFINING | MLN TON/Y
>11 15
5‐6
>20
>90
60
60
15
2
4
1.1
5
BY 2023
>25
39. 39
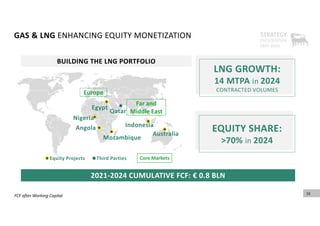
KEY PROJECTS STARTING UP IN 2021‐24 [1/2]
Start up: 2022 (Early Prod.: June ’19)
2021 Equity: 19 kboed
FF Progress: 53%
Production (kboed):
92 (100%) @ 2025 ‐ 60 (eq.) @2022
Area 1 Full Field 100% WI
MEXICO
LIQ
LIBYA
LIBYA
ANGOLA Nené ph. 2B Full Field 65% WI
Start up: 2022 (Early Prod.: March ’20)
2021 Equity: 1 kboed
Production (kboed):
15 (100%) – 10 (equity) @2024
CONGO
LIQ
Merakes 65% WI
Start up: Q2 2021
2021 Equity: 34 kboed
Progress: 88%
Production (kboed):
84 (100%) – 50 (equity) @2022
GAS
INDONESIA
Mahani 50% WI
Start up: January 2021
2021 Equity: 2 kboed
Production (kboed):
18 (100%) – 9 (equity ) @2023
GAS
UAE
Cabaça North 37% WI
Start up: H2 2021
2021 Equity: 1 kboed
Production (kboed):
10 (100%) – 4 (equity) @2023
ANGOLA
LIQ
NOTE: Average yearly production in peak year/ at plateau
Coral FLNG
Start up: 2022
Progress: 81%
Production (kboed):
107 (100%) – 28 (equity) @2023
25% WI
MOZAMBIQUE
GAS
INDONESIA
Balder X 63% WI
Start up: 2022
Progress: 26%
Production (kboed):
78 (100%) – 49 (equity) @2023
LIQ
NORWAY
Fenja 31% WI
Start up: 2022
Progress: 74%
Production (kboed):
31 (100%) – 10 (equity) @2024
LIQ
NORWAY
LIQ
40. 40
KEY PROJECTS STARTING UP IN 2021‐24 [2/2]
Dalma Gas 25% WI
Start up: 2023
Production (kboed):
54 (100%) – 13 (equity) @2024
UAE
GAS
LIQ
NORWAY
Breidablikk 29% WI
Start up: 2024
Progress: < 5%
Production (kboed):
57 (100%) – 17 (equity) @2026
NORWAY
LIQ
Johan Castberg 21% WI
NORWAY
Start up: 2023
Progress: 55%
Production (kboed):
190 (100%) – 40 (equity) @2025
LIQ
KEP 1A 29% WI
Start up: 2024
Production (kboed):
26 (100%) – 3 (equity) @2026
LIQ
KAZAKHSTAN
Northern Gas Complex 26% WI
Start up: 2024
Production (kboed):
130 (100%) – 33 (equity) @2025
GAS
ANGOLA
Agogo EP ph.2 37% WI
Start up: 2023 (Ph.1: Dec ‘19)
2021 Equity: 6 kboed
Production (kboed):
30 (100%) – 10 (equity) @2023
ANGOLA
LIQ
GAS
41. RENEWABLE
FUTURE GROWTH
41
2020 2030
2024
NORTH EUROPE WIND OFFSHORE
ITALY (ENI ‐ CDP) SOLAR / WIND ONSHORE
USA (ENI ‐ FALCK REN) SOLAR / WIND ONSHORE
SOUTH EUROPE (ENI – X‐elio) SOLAR / WIND ONSHORE
INSTALLED CAPACITY | GW
60%
40%
INSTALLED &
SANCTIONED
ACCESSED/
UNDER STUDY
ACREAGE
POTENTIAL
2 GW
3 GW
1 GW
0.3 4 15
SANCTIONED, ACCESSED, UNDER STUDY
2024 RENEWABLE
POWER GENERATION
TECHNOLOGICAL SPLIT