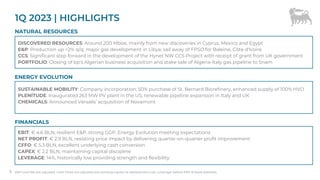
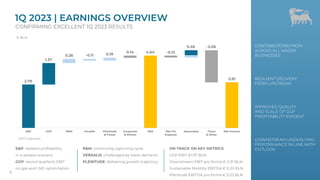
ENI reported its 1Q 2023 results, delivering on performance and strategy:
- Production was up over 2% quarter-over-quarter to 1.66 million barrels of oil equivalent per day.
- EBIT was €4.6 billion and net profit was €2.9 billion, resisting price impacts through profit improvement.
- Cash flow from operations was €5.3 billion with excellent underlying cash conversion.
- Leverage remained low at 14% providing financial strength and flexibility.
Eni reported its 1H 2023 results. EBIT for the period was €8 billion, in line with guidance despite a weaker scenario of Brent -31% and PSV -62%. Cash flow from operations was €9.5 billion, covering capital expenditure and distribution. Production for the period averaged 1.61 million boe/day, up 2% year-on-year. Guidance for 2023 was reiterated or updated, with GGP EBIT guidance raised to €2.7-3 billion. The results demonstrate Eni's resilience in a lower price environment and progress on its strategic priorities.
This document contains forward-looking statements from Eni regarding future performance based on current expectations and assumptions. Certain statements regarding management objectives, trends, margins, costs, risk management and competition are forward-looking in nature. Actual results may differ from those expressed or implied due to various risk factors. These factors include fluctuations in oil, gas and product prices; strong competition; safety, security and environmental regulation; risks of oil and gas exploration and development projects; uncertainties in natural gas reserves estimates; and political and economic instability.
Eni: trasformata in società forte e solida, punta all’espansione. L'Italia è ...Eni
L’AD Claudio Descalzi illustra il Piano strategico 2018-2021 alla comunità finanziaria italiana e fa il punto sulla sicurezza e sullo stato delle attività della compagnia in Italia.
This document contains forward-looking statements regarding Eni's future performance. It discusses key risks to Eni's business like fluctuations in oil and gas prices. It also outlines Eni's 2014-2017 strategy of upstream enhancement, mid-downstream restructuring, and financial resilience to transform into a fully integrated oil and gas company well positioned for a lower commodity price scenario. The strategy focused on exploration, production efficiency, cost reductions, and consolidation to strengthen cash flow.
This document contains forward-looking statements regarding Eni's future performance. These statements are based on Eni's current expectations and assumptions which are subject to risks and uncertainties. The document discusses Eni's 2014-2017 strategy of upstream enhancement, mid-downstream restructuring, and maintaining financial resilience to position the company for a lower oil price scenario in the future. It provides targets for upstream cash flow coverage of capital expenditures and dividends. Key projects expected to come online through 2021 are highlighted that will drive production growth and increase cash flow per barrel.
Eni's strategy presentation outlines plans for 2019-2022 focusing on organic growth, renewables expansion, upstream growth, and circular economy initiatives. Key targets include doubling the LNG portfolio by 2022, 3.5% annual upstream production growth, and over €900 million invested in decarbonization efforts. The strategy aims to balance capital discipline with sustainable long-term growth through projects increasing efficiency, natural gas production, and zero carbon energy sources.
Eni outlines targets for 2020-2023 aimed at transitioning to a more sustainable business model. Key targets include generating €23 billion in free cash flow, achieving cash neutrality by 2023, and investing €4 billion in green initiatives. Upstream targets include growing production 3.5% annually, reducing greenhouse gas intensity 38% by 2023, and more than doubling upstream free cash flow to €6 billion annually. Midstream and downstream targets focus on tripling earnings and free cash flow by 2023 through expanding retail customers, services, and sustainable fuels.
Eni Strategic Plan 2021-2024: towards zero emissionsEni
This document discusses Eni's strategic plan to transition to a zero-carbon integrated energy company by 2050. It outlines Eni's goals to reduce greenhouse gas emissions through increasing renewable energy capacity, developing biorefineries, implementing carbon capture projects, and leveraging natural gas. Eni expects to double adjusted EBITDA from retail and renewable businesses between 2021 and 2024. The plan also focuses upstream portfolio on short cycle projects with high returns, aims for annual cash flow growth of 4% through 2024, and establishes a progressive dividend policy tied to oil prices.
Permian reported strong 2Q earnings growth from increased production and higher prices. While commodity prices remain volatile, ExxonMobil's sustained investments have driven leading US tight oil growth and increased US refining capacity to meet recovering demand. ExxonMobil continues to advance large-scale carbon capture and storage projects to provide energy and reduce emissions.
bp reported strong third quarter 2021 results with underlying replacement cost profit of $5.9 billion, up from $4.7 billion in the previous quarter. Operating cash flow was $6 billion including a $1.8 billion working capital build. bp executed a $1.25 billion share buyback from first half surplus cash flow and announced an additional buyback. The results were driven by higher oil and gas prices and strong performances across all segments.
Chesapeake Energy reported 3Q 2019 earnings. The presentation discusses the company's financial discipline and profitable growth strategy focused on capturing resources. Key highlights included establishing an oil production record in the Brazos Valley, improving well economics in the Powder River Basin, and the Marcellus asset generating an estimated $300 million in free cash flow. Chesapeake also summarized recent drilling results and operational improvements across its assets.
1) SandRidge Energy presented at the Howard Weil Energy Conference on March 24, 2015. The presentation provided an overview of the company, its assets and operations, capital expenditure plans for 2015, and strategies for adapting to lower oil prices.
2) Key points included outlining a $700 million capital expenditure budget for 2015, a plan to reduce the rig count from 19 to 7 rigs, and targeting $200 million in proceeds from asset sales. The presentation also highlighted efficiency gains and expanded use of multilaterals to reduce well costs.
3) SandRidge demonstrated success in 2014 by growing reserves 37% and type curves 27%, with 47% production growth in the Midcontinent. The presentation emphasized preserving value
The document discusses EnLink Midstream Partners, LP, a master limited partnership focused on midstream energy services. It notes that EnLink has a stable cash flow due to 95% of contracts being fee-based and 50% from long-term Devon contracts. It also highlights EnLink's organic growth strategy through expansion projects in regions like South Louisiana, West Texas, and Ohio River Valley. Finally, it identifies four avenues for future growth: dropdowns from sponsor Devon Energy, organic expansion projects, third-party acquisitions, and potential new basin development with Devon.
BP reported strong second quarter 2021 financial results. Underlying replacement cost profit was $2.8 billion, an increase from $2.6 billion in the first quarter. Operating cash flow was $5.4 billion. Net debt was reduced to $32.7 billion. BP executed a $1.4 billion share buyback in the second quarter and expects to buy back around $1 billion per quarter on average. The company is committed to growing its resilient dividend by around 4% annually through 2025.
2017 scotia howard weil energy conference finalGib Knight
- Newfield Exploration Company is focused on developing its large acreage position in the Anadarko Basin, which it believes can deliver decades of high returns through drilling.
- Newfield has a proven track record of finding and developing valuable plays and is a proven operator that has taken multiple plays from concept to development.
- Newfield's financial strength and capital discipline allows it to execute its development plan, even at current commodity prices, through continued Anadarko Basin oil growth.
bp reported its third quarter 2022 financial results. Some key highlights include:
- Underlying replacement cost profit of $8.2 billion, lower than previous quarter due to lower refining margins and oil trading performance.
- Operating cash flow of $8.3 billion including a $6.2 billion working capital build.
- Net debt of $22.0 billion, lower than previous quarter.
- A $2.5 billion share buyback was announced.
The document provides guidance for SandRidge Energy's 2015 operations including:
- Capital expenditures of $700 million focused on drilling and production in key areas.
- Production guidance of 28-30.5 million barrels of oil equivalent.
- Plans to reduce rig count from 19 to 7 while expanding use of multilaterals.
- Focus on capital discipline, cost reductions, and preserving drilling locations and returns.
Progress energy resources corp. cibc new york mini conference no-appendixProgressEnergy
Daniel Topolinsky gave a presentation at the CIBC New York Mini-Conference on October 4, 2011. The presentation discussed Progress Energy's exploration and development activities, including its large land holdings in tight gas in northwest Alberta and an emerging Montney play. Progress has significant potential for growth from its inventory of gas and light oil opportunities in the Deep Basin and Montney formations, where it is pursuing strategic partnerships to accelerate development.
August 2022 Chevron Investor Presentation.pdfPatsyBaader
- Chevron presented its investor presentation, outlining its strategy and financial priorities.
- It aims to lower its carbon intensity and grow its lower carbon businesses while maintaining capital and cost discipline across its upstream and downstream businesses.
- Chevron expects to grow production over 3% annually through 2026 while decreasing unit operating costs and increasing returns on capital employed.
Greg Garland, Chairman and CEO of Phillips 66, discussed the company's accomplishments in 2014 and outlook. Key points included executing a $4 billion capital program, returning $4.7 billion to shareholders, and increasing the dividend rate by 28%. Garland projected over 30% growth in adjusted EBITDA by 2018 through expanding midstream and chemicals businesses. He emphasized Phillips 66's commitment to growing distributions and maintaining a strong balance sheet.
bp reported its fourth quarter and full year 2020 financial results. Key points include:
- Underlying replacement cost loss of $100 million for Q4 2020 and $5.7 billion for full year 2020.
- Net debt of $38.9 billion as of December 31, 2020, down from $51.4 billion a year earlier.
- Capital expenditure was reduced by around 40% in 2020 compared to 2019 and is expected to be around $13 billion in 2021.
- Cash costs were reduced by 12% in 2020 and further reductions are expected through 2023.
bp reported strong financial results for 1Q 2021, achieving its $35 billion net debt target and commencing share buybacks. Key highlights included exceptional gas marketing performance, significantly higher oil prices, and higher refining margins compared to 4Q 2020. bp also made disciplined strategic progress across its businesses, including major project delivery and partnerships to advance its EV charging and renewable strategies.
- Sandridge Energy provides a 3-year plan to grow production 20% annually through developing its large inventory of drilling locations in the Midcontinent region, focused on the Mississippian formation.
- The company has achieved strong well results that exceed type curves, including 30-day rates for Mississippian wells of 412 boe/d. Innovation in techniques like pad drilling and multilaterals has reduced well costs to a record low of $2.85 million.
- Sandridge has a significant acreage position with over 4,500 identified high-graded locations and estimates over 8,000 additional locations through emerging zones. Financial strength includes $919 million in cash and no bond maturities until 2020.
- Sandridge Energy provides a 3-year plan to grow production 20% annually through developing its large inventory of drilling locations in the Midcontinent region, focused on the Mississippian formation.
- The company has achieved strong early results from new zones like the Chester and Woodford, and from expanding into new areas. Well costs have declined to a record low of $2.85 million per lateral through pad drilling and other innovations.
- Sandridge has a significant acreage position with over 4,500 identified high-graded locations and potential in additional zones provides decades of drilling inventory. Financial strength with $919 million of cash and no bond maturities until 2020 provides funding for continued growth.
A copy of Chesapeake Energy's PowerPoint presentation at the Heikkinen Energy Conference in August 2016. Several slides show Chesapeake's shale drilling strategy, which will focus on the Eagle Ford and Haynesville Shale plays in the near-term.
SandRidge Energy presented at an energy conference, outlining its strategy to thrive in a lower oil price environment through capital discipline and efficiency gains. Key points:
- The company plans to reduce its 2015 capital expenditures to $700 million, down from $1.6 billion in 2014, through lower well costs, expanded use of multilaterals, and other efficiencies.
- SandRidge expects its new strategy will allow it to grow production 6% in 2015 while drilling fewer wells and lowering its rig count.
- The company has a strong hedge position and recently negotiated more flexible debt covenants to bolster its financial position in the current market.
SandRidge Energy presented at an energy conference, outlining their operations and strategy in response to lower oil prices. Key points included:
1) A $700 million capital budget for 2015, down from $1.6 billion in 2014, focusing on efficiency gains and expanded use of multilaterals to preserve returns.
2) Demonstrating success in 2014 through production growth, increased reserves, and pioneering multilaterals in the Mississippian.
3) Pursuing appraisal and redevelopment opportunities in legacy reservoirs like the Chester and Woodford to further extend the drilling inventory.
This document outlines Eni's strategy and outlook for transitioning to a lower carbon business model focused on natural gas, renewables, biorefining and other clean technologies. Key points include growing gas production and renewable capacity, tripling renewables by 2030, expanding biorefining capacity to over 1 million tons by 2026, and pursuing CCUS and other transition technologies. The strategy is expected to generate highly competitive growth and returns while providing affordable, secure and sustainable energy.
This document provides a summary of Eni's results for fiscal year 2023. Some key highlights include:
- Eni met or exceeded its strategic priorities and guidance across all key business areas such as upstream production, downstream earnings, and cash flow.
- Financial results were strong with adjusted EBIT of €13.8 billion and net profit of €8.3 billion, significantly outperforming Eni's scenario.
- Important projects were delivered such as the start-up of Congo LNG and Baleine field in Congo, and over 900 million boe of discovered resources.
- Transition businesses like Plenitude and EniLive performed well, with Plenitude installing 3GW of
Eni reported its results for the first nine months of 2023. Key highlights included:
- EBIT of €11 billion and net profit of €6.7 billion, in line with one of Eni's strongest performances.
- Cash flow from operations of €12.9 billion and capital expenditure of €6.7 billion, demonstrating strong cash conversion.
- Upstream production growth of 1% quarter-on-quarter and 4% year-on-year, in line with full-year guidance.
- Plenitude's EBITDA guidance increased to around €0.9 billion, more than double 2019 levels.
- Leverage remained at a historically low 15%, and the company accelerated
Eni will acquire Neptune Energy in a $4.9 billion deal. Eni will pay $2.6 billion to acquire Neptune Energy excluding its Norwegian and German operations. Vår Energi will purchase Neptune Energy's Norwegian operations for $2.3 billion. The acquisition reinforces Eni and Vår Energi's positions in Europe and provides access to Neptune Energy's global portfolio of gas assets. The deal is expected to close in the first quarter of 2024 pending regulatory approvals.
This document summarizes the company's FY 2021 results. Key highlights include:
- Upstream production of 1.7 million barrels of oil equivalent per day, in line with guidance. Over 700 million barrels of oil equivalent resources were discovered.
- Gas & Greenhouse Gas business achieved strong results from portfolio optimization and long-term contract negotiations.
- Plenitude reached its accelerated yearly target of over 2 GW of renewable energy installed and under construction.
- Financial results included EBIT of €9.7 billion, net income of €4.7 billion, and cash flow from operations of €12.7 billion. The dividend was returned to pre-COVID levels.
- In the first nine months of 2021, Eni achieved an EBIT of €5.9 billion and net income of €2.6 billion, with cash flow from operations of €8.1 billion.
- Upstream production was in line with guidance at 1.66 million barrels of oil equivalent per day. A major new discovery was made in Ivory Coast.
- The retail and renewables business saw EBITDA increase to €0.44 billion, with the IPO process for the division starting.
- Leverage remained low at 0.28x, and the 2021 guidance for production, exploration discoveries, and green gas plant earnings was reaffirmed.
The document summarizes Eni's H1 2021 results and provides an update on its Retail and Renewables business. Some key points:
- Eni's Haliade-X wind turbine will power the first two phases of the Dogger Bank Wind Farm in the North Sea.
- H1 2021 results show adjusted EBIT of €3.4 billion and net income of €1.2 billion. Cash flow from operations was €4.8 billion.
- Eni's Retail and Renewables business is growing its customer base and expanding its renewable energy capacity targets. It aims to have over 6GW of installed capacity by 2025 and over 15GW by 2030.
1) Eni reported 1Q 2021 production of 1.7 MBOED in line with yearly guidance and discovered 120 MBOE of new resources mainly in Norway and Angola. EBIT adjusted was flat at €1.3 billion while net income adjusted increased to €0.27 billion.
2) The Damietta LNG plant in Egypt resumed operations, exporting 9 cargoes in 1Q 2021. Merakes gas field in Indonesia started up in April 2021, contributing an estimated 30 kboed in 2021.
3) Retail and renewables performed excellently with the acquisition of Dogger Bank and entrance into the Spanish market. Leverage remained flat at around 0.3.
- Eni reported results for the first 9 months of 2020, highlighting production of 1.74 million barrels of oil equivalent per day, exploration successes in various countries, and a positive contribution from its bio-refineries.
- Cash flow from operations was in line with guidance at €5.1 billion, capital expenditures were also in line with guidance at €3.8 billion, and free cash flow was positive despite challenging market conditions.
- Eni strengthened its balance sheet by issuing €3 billion in hybrid bonds and maintained its investment grade credit ratings.
Short and medium term strategy updated: costs and capex optimization increased; energy transition targets confirmed, and investments in businesses linked to decarbonization raised. New shareholders’ remuneration policy put in place.
- Production for 9M 2019 was 1.85 million barrels of oil equivalent per day, a 2% increase over 9M 2018. Four new start-ups are planned for production.
- Exploration discoveries totaled 650 million barrels of oil equivalent in equity resources.
- A deal was announced to acquire ExxonMobil's assets in Norway to form Vår Energi, which will have over 350 thousand barrels of oil equivalent per day of production by 2023.
- Financial results for 9M 2019 include cash flow from operations of €9.4 billion, a 5% increase over 9M 2018, and capex of €5.6 billion.
H1 2019 results saw:
1) Oil and gas production of 1.83 Mboed, down 1.9% from H1 2018 but up 4% adjusted for Intisar. Mexico Area 1 start up in June 2019.
2) Exploration discoveries of 350 Mboe equity resources and 20% farm out of Merakes exploration.
3) Upstream EBIT of €4.4 billion despite a weaker market scenario, and upstream CFFO of €5.6 billion, up 6% year-on-year.
Today, Eni’s Board of Directors approved the Group results for the first quarter of 2019 (unaudited). Commenting on the results, Claudio Descalzi, CEO of Eni, remarked:
“I am very pleased of the excellent industrial and financial performance delivered by Eni in IQ 2019. Particularly, in light of a substantially unchanged market scenario, the E&P business has improved its operating profit by 25% compared to the first quarter of 2018, confirming our expectations of the business growing cash generation for the full year. The results of the G&P segment also improved; the 16% increase in operating profit to €372 million puts us on the path to achieving our €500 million profit target for the full year. The performance of the Downstream R&M and Chemicals business offset the effect of weaker margins and we expect to see a broad recovery over the next nine months, particularly in oil Refining and Marketing. Overall, first quarter operations generated a cash flow of €3.42 billion, up 8% and €1.5 billion greater than the investments for the period of around €1.9 billion, which is in line with the expectations of €8 billion for the whole year. The Group confirms that it can leverage on the quality and robustness of its asset portfolio, capable of covering costs, investments and dividends at a Brent price of US$ 55, in addition to generating a cash surplus in the event of higher prices, as in current trading conditions.”
Eni reported strong financial results for the 2018 full year. Key highlights included:
- Reaching a new production record of 1.85 million barrels of oil equivalent per day, a 2.5% increase from 2017.
- Reserves replacement ratio from all sources was 124%, with over 600 million barrels of oil equivalent added in new resources.
- Cash flow from operations increased 39% to €13.9 billion compared to 2017.
- Leverage at the end of 2018 was 16%, equal to a gearing of 14%. Safety and environmental performance also improved over 2017 levels.
Our performance in the third quarter, which allowed us to record cash flow from operations of €4.1 billion, double what we achieved in the same period last year and, even more remarkable, 35% higher than the
previous quarter. All the businesses have performed well, with the Upstream division showing that it can thrive in an
environment of either flat or increasing oil prices. The Mid and Downstream businesses continue their recovery,
demonstrating sustainable profitability despite an unfavorable environment."
Eni Results for the Second Quarter and Half Year 2018Eni
Eni recorded another period of strong profitability in the second quarter. In the context of a 38% rise in the price of Brent, Eni reported a 152% increase in operating profit, driven by the performance of the Exploration & Production business, which more than tripled its contribution. Our cash generation also grew significantly, driven by the price of Brent and increased production levels, contributing to $20 per barrel, allowing us to confirm the lowering of our cash neutrality to $55 per barrel for 2018. The Gas & Power segment also reported excellent results, thanks to the strong integration of the LNG business with upstream activities and the positive impact of the restructuring carried out over the last years. A deterioration in Refining and Chemicals environment – which runs counter-cyclically to the price of Brent – meant a reduction in the contribution of these businesses, albeit remaining positive thanks to recent restructuring. There was significant progress in our portfolio management this quarter with the creation of Vår Energi in Norway as well as the funds received for the sale of Eni’s 10% stake in the Zohr field to Mubadala. As a result, net debt fell below €10 billion – the lowest level in 11 years. Consequently I will propose an interim dividend of €0.42 per share at the Board meeting on 13 September.
We operate in 71 different countries around the globe, with more than 32.000 men and women working for us.
Our work is based on passion and innovation, on our unique strengths and skills, on the quality of our people and in recognising that diversity across all aspects of our operations and organisation is something to be cherished.
3 Simple Steps To Buy Verified Payoneer Account In 2024SEOSMMEARTH
Buy Verified Payoneer Account: Quick and Secure Way to Receive Payments
Buy Verified Payoneer Account With 100% secure documents, [ USA, UK, CA ]. Are you looking for a reliable and safe way to receive payments online? Then you need buy verified Payoneer account ! Payoneer is a global payment platform that allows businesses and individuals to send and receive money in over 200 countries.
If You Want To More Information just Contact Now:
Skype: SEOSMMEARTH
Telegram: @seosmmearth
Gmail: seosmmearth@gmail.com
The Evolution and Impact of OTT Platforms: A Deep Dive into the Future of Ent...ABHILASH DUTTA
This presentation provides a thorough examination of Over-the-Top (OTT) platforms, focusing on their development and substantial influence on the entertainment industry, with a particular emphasis on the Indian market.We begin with an introduction to OTT platforms, defining them as streaming services that deliver content directly over the internet, bypassing traditional broadcast channels. These platforms offer a variety of content, including movies, TV shows, and original productions, allowing users to access content on-demand across multiple devices.The historical context covers the early days of streaming, starting with Netflix's inception in 1997 as a DVD rental service and its transition to streaming in 2007. The presentation also highlights India's television journey, from the launch of Doordarshan in 1959 to the introduction of Direct-to-Home (DTH) satellite television in 2000, which expanded viewing choices and set the stage for the rise of OTT platforms like Big Flix, Ditto TV, Sony LIV, Hotstar, and Netflix. The business models of OTT platforms are explored in detail. Subscription Video on Demand (SVOD) models, exemplified by Netflix and Amazon Prime Video, offer unlimited content access for a monthly fee. Transactional Video on Demand (TVOD) models, like iTunes and Sky Box Office, allow users to pay for individual pieces of content. Advertising-Based Video on Demand (AVOD) models, such as YouTube and Facebook Watch, provide free content supported by advertisements. Hybrid models combine elements of SVOD and AVOD, offering flexibility to cater to diverse audience preferences.
Content acquisition strategies are also discussed, highlighting the dual approach of purchasing broadcasting rights for existing films and TV shows and investing in original content production. This section underscores the importance of a robust content library in attracting and retaining subscribers.The presentation addresses the challenges faced by OTT platforms, including the unpredictability of content acquisition and audience preferences. It emphasizes the difficulty of balancing content investment with returns in a competitive market, the high costs associated with marketing, and the need for continuous innovation and adaptation to stay relevant.
The impact of OTT platforms on the Bollywood film industry is significant. The competition for viewers has led to a decrease in cinema ticket sales, affecting the revenue of Bollywood films that traditionally rely on theatrical releases. Additionally, OTT platforms now pay less for film rights due to the uncertain success of films in cinemas.
Looking ahead, the future of OTT in India appears promising. The market is expected to grow by 20% annually, reaching a value of ₹1200 billion by the end of the decade. The increasing availability of affordable smartphones and internet access will drive this growth, making OTT platforms a primary source of entertainment for many viewers.
At Techbox Square, in Singapore, we're not just creative web designers and developers, we're the driving force behind your brand identity. Contact us today.
Best practices for project execution and deliveryCLIVE MINCHIN
A select set of project management best practices to keep your project on-track, on-cost and aligned to scope. Many firms have don't have the necessary skills, diligence, methods and oversight of their projects; this leads to slippage, higher costs and longer timeframes. Often firms have a history of projects that simply failed to move the needle. These best practices will help your firm avoid these pitfalls but they require fortitude to apply.
Recruiting in the Digital Age: A Social Media MasterclassLuanWise
In this masterclass, presented at the Global HR Summit on 5th June 2024, Luan Wise explored the essential features of social media platforms that support talent acquisition, including LinkedIn, Facebook, Instagram, X (formerly Twitter) and TikTok.
The 10 Most Influential Leaders Guiding Corporate Evolution, 2024.pdfthesiliconleaders
In the recent edition, The 10 Most Influential Leaders Guiding Corporate Evolution, 2024, The Silicon Leaders magazine gladly features Dejan Štancer, President of the Global Chamber of Business Leaders (GCBL), along with other leaders.
Company Valuation webinar series - Tuesday, 4 June 2024FelixPerez547899
This session provided an update as to the latest valuation data in the UK and then delved into a discussion on the upcoming election and the impacts on valuation. We finished, as always with a Q&A
Event Report - SAP Sapphire 2024 Orlando - lots of innovation and old challengesHolger Mueller
Holger Mueller of Constellation Research shares his key takeaways from SAP's Sapphire confernece, held in Orlando, June 3rd till 5th 2024, in the Orange Convention Center.
buy old yahoo accounts buy yahoo accountsSusan Laney
As a business owner, I understand the importance of having a strong online presence and leveraging various digital platforms to reach and engage with your target audience. One often overlooked yet highly valuable asset in this regard is the humble Yahoo account. While many may perceive Yahoo as a relic of the past, the truth is that these accounts still hold immense potential for businesses of all sizes.
How MJ Global Leads the Packaging Industry.pdfMJ Global
MJ Global's success in staying ahead of the curve in the packaging industry is a testament to its dedication to innovation, sustainability, and customer-centricity. By embracing technological advancements, leading in eco-friendly solutions, collaborating with industry leaders, and adapting to evolving consumer preferences, MJ Global continues to set new standards in the packaging sector.
LA HUG - Video Testimonials with Chynna Morgan - June 2024Lital Barkan
Have you ever heard that user-generated content or video testimonials can take your brand to the next level? We will explore how you can effectively use video testimonials to leverage and boost your sales, content strategy, and increase your CRM data.🤯
We will dig deeper into:
1. How to capture video testimonials that convert from your audience 🎥
2. How to leverage your testimonials to boost your sales 💲
3. How you can capture more CRM data to understand your audience better through video testimonials. 📊
Understanding User Needs and Satisfying ThemAggregage
https://www.productmanagementtoday.com/frs/26903918/understanding-user-needs-and-satisfying-them
We know we want to create products which our customers find to be valuable. Whether we label it as customer-centric or product-led depends on how long we've been doing product management. There are three challenges we face when doing this. The obvious challenge is figuring out what our users need; the non-obvious challenges are in creating a shared understanding of those needs and in sensing if what we're doing is meeting those needs.
In this webinar, we won't focus on the research methods for discovering user-needs. We will focus on synthesis of the needs we discover, communication and alignment tools, and how we operationalize addressing those needs.
Industry expert Scott Sehlhorst will:
• Introduce a taxonomy for user goals with real world examples
• Present the Onion Diagram, a tool for contextualizing task-level goals
• Illustrate how customer journey maps capture activity-level and task-level goals
• Demonstrate the best approach to selection and prioritization of user-goals to address
• Highlight the crucial benchmarks, observable changes, in ensuring fulfillment of customer needs
Tata Group Dials Taiwan for Its Chipmaking Ambition in Gujarat’s DholeraAvirahi City Dholera
The Tata Group, a titan of Indian industry, is making waves with its advanced talks with Taiwanese chipmakers Powerchip Semiconductor Manufacturing Corporation (PSMC) and UMC Group. The goal? Establishing a cutting-edge semiconductor fabrication unit (fab) in Dholera, Gujarat. This isn’t just any project; it’s a potential game changer for India’s chipmaking aspirations and a boon for investors seeking promising residential projects in dholera sir.
Visit : https://www.avirahi.com/blog/tata-group-dials-taiwan-for-its-chipmaking-ambition-in-gujarats-dholera/
Tata Group Dials Taiwan for Its Chipmaking Ambition in Gujarat’s Dholera
2023 1Q Results.pdf
1. ENI 1Q 2023 RESULTS
Delivering on Performance and Strategy
APRIL 28, 2023
Sail Away of Firenze FPSO to Côte d'Ivoire from Dubai
2. DISCLAIMER
This document contains forward-looking statements regarding future events and the future results of Eni that are based on current expectations, estimates, forecasts, and
projections about the industries in which Eni operates and the beliefs and assumptions of the management of Eni. In addition, Eni’s management may make forward-
looking statements orally to analysts, investors, representatives of the media and others. In particular, among other statements, certain statements with regard to
management objectives, trends in results of operations, margins, costs, return on capital, risk management and competition are forward looking in nature. Words such as
‘expects’, ‘anticipates’, ‘targets’, ‘goals’, ‘projects’, ‘intends’, ‘plans’, ‘believes’, ‘seeks’, ‘estimates’, variations of such words, and similar expressions are intended to identify such
forward-looking statements. These forward-looking statements are not guarantees of future performance and are subject to risks, uncertainties, and assumptions that are
difficult to predict because they relate to events and depend on circumstances that will occur in the future. Therefore, Eni’s actual results may differ materially and adversely
from those expressed or implied in any forward-looking statements. Factors that might cause or contribute to such differences include, but are not limited to, those
discussed in Eni’s Annual Reports on Form 20-F filed with the U.S. Securities and Exchange Commission (the “SEC”) under the section entitled “Risk factors” and in other
sections. These factors include but are not limited to:
• Fluctuations in the prices of crude oil, natural gas, oil products and chemicals;
• Strong competition worldwide to supply energy to the industrial, commercial and residential energy markets;
• Safety, security, environmental and other operational risks, and the costs and risks associated with the requirement to comply with related regulation, including regulation
on GHG emissions;
• Risks associated with the exploration and production of oil and natural gas, including the risk that exploration efforts may be unsuccessful and the operational risks
associated with development projects;
• Uncertainties in the estimates of natural gas reserves;
• The time and expense required to develop reserves;
• Material disruptions arising from political, social and economic instability, particularly in light of the areas in which Eni operates;
• Risks associated with the trading environment, competition, and demand and supply dynamics in the natural gas market, including the impact under Eni take-or-pay
long-term gas supply contracts;
• Laws and regulations related to climate change;
• Risks related to legal proceedings and compliance with anti-corruption legislation;
• Risks arising from potential future acquisitions; and
• Exposure to exchange rate, interest rate and credit risks.
Any forward-looking statements made by or on behalf of Eni speak only as of the date they are made. Eni does not undertake to update forward-looking statements to
reflect any changes in Eni’s expectations with regard thereto or any changes in events, conditions or circumstances on which any such statement is based. The reader should,
however, consult any further disclosures Eni may make in documents it files with or furnishes to the SEC and Consob.
3. 3
DISCOVERED RESOURCES: Around 200 Mboe, mainly from new discoveries in Cyprus, Mexico and Egypt
E&P: Production up >2% q/q; major gas development in Libya; sail away of FPSO for Baleine, Côte d'Ivoire
CCS: Significant step forward in the development of the Hynet NW CCS Project with receipt of grant from UK government
PORTFOLIO: Closing of bp’s Algerian business acquisition and stake sale of Algeria-Italy gas pipeline to Snam
NATURAL RESOURCES
SUSTAINABLE MOBILITY: Company incorporation; 50% purchase of St. Bernard Biorefinery, enhanced supply of 100% HVO
PLENITUDE: Inaugurated 263 MW PV plant in the US; renewable pipeline expansion in Italy and UK
CHEMICALS: Announced Versalis’ acquisition of Novamont
ENERGY EVOLUTION
EBIT: € 4.6 BLN, resilient E&P, strong GGP, Energy Evolution meeting expectations
NET PROFIT: € 2.9 BLN, resisting price impact by delivering quarter-on-quarter profit improvement
CFFO: € 5.3 BLN, excellent underlying cash conversion
CAPEX: € 2.2 BLN, maintaining capital discipline
LEVERAGE: 14%, historically low providing strength and flexibility
FINANCIALS
EBIT and Net are adjusted. Cash Flows are adjusted pre-working capital at replacement cost. Leverage: before IFRS 16 lease liabilities.
1Q 2023 | HIGHLIGHTS
4. € BLN
EBIT is adjusted.
E&P: resilient profitability
in a weaker scenario
GGP: record quarterly EBIT
on gas and LNG optimization
1Q 2023 | EARNINGS OVERVIEW
CONFIRMING EXCELLENT 1Q 2023 RESULTS
ON TRACK ON KEY METRICS
GGP EBIT €1.37 BLN
Downstream EBIT pro forma € 0.31 BLN
Sustainable Mobility EBITDA € 0.20 BLN
Plenitude EBITDA pro forma € 0.23 BLN
CONTRIBUTIONS FROM
ACROSS ALL MAJOR
BUSINESSES
IMPROVED QUALITY
AND SCALE OF GGP
PROFITABILITY EVIDENT
DOWNSTREAM UNDERLYING
PERFORMANCE IN LINE WITH
OUTLOOK
RESILIENT DELIVERY
FROM UPSTREAM
R&M: continuing capturing cycle
VERSALIS: challenged by lower demand
PLENITUDE: delivering growth trajectory
4
E&P
E&P GGP R&M Versalis Plenitude
& Power
Corporate
& Others
Ebit Net Fin
Expense
Associates Taxes
& Other
Net Income
2.79
1.37
0.26 0.19
-0.11
0.14 4.64 -0.12
0.46 -2.06
2.91
5. 4Q22
Adjusted
Pre-tax
Scenario Volumes &
Efficiency
GGP Scenario Turnaround Other Growth &
Performance
Associates Other 1Q23
Adjusted
Pre-tax
5
NATURAL
RESOURCES
DOWNSTREAM PLENITUDE
POWER
1Q 2023 vs 4Q 2022 EARNINGS
RESISTING SCENARIO HEADWINDS TO DELIVER
BUSINESS PERFORMANCE
PRODUCTION REGULARITY
AND COST DISCIPLINE
RE-SHAPED GGP
IN CHANGED CONTEXT
CAPTURES UPSIDES
CONTINUED PROGRESS
IN ENERGY EVOLUTION
NET INCOME: UP 17%, MORE THAN RESISTING PRICES
SCENARIO
LOWER PRICES
(BRENT -8%, PSV -40%)
UNFAVORABLE FX IMPACT
HIGH DEGREE OF VOLATILITY
-0.6
0.5
1.3 -0.3
0.2
0.1
~0
-0.4
-0.1
ROACE: 21% (1Y ROLLING)
5
€ BLN
4.4
5.0
RESILIENT ADNOC,
VAR AND AZULE
DESPITE SCENARIO
6. 2.9
5.3
Net Adj. DD&A adj. Other adj. CFFO
ex. WC @RC
Working
Capital
Organic
Capex
Distribution Others
FREE
CASH FLOW
6
DISTRIBUTION
AND STRATEGIC FLEXIBILITY
1Q 2023 | FINANCIAL STRENGTH
PERFORMANCE AND FINANCIAL DISCIPLINE
SIGNIFICANT CASH
GENERATION
EXCELLENT CASH
CONVERSION, CFFO COVERS
CAPEX AND REMUNERATION
SEASONAL WORKING CAPITAL
REQUIREMENTS TO REVERSE
DISCIPLINED INVESTMENT
OPTIMIZED CAPEX LEVEL
WITH NO IMPACT ON
BUSINESS
BALANCED PORTFOLIO
ACTIVITY
ADDING NEW ASSETS
OFFSET BY PORTFOLIO
RATIONALISATION
EFFICIENT BALANCE SHEET
RETAINS FLEXIBILITY
AND RESILIENCE
FY CFFO >16 BLN DESPITE SCENARIO
UNDERLYING PERFORMANCE
LEVERAGE AT 14%
WITHIN 10-20% RANGE
LIQUIDITY > € 19 BLN
HIGH LEVEL OF LIQUIDITY
€ BLN
Net Debt
Change
-0.8
INCLUDES BP’S
ALGERIAN BUSINESS
ACQUISITION AND
STAKE DISPOSAL OF
PIPELINE TO SNAM
SEASONAL WC
AND OTHER SHORT-
TERM CASH TIMING
DIFFERENCES
Net Portfolio
7. DELIVERY ON STRATEGY
DELIVERY ON PERFORMANCE
FAST TIME TO MARKET:
Important near-field exploration success in 1Q;
Baleine confirmed 2023 start-up (less than 2 years from discovery)
SHIFTING TO GAS:
Progressing production and portfolio mix towards 60% target at 2030
BUILDING BIO-REFINING SCALE:
Agreed St. Bernard Biorefinery investment with start up in 1H 2023
TRANSFORMING CHEMICALS:
Built leading bioplastic position through Versalis’ acquisition of Novamont
ENHANCED AND SIMPLIFIED DISTRIBUTION:
Seeking approval for up to €3.5bn from AGM in May with confirmed €2.2bn
programme anticipated to start shortly after
DELIVERY ON STRATEGY
PRODUCTION:
1.66 Mboed (up >2% vs 4Q 2022),
consistent with FY23 guidance (1.63-1.67 Mboed)
GGP EBIT:
Confirmed strong EBIT outlook,
highlights upside potential on base case
R&M:
Results consistent with FY guidance
in seasonally weaker quarter
EBIT:
Improving vs FY guidance in constant scenario
CASHFLOW:
Excellent financial performance and cash conversion
LEVERAGE:
14% consistent with plan guided range,
one of the lowest in recent years
7
1Q 2023 | DELIVERY
ACHIEVING OUR TARGETS
8. EBIT
PRODUCTION
GGP EBIT
PLENITUDE EBITDA1
DIVIDEND
SUST. MOBILITY EBITDA1
1 Plenitude and Sustainable Mobility: EBITDA is pro-forma; Downstream: EBIT is pro-forma.
2 Cash Flows are adjusted pre working capital at replacement cost and exclude effects of derivatives.
3 Additional potential for lower capex from continued optimization efforts and flexibility.
Updated 2023 Scenario is: Brent 85 $/bbl (unchanged), SERM 8 $/bbl (from 7 $/bbl), PSV 529 €/kmc (from 970 €/kmc) and average EUR/USD exchange rate: 1.08 (from 1.03)
CFFO2
DISCOVERED RESOURCES
BUYBACK
2023 GUIDANCE
€ 12 BLN
1.63-1.67 MBOED
€ 2 – 2.2 BLN
> € 0.7 BLN
€ 0.94/SHARE
> € 16 BLN
700 MBOE
€ 2.2 BLN
GUIDANCE
> € 0.9 BLN
8
CAPEX ~ € 9.2 BLN3
DOWNSTREAM EBIT1
€ 1 – 1.1 BLN
adjusted for
scenario and FX
adjusted for
scenario and FX
adjusted for FX
adjusted for FX
FOCUSING ON DELIVERY
GROWING BUSINESSES
GENERATING CASH
DISCIPLINED CAPEX
SHAREHOLDER DISTRIBUTION
A PRIORITY
first interim payment
in September
12. SENSITIVITY 2023
SENSITIVITY 2023
EBIT ADJ
(€ bln)
Net adj
(€ bln)
CFFO before WC
(€ bln)
Brent (1 $/bbl) 0.18 0.13 0.13
European Gas Spot Upstream (1 $/mmbtu) 0.15 0.12 0.13
Std. Eni Refining Margin (1 $/bbl) 0.14 0.10 0.14
Exchange rate $/€ (+0.05 $/€) -0.49 -0.28 -0.63
Brent sensitivity applies to liquids and oil-linked gas.
Sensitivity is valid for limited price variation.
For energy use purposes PSV variation of 1$/MMBTU has an impact of -15 mln € on SERM calculation.
12