Content:
1. Inventory:- Stockof items kept to meet
future demand.
2. Types of Inventory:- Raw materials,
Purchased parts and supplies,Work-in-
process (partially completed) products
(WIP), Items being transported,Tools and
equipment
3. Two forms of Demand:- dependent and
independent.
4. Functions of inventory.
5. Inventory Control.
3.
11. Types ofOrdering System.
◦ Periodic inventory system.
◦ Perpetual Inventory System
12. Methods of Inventory Control.
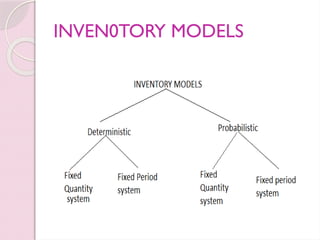
◦ Deterministic Methods
◦ Probabilistic Methods
13. Economic Order Quantity (EOQ).
14. Example of EOQ.
15. Case Study on AMAZON INDIA.
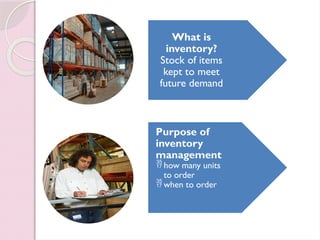
What is
inventory?
Stock ofitems
kept to meet
future demand
Purpose of
inventory
management
how many units
to order
when to order
6.
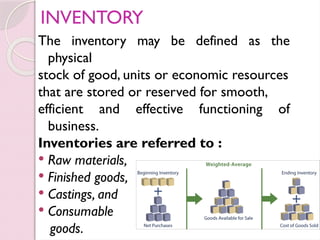
INVENTORY
The inventory maybe defined as the
physical
stock of good, units or economic resources
that are stored or reserved for smooth,
efficient and effective functioning of
business.
Inventories are referred to :
Raw materials,
Finished goods,
Castings, and
Consumable
goods.
7.
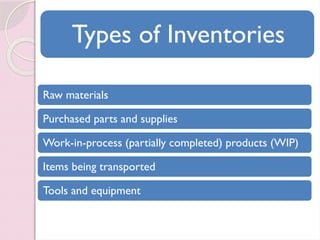
Types of Inventories
Rawmaterials
Purchased parts and supplies
Work-in-process (partially completed) products (WIP)
Items being transported
Tools and equipment
8.
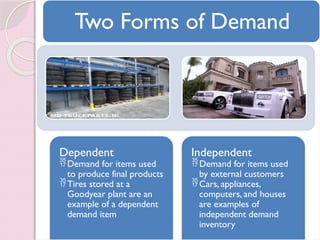
Two Forms ofDemand
Dependent
Demand for items used
to produce final products
Tires stored at a
Goodyear plant are an
example of a dependent
demand item
Independent
Demand for items used
by external customers
Cars, appliances,
computers, and houses
are examples of
independent demand
inventory
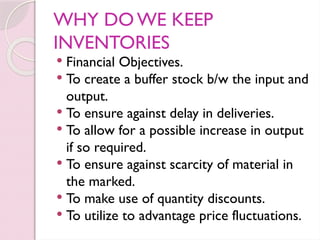
WHY DO WEKEEP
INVENTORIES
Financial Objectives.
To create a buffer stock b/w the input and
output.
To ensure against delay in deliveries.
To allow for a possible increase in output
if so required.
To ensure against scarcity of material in
the marked.
To make use of quantity discounts.
To utilize to advantage price fluctuations.
11.
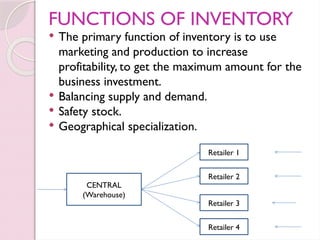
FUNCTIONS OF INVENTORY
The primary function of inventory is to use
marketing and production to increase
profitability, to get the maximum amount for the
business investment.
Balancing supply and demand.
Safety stock.
Geographical specialization.
CENTRAL
(Warehouse)
Retailer 1
Retailer 2
Retailer 3
Retailer 4
12.
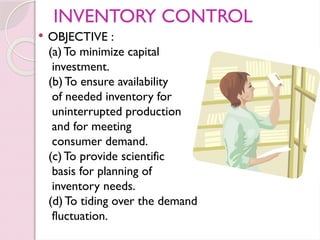
INVENTORY CONTROL
OBJECTIVE:
(a)To minimize capital
investment.
(b)To ensure availability
of needed inventory for
uninterrupted production
and for meeting
consumer demand.
(c)To provide scientific
basis for planning of
inventory needs.
(d)To tiding over the demand
fluctuation.
13.
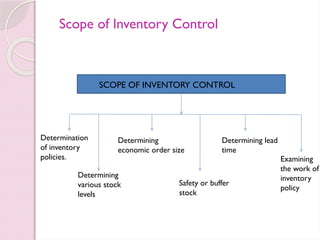
SCOPE OF INVENTORYCONTROL
Determination
of inventory
policies.
Determining
various stock
levels
Determining
economic order size
Safety or buffer
stock
Determining lead
time
Examining
the work of
inventory
policy
Scope of Inventory Control
14.
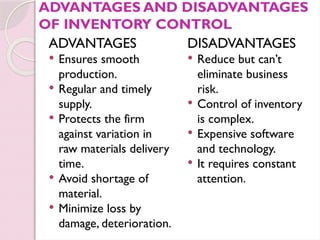
ADVANTAGES AND DISADVANTAGES
OFINVENTORY CONTROL
ADVANTAGES
Ensures smooth
production.
Regular and timely
supply.
Protects the firm
against variation in
raw materials delivery
time.
Avoid shortage of
material.
Minimize loss by
damage, deterioration.
DISADVANTAGES
Reduce but can’t
eliminate business
risk.
Control of inventory
is complex.
Expensive software
and technology.
It requires constant
attention.
15.
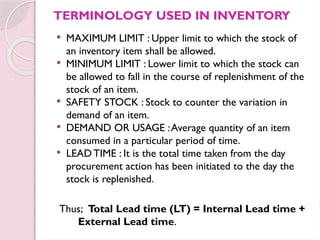
TERMINOLOGY USED ININVENTORY
MAXIMUM LIMIT : Upper limit to which the stock of
an inventory item shall be allowed.
MINIMUM LIMIT : Lower limit to which the stock can
be allowed to fall in the course of replenishment of the
stock of an item.
SAFETY STOCK : Stock to counter the variation in
demand of an item.
DEMAND OR USAGE :Average quantity of an item
consumed in a particular period of time.
LEAD TIME : It is the total time taken from the day
procurement action has been initiated to the day the
stock is replenished.
Thus; Total Lead time (LT) = Internal Lead time +
External Lead time.
16.
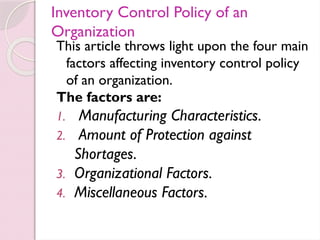
Inventory Control Policyof an
Organization
This article throws light upon the four main
factors affecting inventory control policy
of an organization.
The factors are:
1. Manufacturing Characteristics.
2. Amount of Protection against
Shortages.
3. Organizational Factors.
4. Miscellaneous Factors.
17.
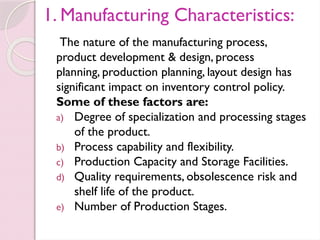
1. Manufacturing Characteristics:
Thenature of the manufacturing process,
product development & design, process
planning, production planning, layout design has
significant impact on inventory control policy.
Some of these factors are:
a) Degree of specialization and processing stages
of the product.
b) Process capability and flexibility.
c) Production Capacity and Storage Facilities.
d) Quality requirements, obsolescence risk and
shelf life of the product.
e) Number of Production Stages.
18.
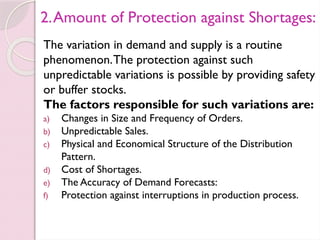
2.Amount of Protectionagainst Shortages:
The variation in demand and supply is a routine
phenomenon.The protection against such
unpredictable variations is possible by providing safety
or buffer stocks.
The factors responsible for such variations are:
a) Changes in Size and Frequency of Orders.
b) Unpredictable Sales.
c) Physical and Economical Structure of the Distribution
Pattern.
d) Cost of Shortages.
e) The Accuracy of Demand Forecasts:
f) Protection against interruptions in production process.
19.
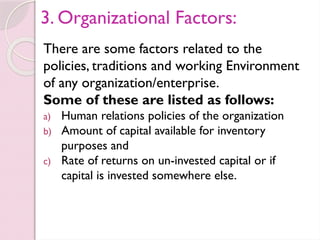
3. Organizational Factors:
Thereare some factors related to the
policies, traditions and working Environment
of any organization/enterprise.
Some of these are listed as follows:
a) Human relations policies of the organization
b) Amount of capital available for inventory
purposes and
c) Rate of returns on un-invested capital or if
capital is invested somewhere else.
20.
4. Miscellaneous Factors:
Theseare the factors related with the
overall business environment of the
region or area like:
a) Inflation rate.
b) Wars or some unforeseen natural
calamities, floods, earthquakes etc.
c) Uncertainties in communication
facilities.
21.
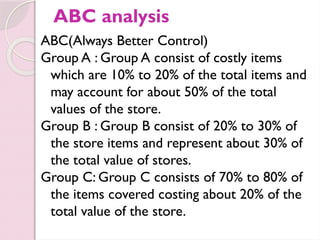
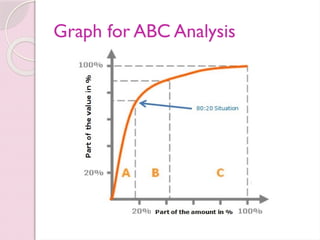
ABC analysis
ABC(Always BetterControl)
Group A : Group A consist of costly items
which are 10% to 20% of the total items and
may account for about 50% of the total
values of the store.
Group B : Group B consist of 20% to 30% of
the store items and represent about 30% of
the total value of stores.
Group C: Group C consists of 70% to 80% of
the items covered costing about 20% of the
total value of the store.
Advantages of ABCAnalysis
It provides better control over the costly
items in which a large amount of capital is
invested.
It ensures considerable reduction in the
storage charges.
It help in maintaining enough safety stock
of ‘C’ category of items.
24.
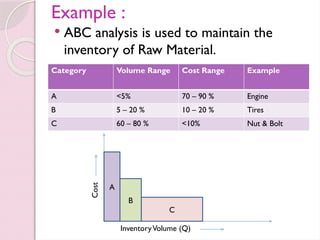
Example :
ABCanalysis is used to maintain the
inventory of Raw Material.
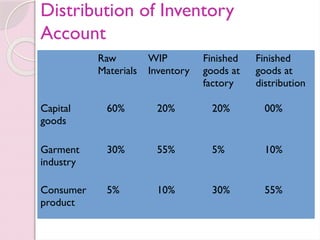
Category Volume Range Cost Range Example
A <5% 70 – 90 % Engine
B 5 – 20 % 10 – 20 % Tires
C 60 – 80 % <10% Nut & Bolt
A
B
C
Cost
InventoryVolume (Q)
25.
Cost Structure InInventory
Ordering Cost.
a) cost of ordering excess.
b) cost of ordering too less.
[cost of ordering excess + cost of
ordering too less =Total stocking cost]
Example :Transportation cost ,Salary of
purchase demand ,Loading & unloading
charge etc.
26.
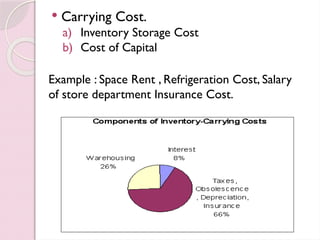
Carrying Cost.
a)Inventory Storage Cost
b) Cost of Capital
Example : Space Rent , Refrigeration Cost, Salary
of store department Insurance Cost.
27.
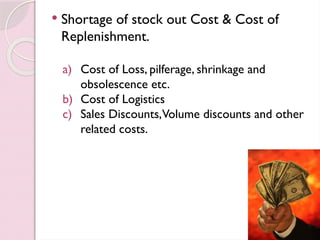
Shortage ofstock out Cost & Cost of
Replenishment.
a) Cost of Loss, pilferage, shrinkage and
obsolescence etc.
b) Cost of Logistics
c) Sales Discounts,Volume discounts and other
related costs.
28.
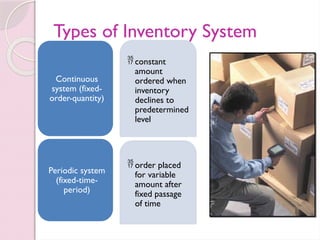
Types of InventorySystem
constant
amount
ordered when
inventory
declines to
predetermined
level
Continuous
system (fixed-
order-quantity)
order placed
for variable
amount after
fixed passage
of time
Periodic system
(fixed-time-
period)
29.
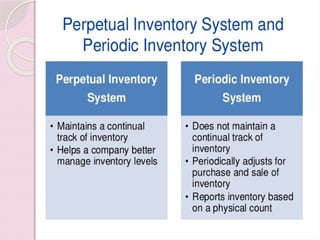
A) Periodic Inventory
System
Underthis method, the merchandise
company does not maintain a detailed
record of inventory for the result the cost
of goods sold is calculated at the end of the
accounting period (periodically).
30.
Characteristics
Easier tooperate in relatively small firms.
Lack of control over inventory.
Less cost to handle the method.
Does not keep inventory record up-to-
date.
The system applies to those concerns
usually that sell low-value items (such as
stationery items) in large quantity.
31.
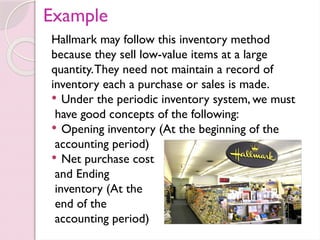
Example
Hallmark may followthis inventory method
because they sell low-value items at a large
quantity.They need not maintain a record of
inventory each a purchase or sales is made.
Under the periodic inventory system, we must
have good concepts of the following:
Opening inventory (At the beginning of the
accounting period)
Net purchase cost
and Ending
inventory (At the
end of the
accounting period)
32.
B) Perpetual Inventory
System
Under this method, a detailed record of
the cost of inventory is maintained each
time a purchase or a sale is made.
As a result, the system consciously shows
the up-to-date record of inventory that
should be on hand.The cost of goods sold
is calculated each time a purchase or a sale
is made, not at the end of an accounting
period.
33.
Characteristics
It requiresmore efforts to maintain
inventory under this method.
Close control over inventory
The method is comparatively costly
Keeps inventory record up-to-date and
decent.
The method applies to those concerns
usually that sell high-value items (Such as
car, personal computer, equipment etc.)
not at a large quantity as compared to
items under the periodic system.
34.
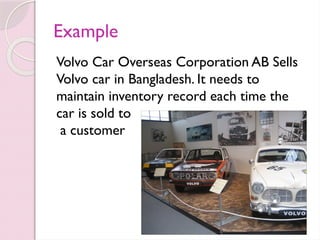
Example
Volvo Car OverseasCorporation AB Sells
Volvo car in Bangladesh. It needs to
maintain inventory record each time the
car is sold to
a customer
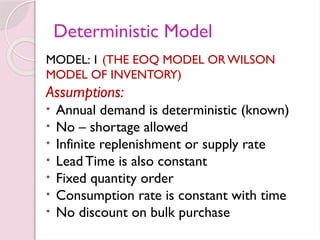
Deterministic Model
MODEL: 1(THE EOQ MODEL ORWILSON
MODEL OF INVENTORY)
Assumptions:
• Annual demand is deterministic (known)
• No – shortage allowed
• Infinite replenishment or supply rate
• Lead Time is also constant
• Fixed quantity order
• Consumption rate is constant with time
• No discount on bulk purchase
TERMS USED ININVENTORY ANALYSIS
D : Annual demand (units per year)
Co : Ordering cost (Rs./order)
Ch : inventory Carrying Costs or
holding costs(Rs./unit/unit time)
Q : Order Quantity
Q* : Economic order Quantity
N : number of orders placed per
annum
Tc : Total cost per annum
40.
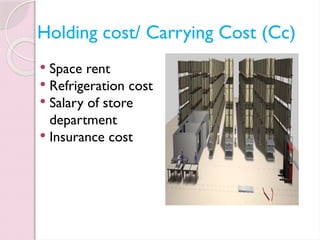
Holding cost/ CarryingCost (Cc)
Space rent
Refrigeration cost
Salary of store
department
Insurance cost
41.
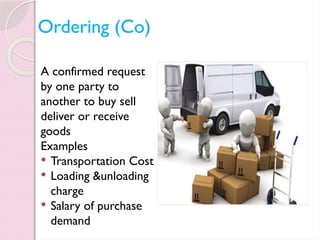
Ordering (Co)
A confirmedrequest
by one party to
another to buy sell
deliver or receive
goods
Examples
Transportation Cost
Loading &unloading
charge
Salary of purchase
demand
42.
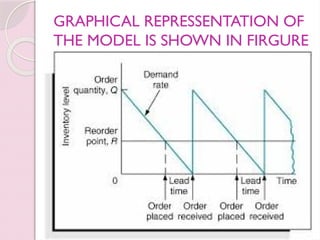
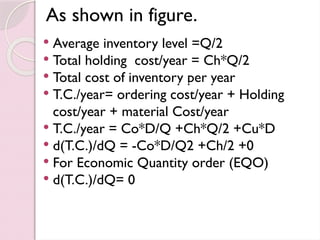
As shown infigure.
Average inventory level =Q/2
Total holding cost/year = Ch*Q/2
Total cost of inventory per year
T.C./year= ordering cost/year + Holding
cost/year + material Cost/year
T.C./year = Co*D/Q +Ch*Q/2 +Cu*D
d(T.C.)/dQ = -Co*D/Q2 +Ch/2 +0
For Economic Quantity order (EQO)
d(T.C.)/dQ= 0
43.
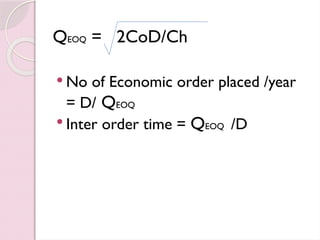
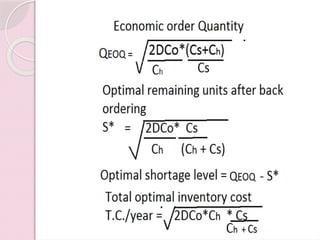
QEOQ = 2CoD/Ch
No of Economic order placed /year
= D/ QEOQ
Inter order time = QEOQ /D
44.
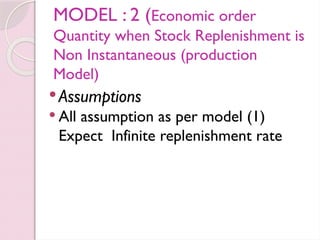
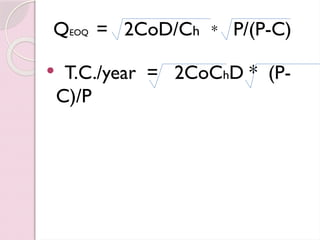
MODEL : 2(Economic order
Quantity when Stock Replenishment is
Non Instantaneous (production
Model)
Assumptions
All assumption as per model (1)
Expect Infinite replenishment rate
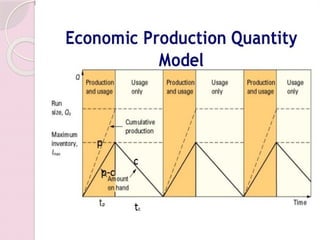
46.
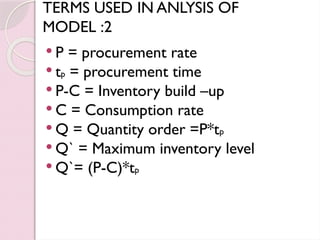
TERMS USED INANLYSIS OF
MODEL :2
P = procurement rate
tp = procurement time
P-C = Inventory build –up
C = Consumption rate
Q = Quantity order =P*tp
Q` = Maximum inventory level
Q`= (P-C)*tp
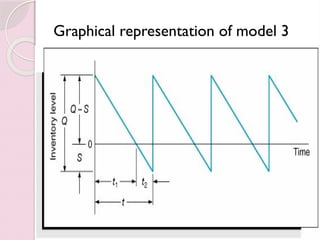
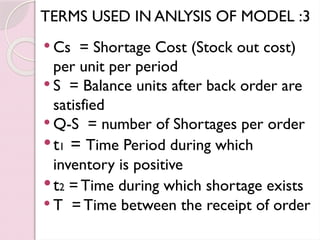
TERMS USED INANLYSIS OF MODEL :3
Cs = Shortage Cost (Stock out cost)
per unit per period
S = Balance units after back order are
satisfied
Q-S = number of Shortages per order
t1 = Time Period during which
inventory is positive
t2 = Time during which shortage exists
T = Time between the receipt of order
52.
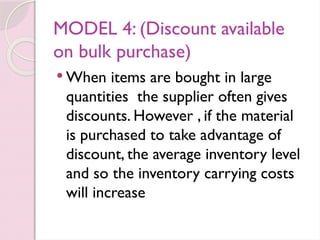
MODEL 4: (Discountavailable
on bulk purchase)
When items are bought in large
quantities the supplier often gives
discounts. However , if the material
is purchased to take advantage of
discount, the average inventory level
and so the inventory carrying costs
will increase
53.
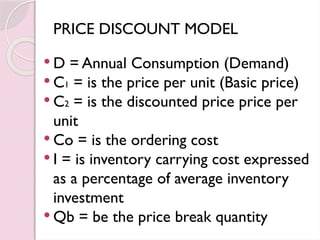
PRICE DISCOUNT MODEL
D = Annual Consumption (Demand)
C1 = is the price per unit (Basic price)
C2 = is the discounted price price per
unit
Co = is the ordering cost
I = is inventory carrying cost expressed
as a percentage of average inventory
investment
Qb = be the price break quantity
54.
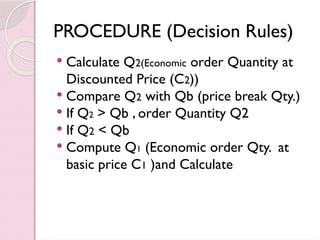
PROCEDURE (Decision Rules)
Calculate Q2(Economic order Quantity at
Discounted Price (C2))
Compare Q2 with Qb (price break Qty.)
If Q2 > Qb , order Quantity Q2
If Q2 < Qb
Compute Q1 (Economic order Qty. at
basic price C1 )and Calculate
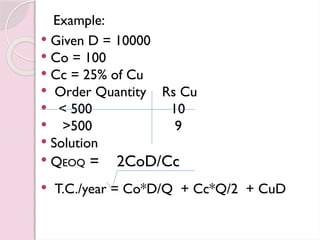
Example:
Given D= 10000
Co = 100
Cc = 25% of Cu
Order Quantity Rs Cu
< 500 10
>500 9
Solution
QEOQ = 2CoD/Cc
T.C./year = Co*D/Q + Cc*Q/2 + CuD
57.
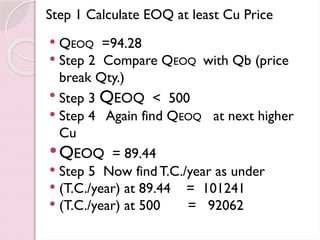
Step 1 CalculateEOQ at least Cu Price
QEOQ =94.28
Step 2 Compare QEOQ with Qb (price
break Qty.)
Step 3 QEOQ < 500
Step 4 Again find QEOQ at next higher
Cu
QEOQ = 89.44
Step 5 Now findT.C./year as under
(T.C./year) at 89.44 = 101241
(T.C./year) at 500 = 92062
58.
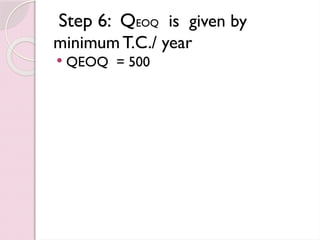
Step 6: QEOQis given by
minimum T.C./ year
QEOQ = 500
59.
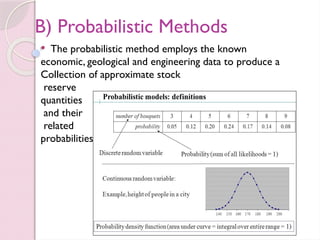
B) Probabilistic Methods
The probabilistic method employs the known
economic, geological and engineering data to produce a
Collection of approximate stock
reserve
quantities
and their
related
probabilities.
60.
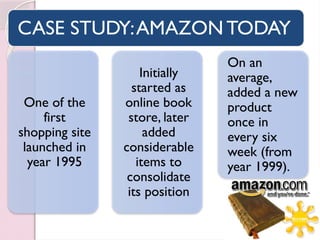
CASE STUDY:AMAZON TODAY
Oneof the
first
shopping site
launched in
year 1995
Initially
started as
online book
store, later
added
considerable
items to
consolidate
its position
On an
average,
added a new
product
once in
every six
week (from
year 1999).
61.
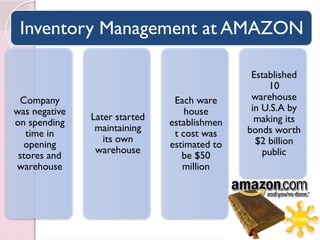
Inventory Management atAMAZON
Company
was negative
on spending
time in
opening
stores and
warehouse
Later started
maintaining
its own
warehouse
Each ware
house
establishmen
t cost was
estimated to
be $50
million
Established
10
warehouse
in U.S.A by
making its
bonds worth
$2 billion
public
62.
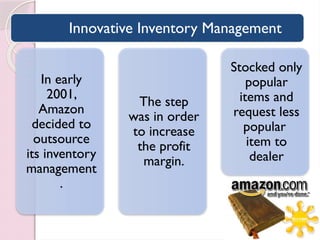
Innovative Inventory Management
Inearly
2001,
Amazon
decided to
outsource
its inventory
management
.
The step
was in order
to increase
the profit
margin.
Stocked only
popular
items and
request less
popular
item to
dealer
63.
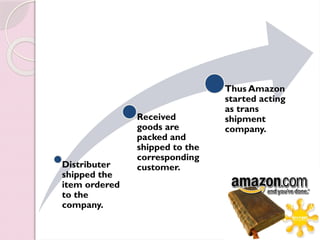
Distributer
shipped the
item ordered
tothe
company.
Received
goods are
packed and
shipped to the
corresponding
customer.
Thus Amazon
started acting
as trans
shipment
company.

![Cost Structure In Inventory
Ordering Cost.
a) cost of ordering excess.
b) cost of ordering too less.
[cost of ordering excess + cost of
ordering too less =Total stocking cost]
Example :Transportation cost ,Salary of
purchase demand ,Loading & unloading
charge etc.](https://image.slidesharecdn.com/chapter6inventorymanagement-250807144013-d3f65626/85/Chapter-6-Inventory-Management-production-management-pptx-25-320.jpg)