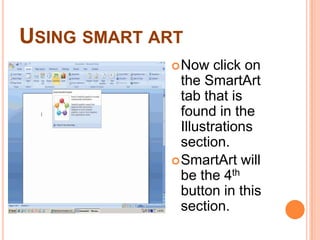
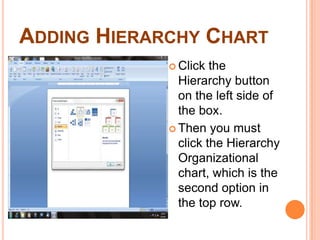
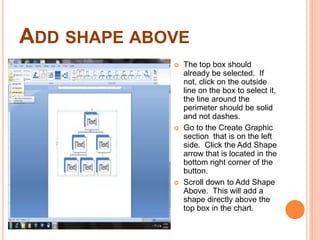
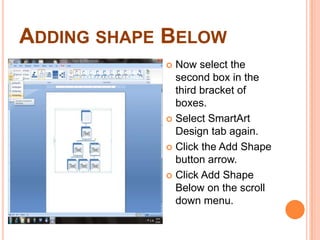
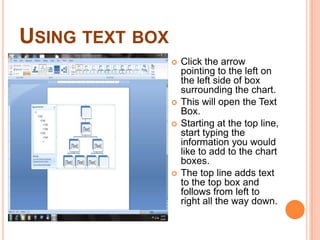
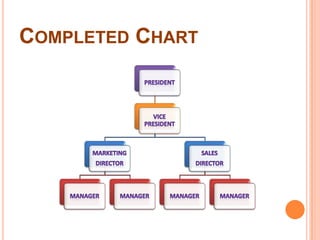
1) The document describes how to create an organizational chart using the SmartArt hierarchy tool in Microsoft Word.
2) Key steps include inserting a SmartArt hierarchy chart, adding and arranging shapes, entering text, formatting colors and styles, and changing the size and positioning of the chart.
3) Formatting options covered are fill colors, effects, and resetting the chart by removing all formatting.
This is the educational material for the Workshop2020. This PowerPoint focused Microsoft Excel I hope the students will get skill and they develop by themselves.
اكسيل كارت الاستخدام السريع لحساب الارباح و الوارد و المنصرف لاصحاب الاعمال ...Ahmed Farahat
رَبِّ اغْفِرْ لِي وَلِوَالِدَيَّ وَلِمَن دَخَلَ بَيْتِيَ مُؤْمِنًا وَلِلْمُؤْمِنِينَ وَالْمُؤْمِنَاتِ وَلَا تَزِدِ الظَّالِمِينَ إِلَّا تَبَارًا
مع تحيات م/ احمد جاد الله فرحات
العمل الحر,
الدعايه و التصميم,
فن الاعلان,
العمل من المنزل ,
Adobe Illustrator,
الدعاية و الاعلان,
الجرفيكس ,
العمل الحر,
مشاريع قوت اليوم ,
العمل من المنزل ,
ربح المال ,
العمل الحر,
التدقيق اللغوي ,
الترجمة ,
تعليم اللغات ,
كتابة المحتوي,
E-book kế toán căn bản cho người không chuyênfastcorp
E-book kế toán căn bản được Công ty phần mềm FAST đúc kết lại dành cho một số nhân sự không chuyên về kế toán. Tài liệu được viết rút gọn, dễ hiểu dành cho các cấp quản lý, nhân viên marketing, nhân viên triển khai ứng dụng phần mềm kế toán,...
(nguồn www.fast.com.vn)
Setting Line Spacing in Business MemosAt the top of a document.docxklinda1
Setting Line Spacing in Business Memos
At the top of a document after you open it move the cursor to the top left corner and open the Paragraph dialogue box to set the spacing info and tab setting as shown below before you move forward with any other part of the memo. Then, click on the “Set a Default” button. Sometimes it stays, other times it does not. If you find you need to readjust to the setting below, put the cursor anywhere in the document, highlight the whole document (I use Ctrl + A), right click on the highlighted area/document, and click on Paragraph. The box below will open up, and set info as shown below. Also works for specific document areas.
At the top of a memo, where you double space the Date, To, From, and Subject, hit the Enter key twice to achieve the double spacing. Applies to other places in the memo where you need to double space between sections.
Correct spacing.
See directions below to change the tab setting to 0.15 from the standard setting.
Setting Tab Spacing to 0.15
For tab setting, set to 0.15, and don’t use 0.5, in the “Default tab stops:” area in the upper right corner. Hit OK. Provides more finite spacing with lists, outlines, etc.
Change to this number from standard size.
Initial Formatting Memo Information
When setting up a memo, you start with single line spacing and zero, as shown above. For the Date, To, From, and Subject, you hit the Enter key twice to produce the double space required in business memo writing. You tab over to generate the straight line effect when adding information after the colon, as shown below.
Click to show paragraph marks and other hidden formatting information.
Click again to hide information.
Numbering Pages
Number your pages. Find the number feature under the Insert tab, highlighted in yellow below will be the title Page Number.
Click on the arrow in the bottom right corner to select the desired pagination option and style.
Insert tab
Borders and Shading
Borders
Left click on the mouse in a highlighted section in a table to see a column pop up, and in the middle of the pop up you will see a row labeled Borders and Shading. Left click on Borders and Shading, and the box below will pop up. You have three options: Borders, Page Borders, and Shading. You can use the mouse to select one of the other tabs, or use the keyboard: Borders (Alt + B); Page Borders (Alt + P), or Shading (Alt + S), which you will see below.
You have a selection of features: Style to select a line; Color to choose a color; Width to select how bold to make a line; and other features. Use these to enhance your tables.
Click when done to add to the table.
Borders and Shading
Page Border
To enhance the border of a table, you have selections, similar to the choices above.
Border and Shading
Shading
Use shading to highlight a table (rows or columns) to make information stick out. On the next page, you will see an example with more di.
A Skills Approach Excel 2016 Chapter 7 Exploring Advanced C.docxdaniahendric
A Skills Approach: Excel 2016 Chapter 7: Exploring Advanced Charts
and Graphics
1 | Page Skill Review 7.1 Last Updated 2/9/18
Skill Review 7.1
In this project, you will analyze U.S. population growth over the last 40 years.
Skills needed to complete this project:
• Applying Quick Styles and Other Formatting to Sparklines
• Changing the Sparkline Type
• Adding Markers to Sparklines
• Adding a Data Series to a Chart
• Creating a Combination Chart
• Formatting Other Chart Elements
• Formatting a Data Point or a Data Series
• Creating a Chart Template
• Inserting a Shape
• Applying Quick Styles and Other Formatting to Shapes
• Applying a Chart Template
• Adding and Removing Trendlines
• Forecasting Values on a Trendline
• Changing Trendline Options
1. Open the start file EX2016-SkillReview-7-1. The file will be renamed automatically to include your
name. Change the project file name if directed to do so by your instructor, and save it.
2. If the workbook opens in Protected View, click the Enable Editing button in the Message Bar at the
top of the workbook so you can modify the workbook.
3. Add Sparklines to the data and apply a Quick Style.
a. On the Population Data worksheet, select cells B4:F13.
b. On the Insert tab, in the Sparklines group, click the Column button.
c. In the Create Sparklines dialog, verify that B4:F13 is the Data Range and specify G4:G13 as the Location
Range. Click OK.
d. On the Sparkline Tools Design tab, in the Style group, apply the Dark Blue, Sparkline Style Dark #6 style.
Click the More button to expand the gallery, then click the first style from the right in the fifth row.
4. Change the Sparklines to lines with markers for all data points and highlight the high point marker in a
different color.
a. On the Sparkline Tools Design tab, in the Type group, click the Line button.
b. On the Sparkline Tools Design tab, in the Show group, click the Markers check box.
c. On the Sparkline Tools Design tab, in the Style group, click the Marker Color button, point to High
Point, and select Red (the second color from the left in the row of standard colors).
5. Create a column chart to represent the population data for Dallas and then add a second series to
represent the overall population of the United States.
a. Select cells A3:F3. Press [Ctrl] and click and drag to select cells A12:F12.
Step 1
Download
start file
A Skills Approach: Excel 2016 Chapter 7: Exploring Advanced Charts
and Graphics
2 | Page Skill Review 7.1 Last Updated 2/9/18
b. On the Insert tab, in the Charts group, click the Column or Bar Chart button, and choose Clustered
Column (the first chart type under 2‐D Column).
c. Click and drag the chart to reposition it immediately below the data.
d. On the Chart Tools Design tab, in the Data group, click the Select Data button.
e. In the Legend Entries (Series) box, click the Add button.
f. Click cell A15 to add ...
TUTorial By chad neuman in InDesign,Tutorial AT Vishal Dawdy .docxwillcoxjanay
TUTorial By chad neuman in InDesign,Tutorial AT Vishal Dawdy
Download the support files first from Mod 3 Guidelines!
Begin…
INSTRUCTIONS:
Step 1
Open InDesign and go to File>New>Document or click the Create New File icon on the welcome screen. Set the settings shown here (these are all default settings except you’ll set it to 4 pages and click “facing pages”).
Step 2
Let’s set up the master pages. That way we can add a header and page numbers automatically. Make sure your “Pages” window is open from the Window Menu. DOUBLE-Click on the A-Master icon on the top of the Pages pull-out palette to work in the master pages shown here in yellow).
Step 3
In the lower-left hand corner of the left master page, click-and-drag with the Text tool to drag out a text box for the page number.
Step 4
Go to Type>Insert Special Character> Markers>Current Page Number.
Step 5
This will insert an automated page number so you don’t have to number each page. Change the size (and style if you want) of the font to an appropriate one for your publication.
[Note: Additionally, you could also place text (like the word 'page' or '#' symbol) in front of the page number and it would be continued throughout all pages using the master page template.]
Step 6
Select the Selection tool (black arrow). Hold down Option and click-and-drag the text box that has the automatic page number in it over to the right page to create another instance of the Auto Page Number. I placed the text box on the right side page on the lower right hand corner.
Step 7
If you put the text boxes for the page numbers in the same locations as I chose to, it should look something like this.
Step 8
Page numbers are not the only objects to put onto the master pages. And all the objects don’t have to be automatically updated objects, either. You can add photos, text, or shapes and they’ll be on every page. For this tutorial, add just a simple title at the top of each page by clicking-and-dragging out a text box along the top.
Step 9
Open the Paragraph palette under Window>Type & Tables>Paragraph and click the center or justify icon to center the text after highlighting it. Up in the Control options menu, change the tracking to 600 to increase the spacing of the text to spread out the title. The Tracking setting icon is an uppercase AV with directional arrows underneath it.
Step 10
Open Adobe Illustrator, create a New Document and go to File>Place to place the japanese_flag.gif file located in the downloadable support files for this tutorial (see Module 3 on our website).
Step 11
After clicking on the placed file with a Selection tool, open the Image Trace Control palette (under Window) to view the options for live tracing. Make sure the settings are set to the ones shown here; pretty much a basic black and white trace.
Step 12 Select Trace and then Go to the OBJECT menu and Expand (object+fill) to apply the trace to the selected artwork.
Step 13 Next, Deselect the image. Then, ...
1. How to Create an Organizational chart using word smartart hierarchy Pam Despots Cheryl Norton
2. Opening the Word software Click start Click all programs Click Microsoft Office 2007 Click Microsoft Word 2007
3. Clicking Insert Tab Click the Insert tab as highlighted in the picture to the left. This tab can be found directly to the right of the Home tab.
4. Using smart art Now click on the SmartArt tab that is found in the Illustrations section. SmartArt will be the 4th button in this section.
5. Adding Hierarchy Chart Click the Hierarchy button on the left side of the box. Then you must click the Hierarchy Organizational chart, which is the second option in the top row.
6. Select the SmartArt Design Tab Make sure that the SmartArt Design is selected. This tab will be in a shade of purple and directly under SmartArt Tools in the title bar.
7. Add shape above The top box should already be selected. If not, click on the outside line on the box to select it, the line around the perimeter should be solid and not dashes. Go to the Create Graphic section that is on the left side. Click the Add Shape arrow that is located in the bottom right corner of the button. Scroll down to Add Shape Above. This will add a shape directly above the top box in the chart.
8. Adding shape Below Now select the second box in the third bracket of boxes. Select SmartArt Design tab again. Click the Add Shape button arrow. Click Add Shape Below on the scroll down menu.
9. Using text box Click the arrow pointing to the left on the left side of box surrounding the chart. This will open the Text Box. Starting at the top line, start typing the information you would like to add to the chart boxes. The top line adds text to the top box and follows from left to right all the way down.
10. Another way to add text Another way to add text is to click any where in side the box you want to add text to. The blinking text line appears and just start typing. You have to do that for every box.
11. Changing the Colors of the chart With the Design tab still selected, go to the SmartArt Styles section located directly beneath the Design tab. Click the Change Colors button arrow on the left. Scroll down to Colorful and select Colorful Range Accent Colors 5 to 6. This is the 5th option in the 2nd row.
12. Select a SmartArt Style In the SmartArt Styles section, click on the more button located on the right side of the section. Scroll down to 3D and click Inset, the second option in that row.
13. Changing the SmartArt Format Click the SmartArt Format tab that is highlighted in purple and directly underneath SmartArt Tools in the title bar.
14. Shape Fill In the Shape Styles section, click the arrow to the right of the Shape Fill button. Go to the Theme colors section. Click on Olive Green Accent 3 lighter 40%. (the third option down the Olive Green column.
15. Text Filling In the WordArt Styles box, click the arrow to the right of Text Fill. Go down to the Standard Colors section and click Purple. This will change all of the text to that shade of purple.
16. Shape Effects Go to the Shape Styles section to the left. Click the arrow to the Shape Effects button. Scroll down to Bevel (6th from the top) Select the first option in the Bevel section called Circle.
17. Changing the Chart Size Click the Size button to the far right in the Format tab. In the Height box type 4.5” In the Width box type 6.5”
18. Page Positioning Click the Arrange button on the far right side of the Format tab. Select the Position button. In the Text Wrapping section, select the top middle option called Position in Top Center with Square Text Wrapping.
19. Remove all Formatting To Remove all Formatting to the Chart you click the SmartArt Design tab. On the far right, click the Reset Graphic button. This will reset the chart and you can start with all new formatting.
21. Conclusion You always have the option of using the Word help option. Just click on the ? on the toolbar. When the box opens, type your question in the space provided. ANY QUESTIONS?