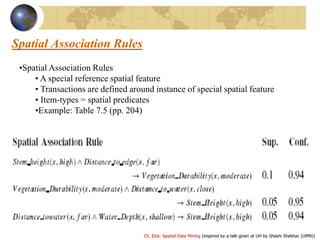
This document discusses spatial data mining and summarizes a talk on the topic. It covers characteristics of spatial data mining like autocorrelation and regional knowledge. Examples of spatial patterns are provided from historic occurrences and modern applications. Reasons for learning spatial data mining include exploring large spatial datasets and discovering new patterns. Techniques involved include clustering, associations and identifying co-locations.
![Ch. Eick: Spatial Data Mining (inspired by a talk given at UH by Shashi Shekhar (UMN))
Organization Spatial Data Mining Fall 2011
1. Introduction
2. Region Discovery—Finding Interesting Places in Spatial
Datasets
3. Project3
4. CLEVER: a Spatial Clustering Algorithm Supporting Plug-in
Fitness Functions
5. [Spatial Regression]](https://image.slidesharecdn.com/introductiontospatialdatamining-160504175717/85/Introduction-to-spatial-data-mining-1-320.jpg)
![Ch. Eick: Spatial Data Mining (inspired by a talk given at UH by Shashi Shekhar (UMN))
Organization Spatial Data Mining Fall 2011
1. Introduction
2. Region Discovery—Finding Interesting Places in Spatial
Datasets
3. Project3
4. CLEVER: a Spatial Clustering Algorithm Supporting Plug-in
Fitness Functions
5. [Spatial Regression]](https://image.slidesharecdn.com/introductiontospatialdatamining-160504175717/75/Introduction-to-spatial-data-mining-1-2048.jpg)
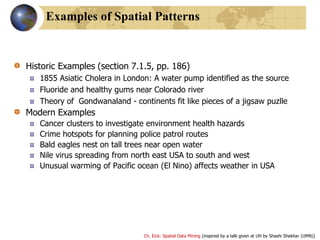
![Ch. Eick: Spatial Data Mining (inspired by a talk given at UH by Shashi Shekhar (UMN))
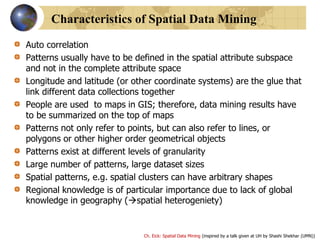
Autocorrelation
Items in a traditional data are independent of each other,
whereas properties of locations in a map are often “auto-correlated”.
First law of geography [Tobler]:
Everything is related to everything, but nearby things are more related
than distant things.
People with similar backgrounds tend to live in the same area
Economies of nearby regions tend to be similar
Changes in temperature occur gradually over space(and time)
Waldo Tobler in 2000
Papers on “Laws in Geography”: http://www.geog.ucsb.edu/~good/papers/393.pdf
http://www.cs.uh.edu/~ceick/DM/GOO10.pdf](https://image.slidesharecdn.com/introductiontospatialdatamining-160504175717/85/Introduction-to-spatial-data-mining-6-320.jpg)
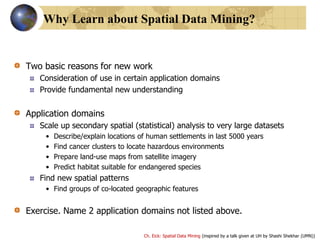
![Ch. Eick: Spatial Data Mining (inspired by a talk given at UH by Shashi Shekhar (UMN))
Why Regional Knowledge Important in Spatial Data Mining?
A special challenge in spatial data mining is that
information is usually not uniformly distributed in spatial
datasets.
It has been pointed out in the literature that “whole map
statistics are seldom useful”, that “most relationships in
spatial data sets are geographically regional, rather than
global”, and that “there is no average place on the Earth’s
surface” [Goodchild03, Openshaw99].
Therefore, it is not surprising that domain experts are
mostly interested in discovering hidden patterns at a
regional scale rather than a global scale.
Michael Frank Goodchild](https://image.slidesharecdn.com/introductiontospatialdatamining-160504175717/85/Introduction-to-spatial-data-mining-8-320.jpg)
![Ch. Eick: Spatial Data Mining (inspired by a talk given at UH by Shashi Shekhar (UMN))
Spatial Autocorrelation: Distance-based measure
K-function Definition (http://dhf.ddc.moph.go.th/abstract/s22.pdf )
Test against randomness for point pattern
• λ is intensity of event
Model departure from randomness in a wide range of scales
Inference
For Poisson complete spatial randomness (CSR): K(h) = πh2
Plot Khat(h) against h, compare to Poisson CSR
• >: cluster
• <: decluster/regularity
EhK 1
)(
[number of events within distance h of an arbitrary event]
K-Function based Spatial Autocorrelation](https://image.slidesharecdn.com/introductiontospatialdatamining-160504175717/85/Introduction-to-spatial-data-mining-9-320.jpg)
![Ch. Eick: Spatial Data Mining (inspired by a talk given at UH by Shashi Shekhar (UMN))
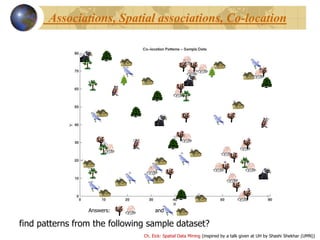
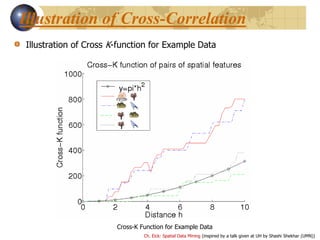
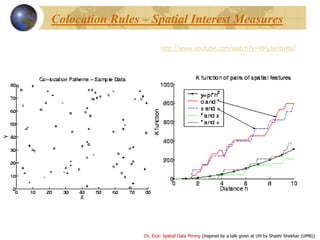
Cross-Correlation
Cross K-Function Definition
Cross K-function of some pair of spatial feature types
Example
• Which pairs are frequently co-located
• Statistical significance
EhK jji
1
)(
[number of type j event within distance h of a randomly chosen
type i event]](https://image.slidesharecdn.com/introductiontospatialdatamining-160504175717/85/Introduction-to-spatial-data-mining-13-320.jpg)
![Ch. Eick: Spatial Data Mining (inspired by a talk given at UH by Shashi Shekhar (UMN))
Participation index = min{pr(fi, c)}
Where pr(fi, c) of feature fi in co-location c = {f1, f2, …, fk}:
= fraction of instances of fi with feature {f1, …, fi-1, fi+1, …, fk} nearby
N(L) = neighborhood of location L
Pr.[ A in N(L) | B at location L ]Pr.[ A in T | B in T ]conditional probability metric
Neighborhood (N)Transaction (T)collection
events /Boolean spatial featuresitem-typesitem-types
support
discrete sets
Association rules Co-location rules
participation indexprevalence measure
continuous spaceUnderlying space
Co-location rules vs. traditional association rules](https://image.slidesharecdn.com/introductiontospatialdatamining-160504175717/85/Introduction-to-spatial-data-mining-15-320.jpg)