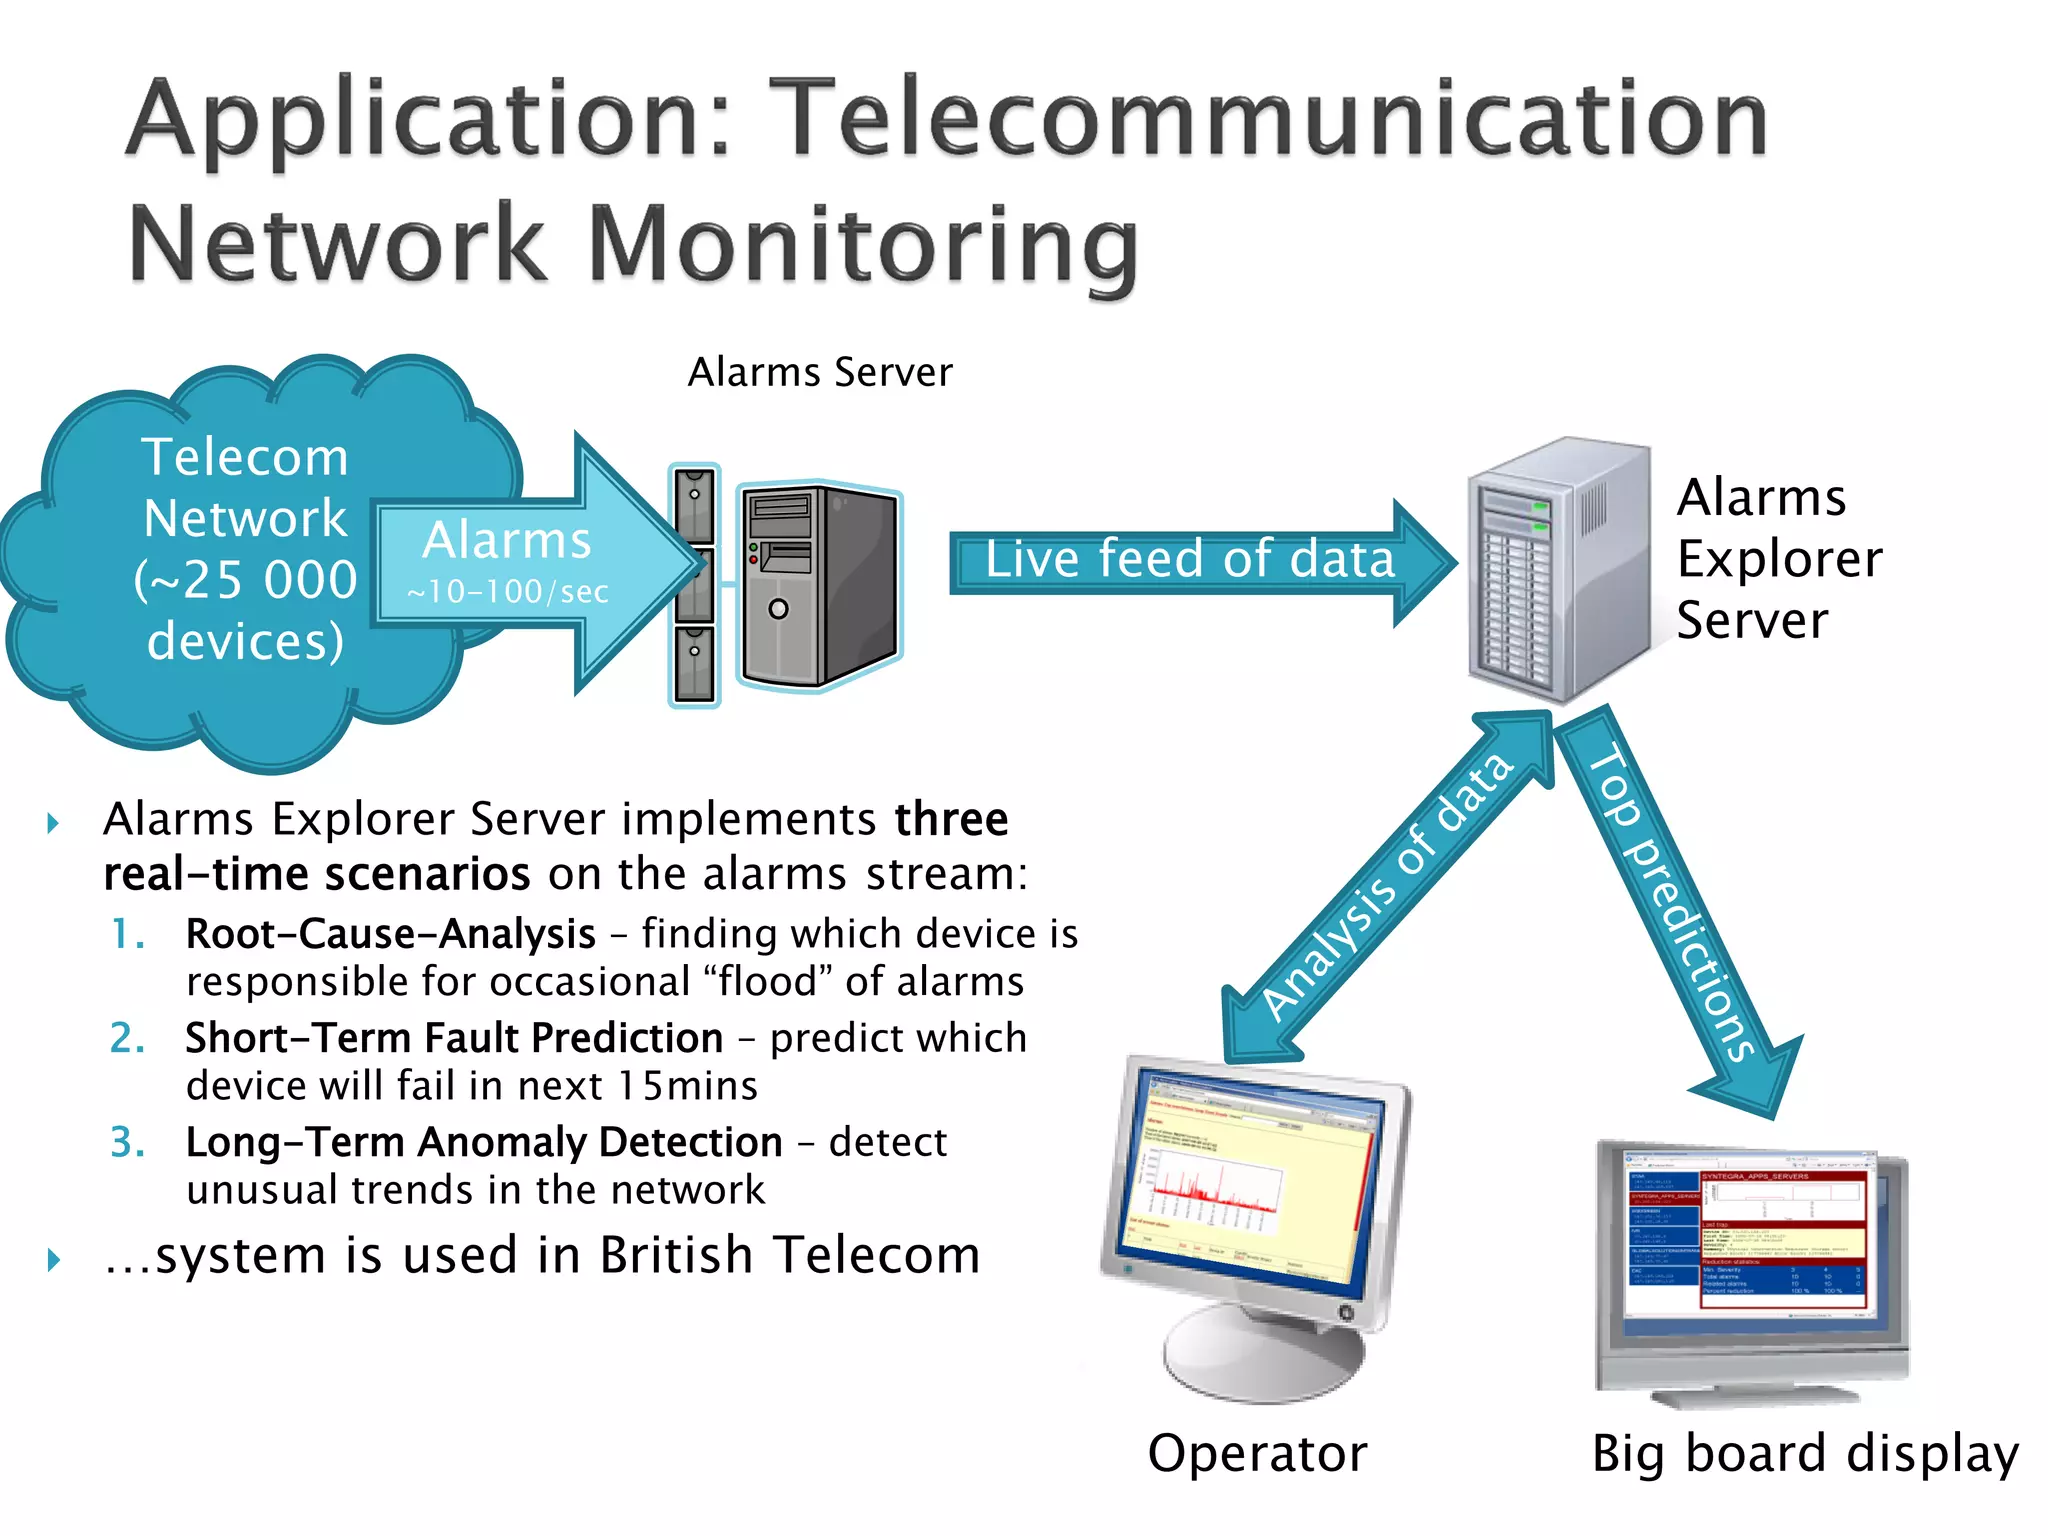
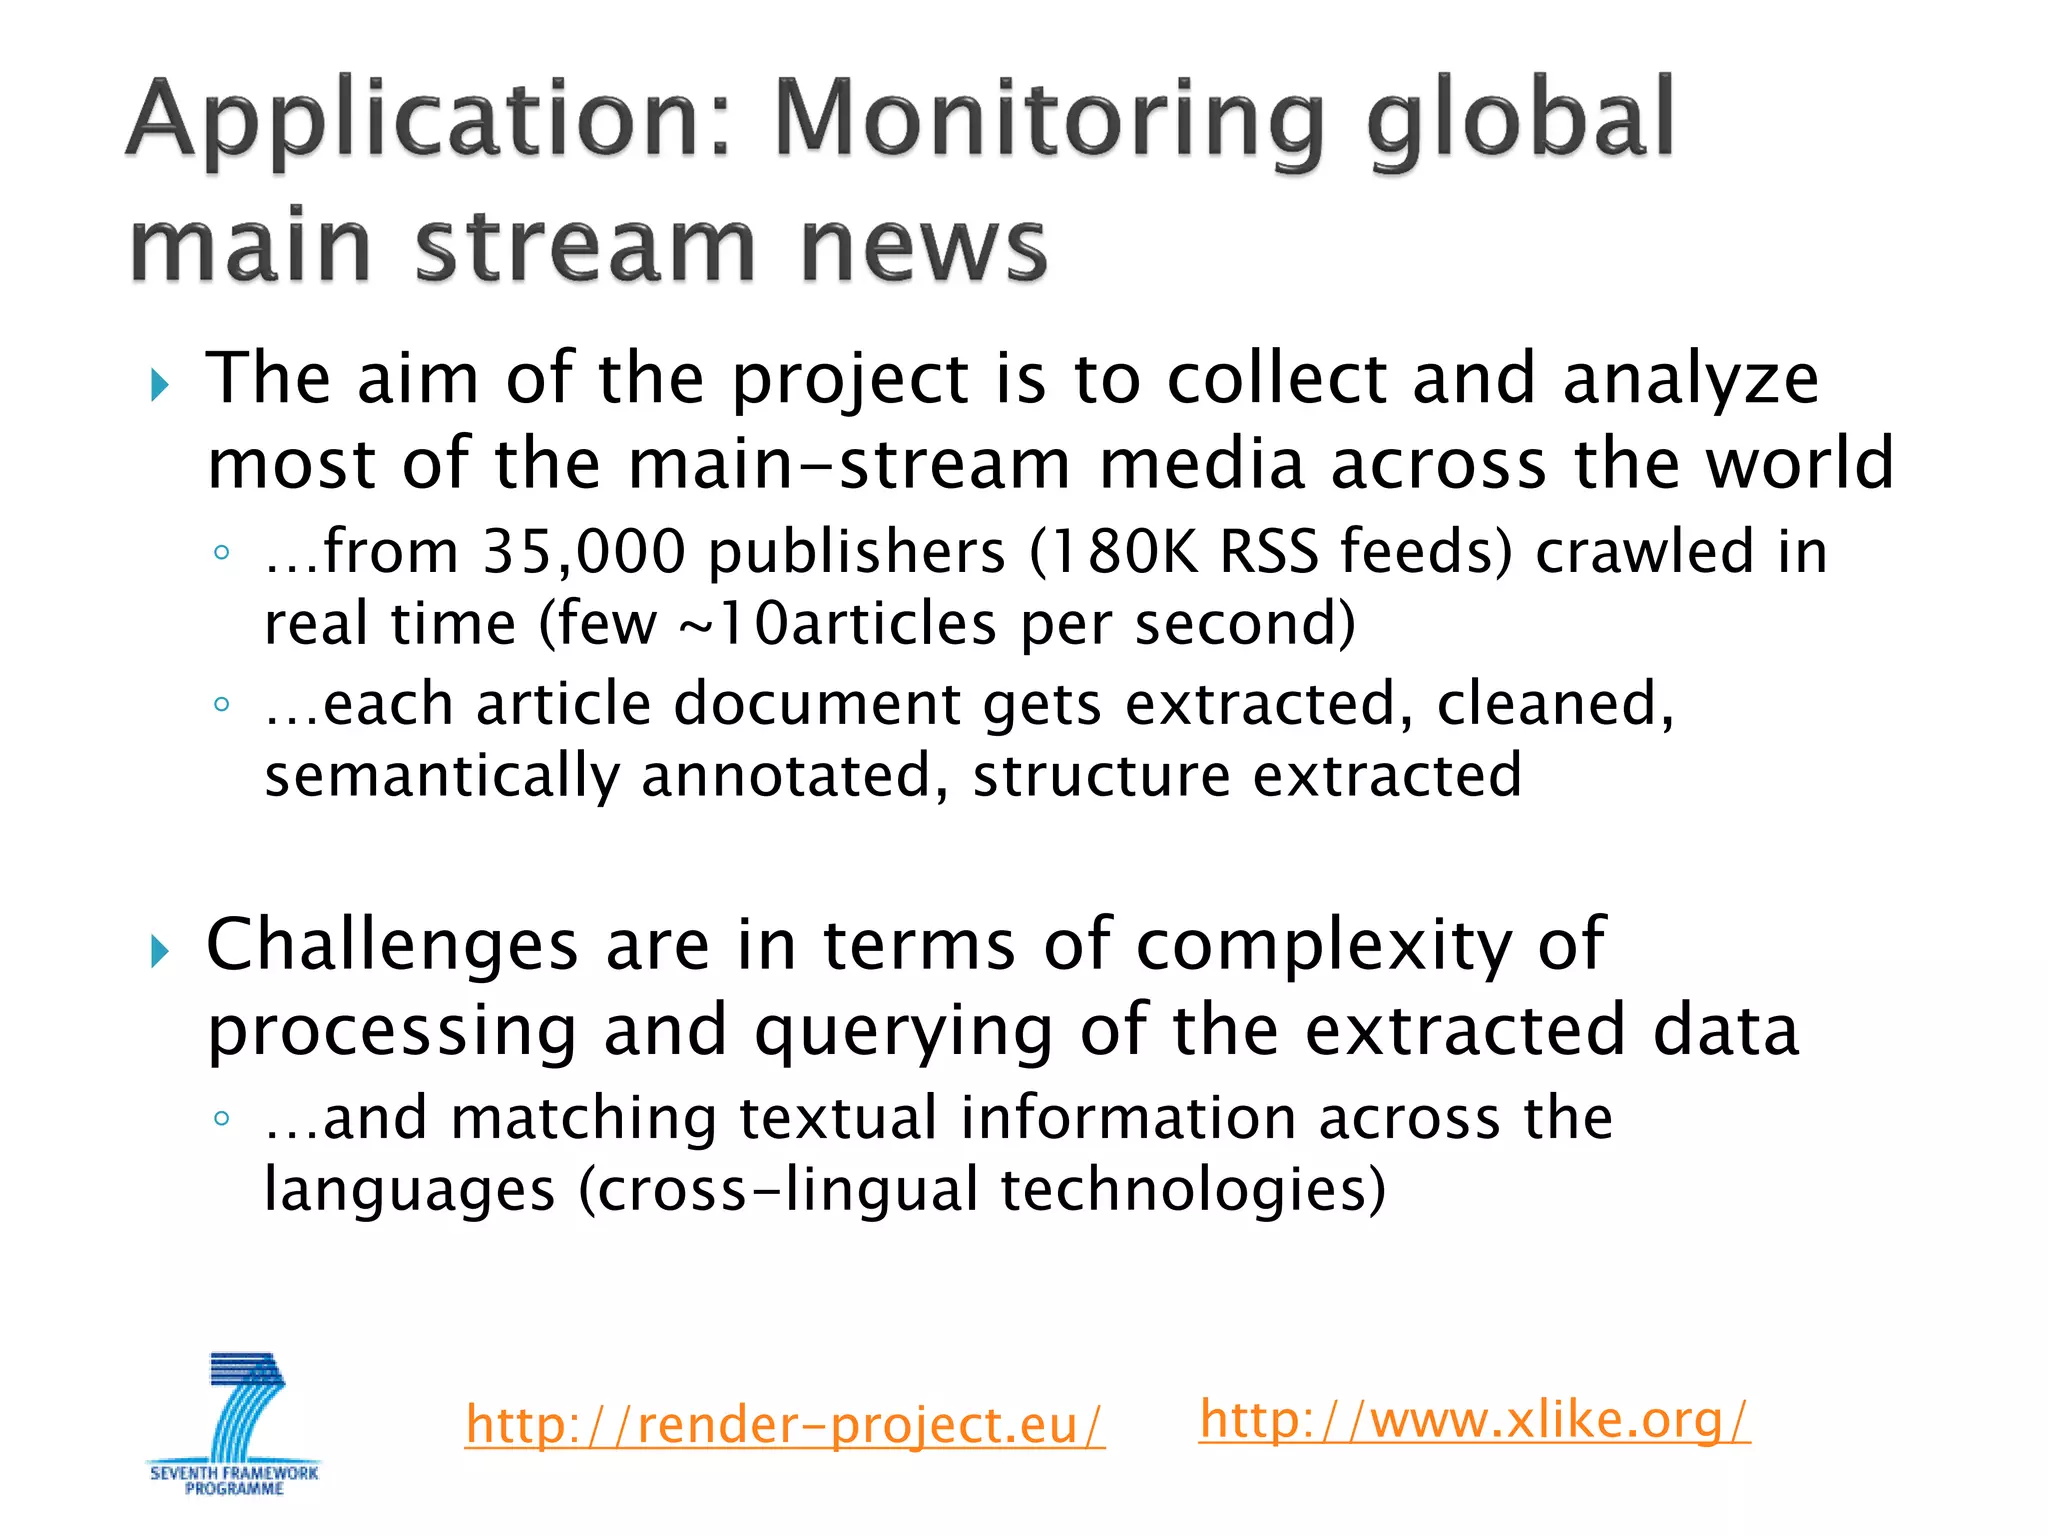
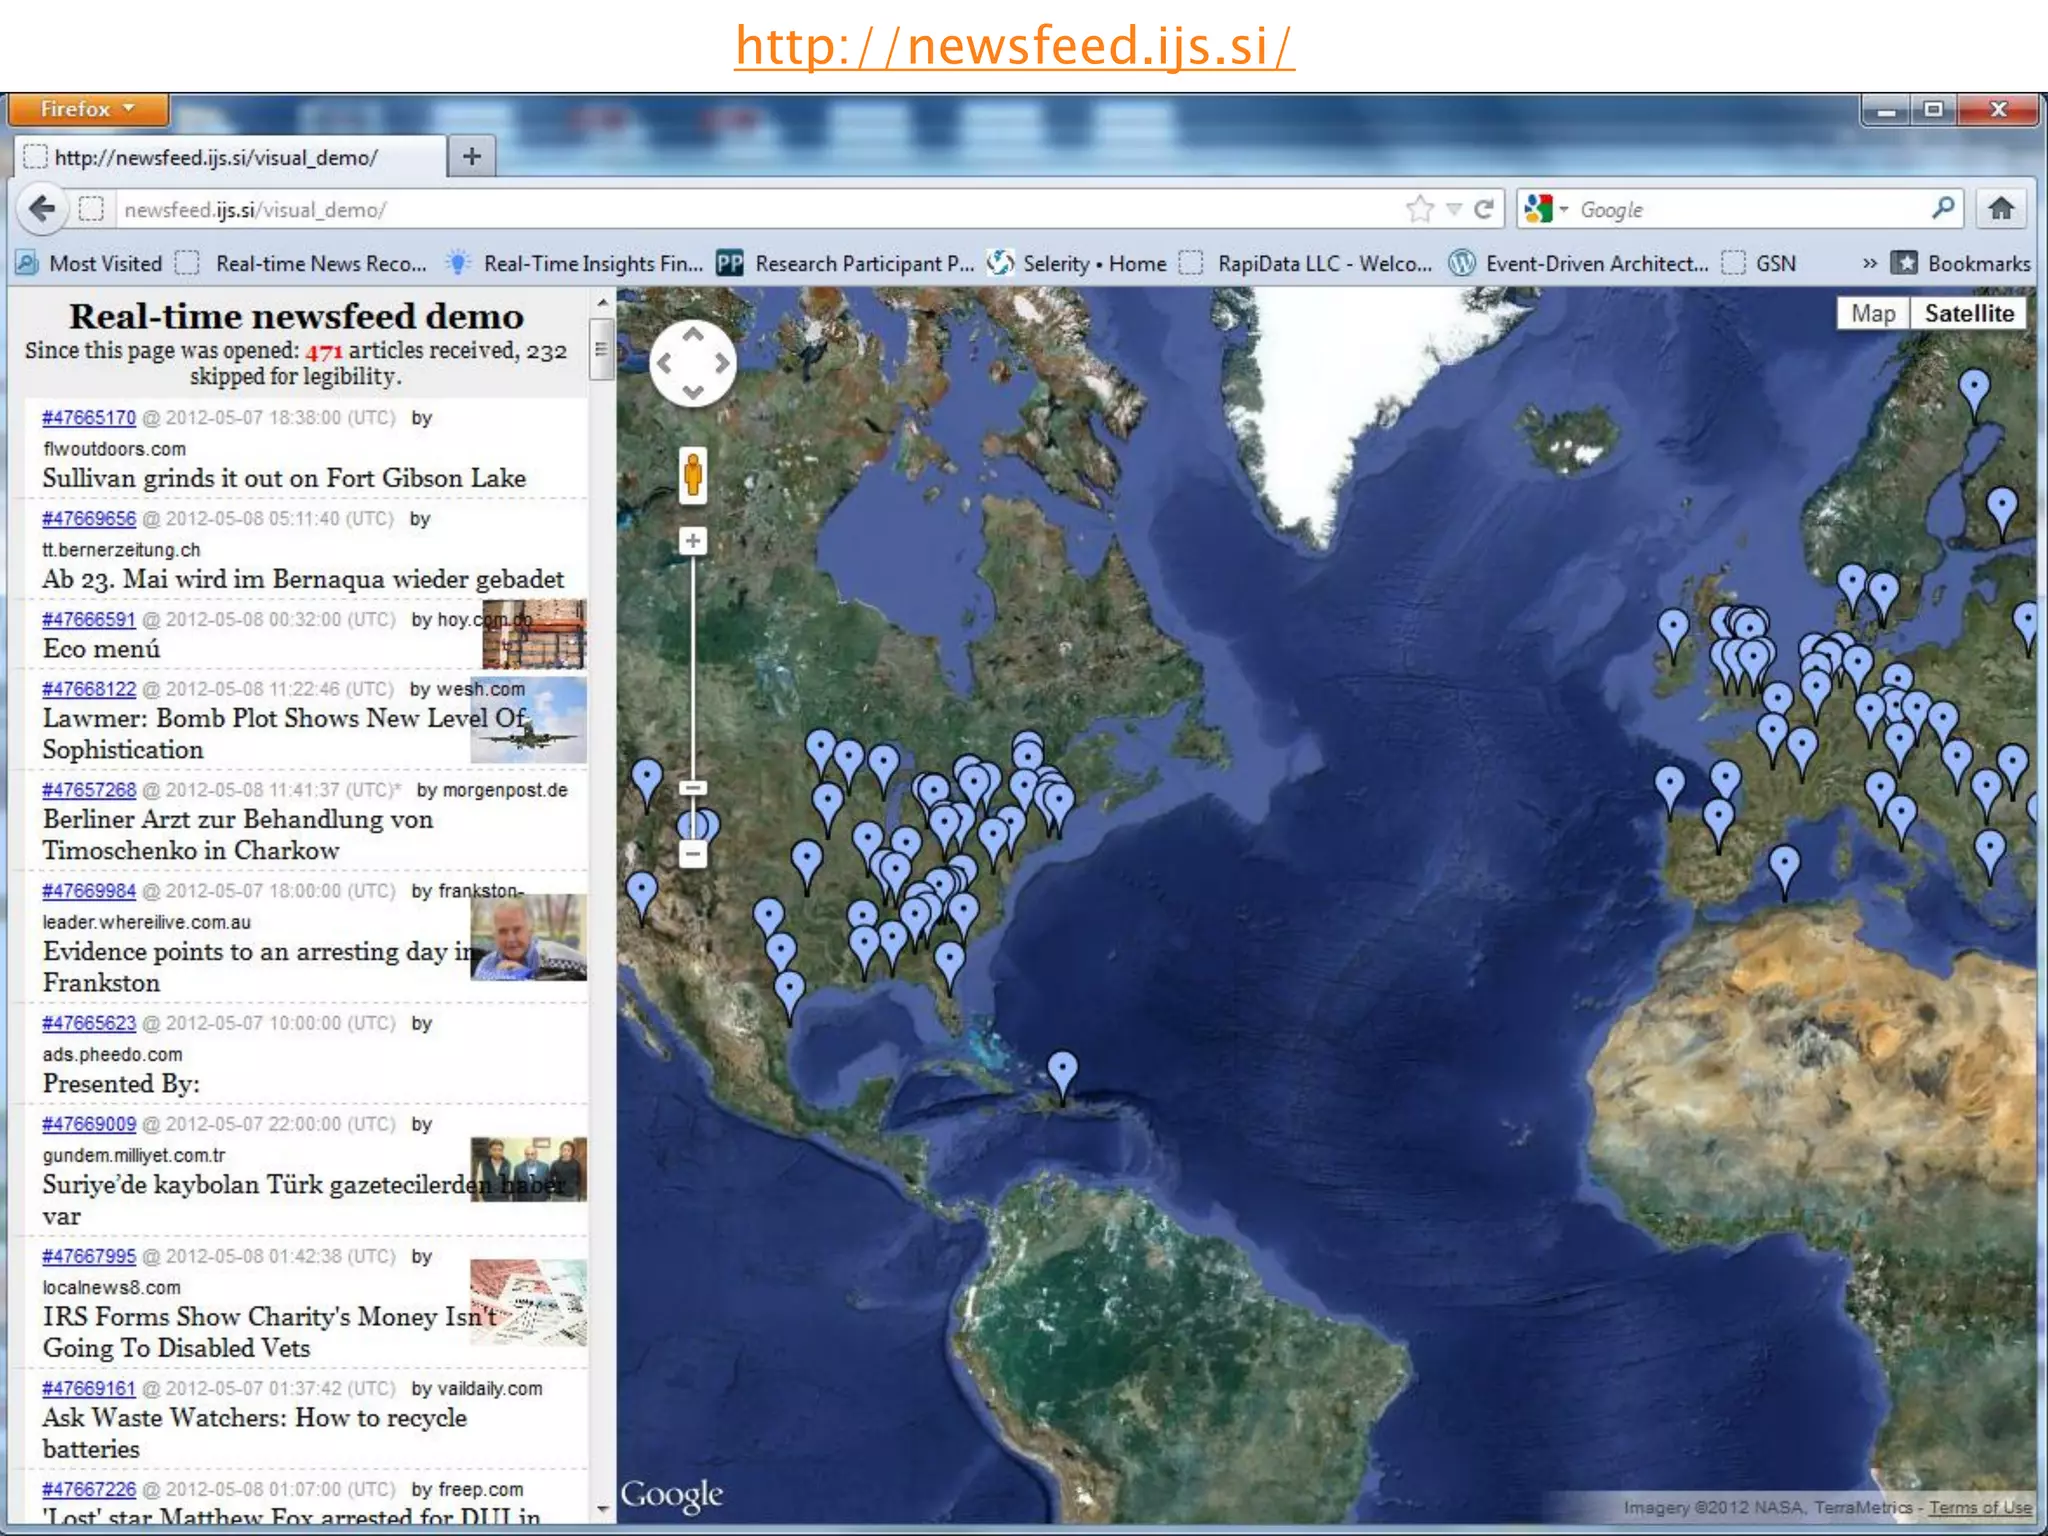
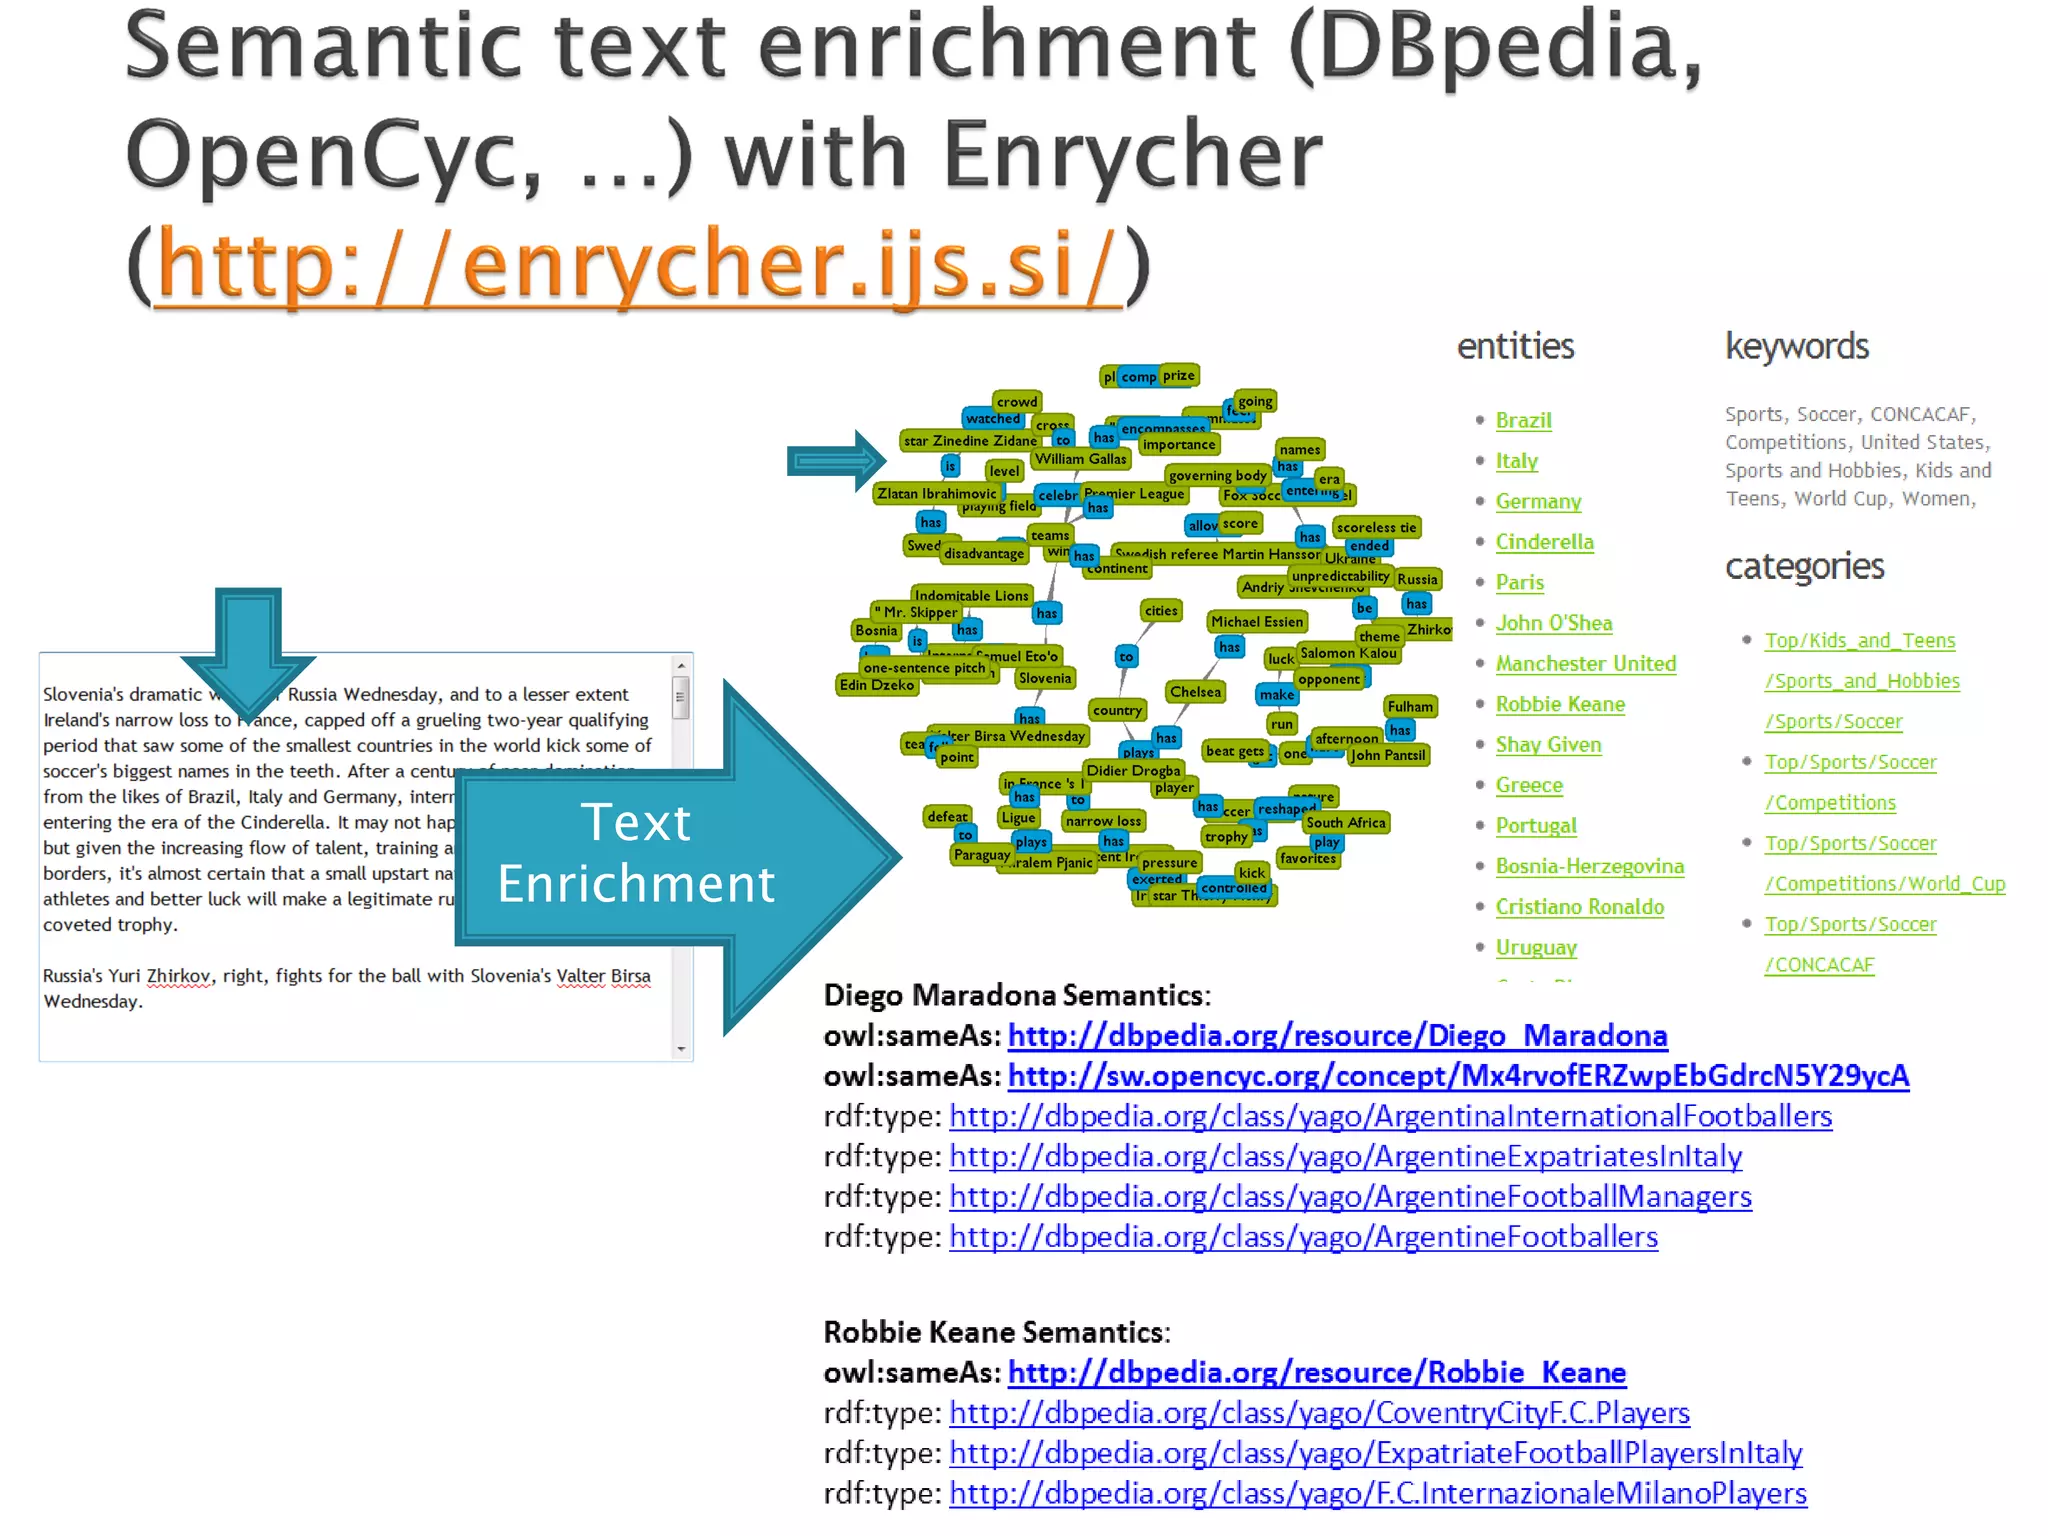
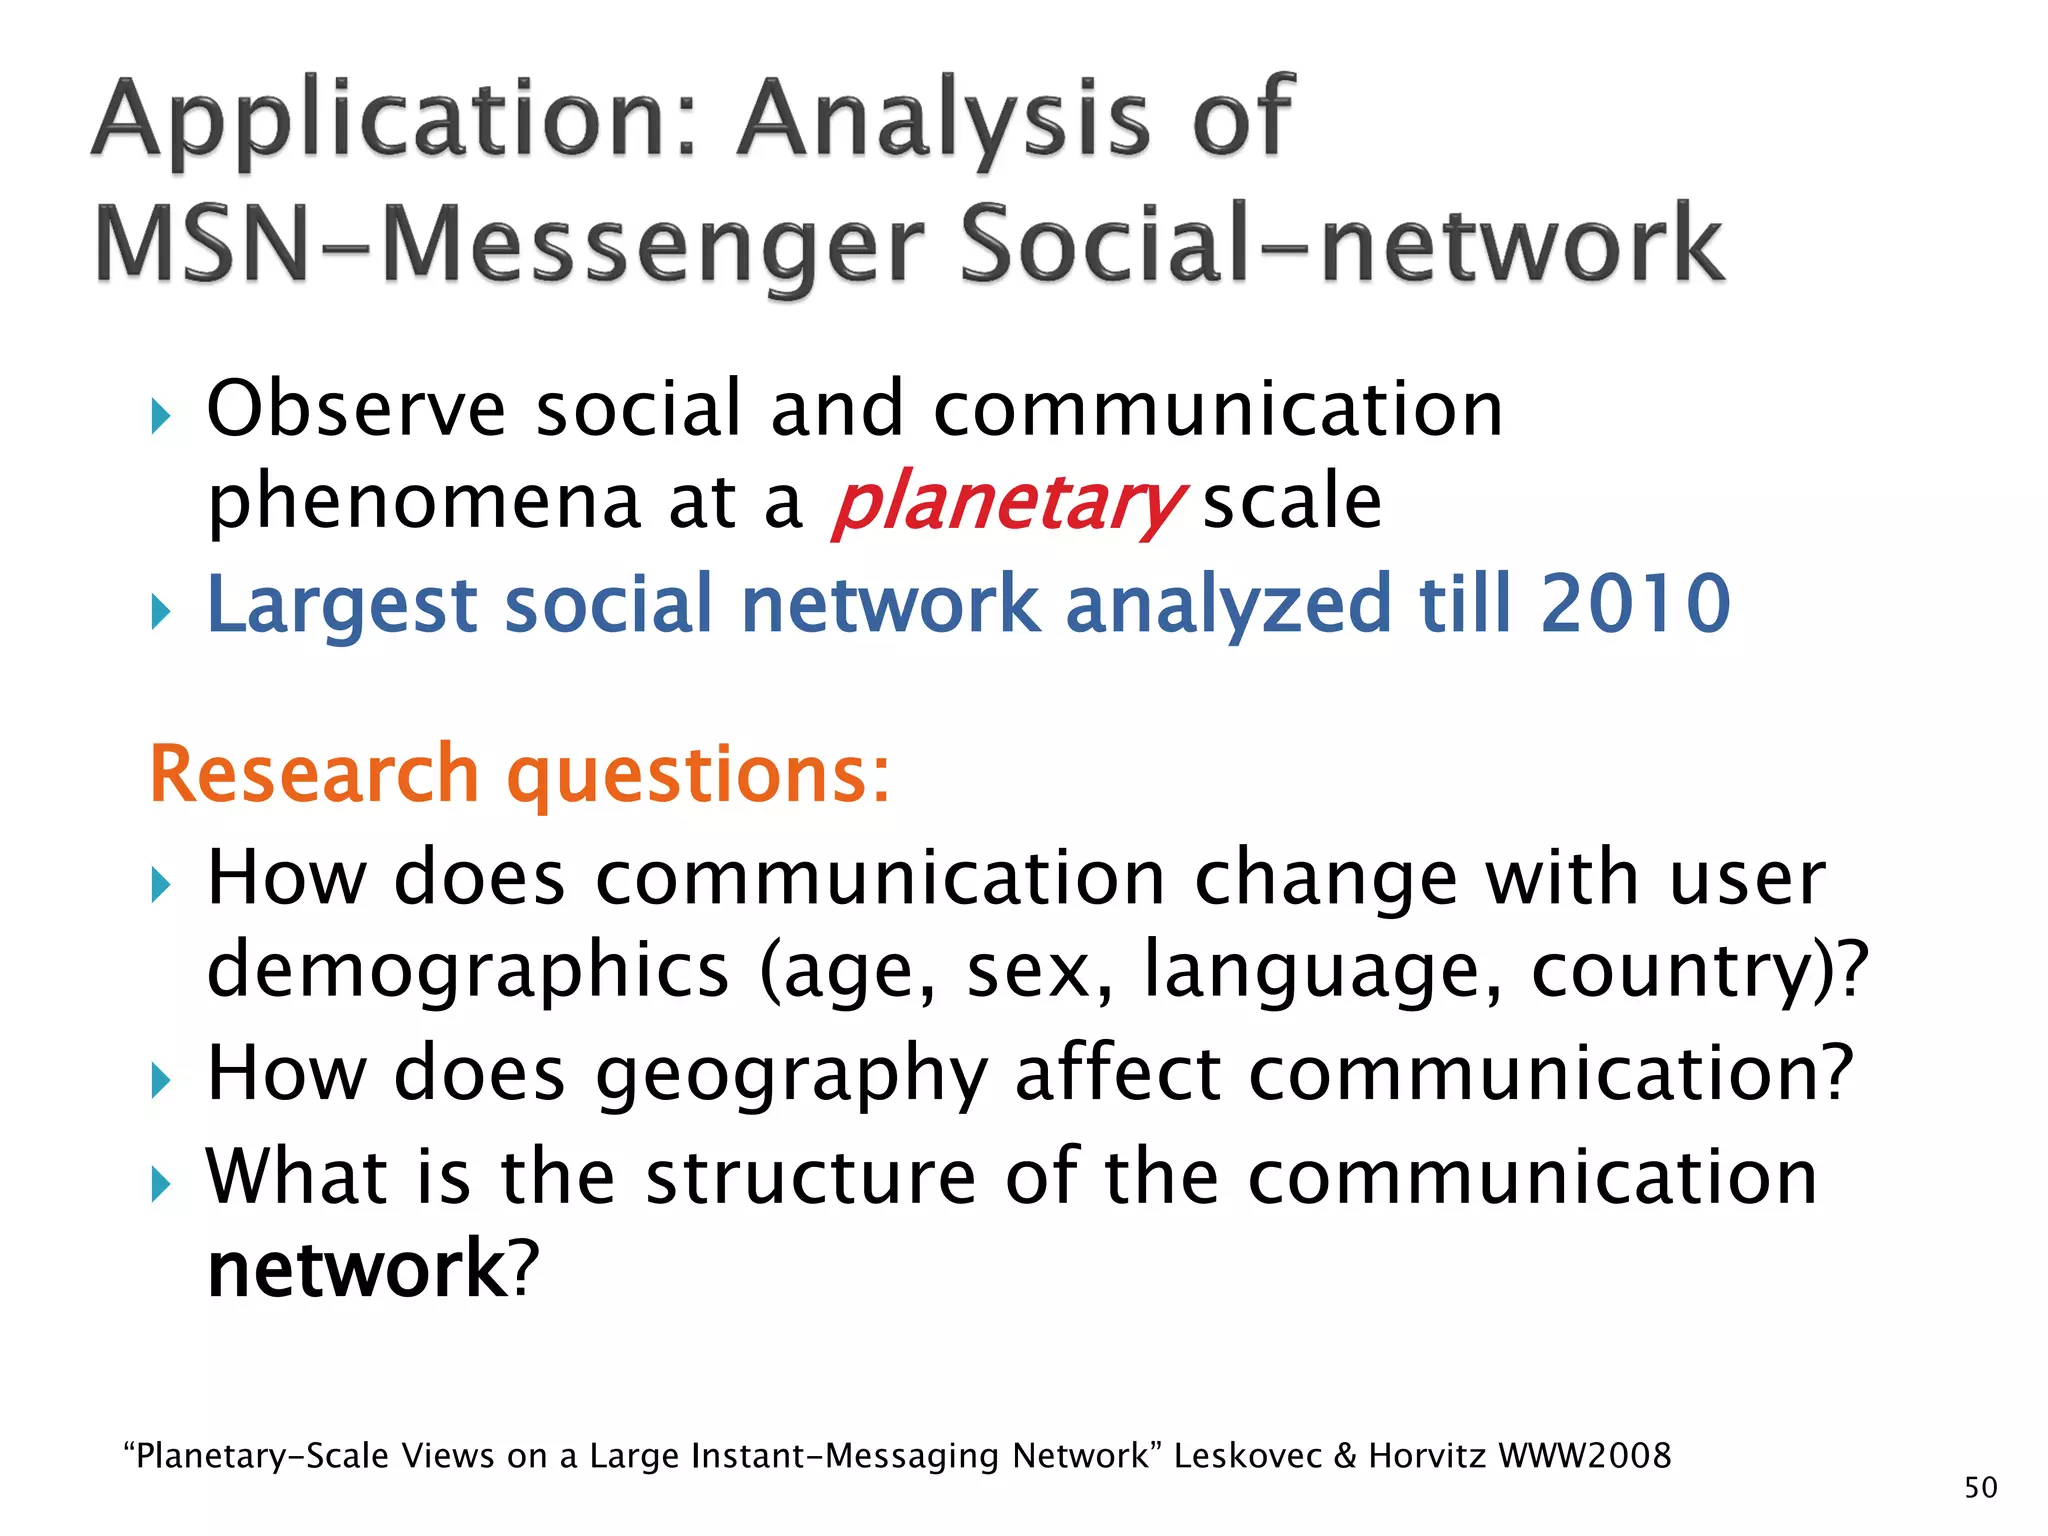
The document discusses big data techniques, tools, and applications. It describes how big data is enabled by increases in storage capacity, processing power, and data availability. It outlines common approaches to distributed processing, storage, and programming models for big data, including MapReduce, NoSQL databases, and cloud computing. It also provides examples of applications involving log file analysis, network alarm monitoring, media content analysis, and social network analysis.

![Hops
1
396
4
8648
5
3299252
6
28395849
7
79059497
8
52995778
9
10321008
10
1955007
11
518410
12
149945
13
44616
14
13740
15
4476
16
1542
17
536
18
167
19
78
3
10
2
Nodes
71
20
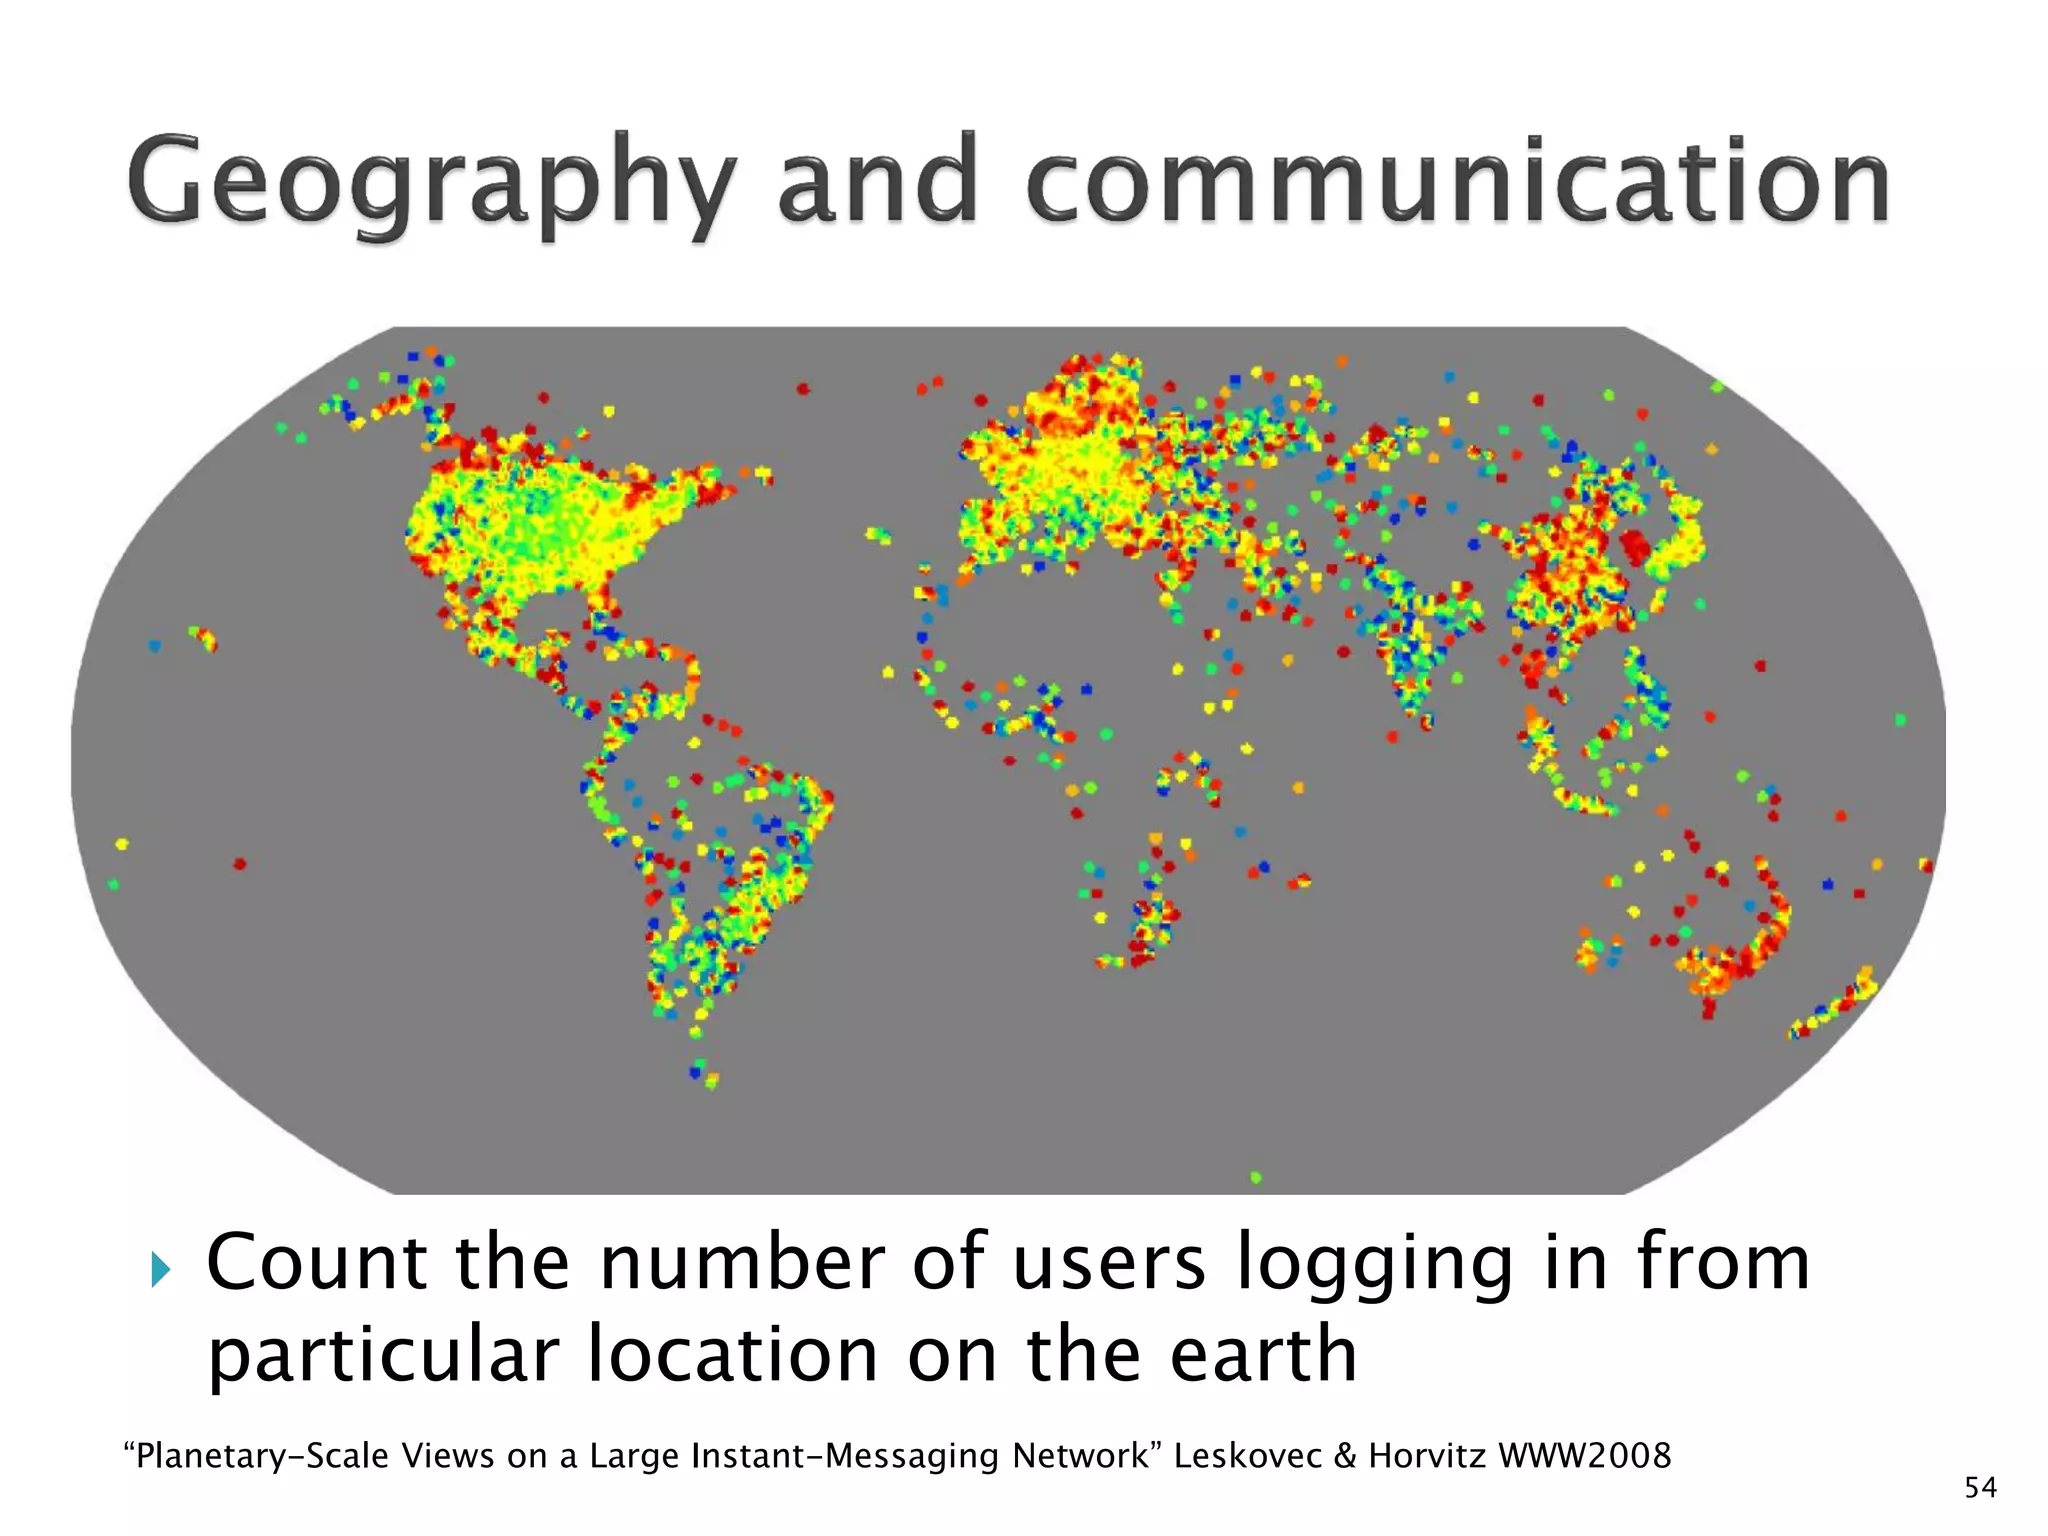
6 degrees of separation [Milgram ’60s]
21
Average distance between two random users is 6.622
23
90% of nodes can be reached in < 8 hops
29
16
10
3
24
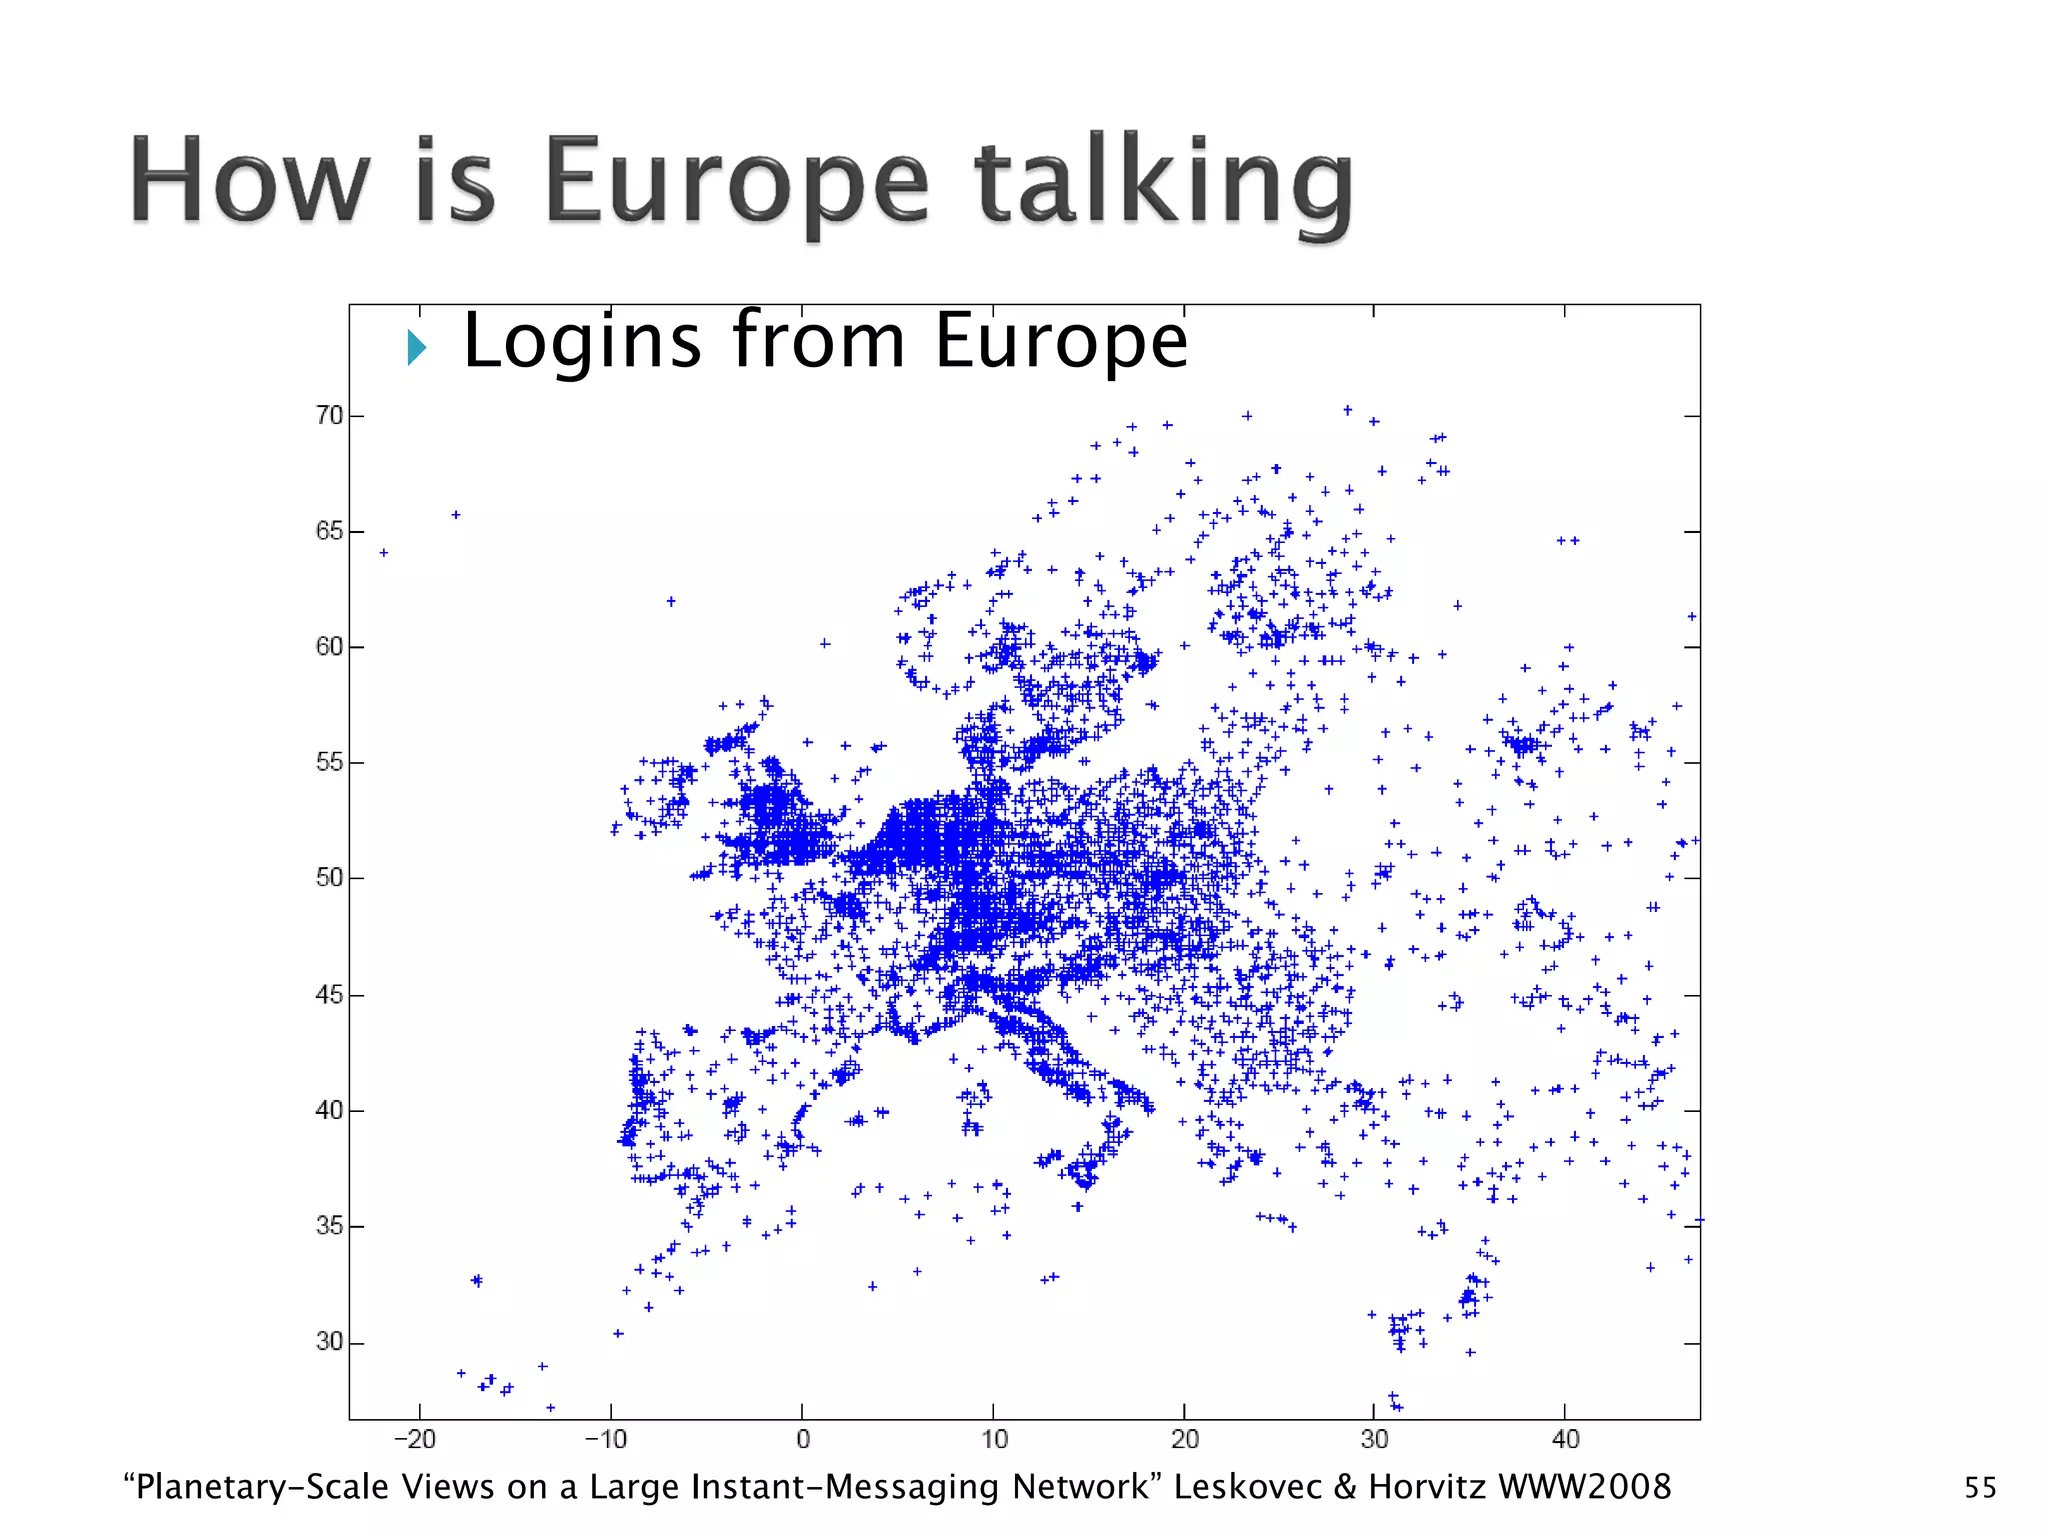
“Planetary-Scale Views on a Large Instant-Messaging Network” Leskovec & Horvitz WWW2008
2
25
3](https://image.slidesharecdn.com/keynote-bigdatatutorial-grobelnik-131210143934-phpapp02/75/ESWC-SS-2012-Friday-Keynote-Marko-Grobelnik-Big-Data-Tutorial-56-2048.jpg)


![Mapping Lo Dto Proton Revised [Compatibility Mode]](https://cdn.slidesharecdn.com/ss_thumbnails/mappinglodtoprotonrevisedcompatibilitymode-1289121936987-phpapp01-thumbnail.jpg?width=640&height=640&fit=bounds)


![Vibe Coding vs. Spec-Driven Development [Free Meetup]](https://cdn.slidesharecdn.com/ss_thumbnails/vibecodingvsspecdrivendevelopment-251209105622-43f455e7-thumbnail.jpg?width=640&height=640&fit=bounds)

![Coded Agents – with UiPath SDK + LangGraph [Virtual Hands-on Workshop]](https://cdn.slidesharecdn.com/ss_thumbnails/codedagentsdeck-251215155422-5497c599-thumbnail.jpg?width=640&height=640&fit=bounds)

