Downloaded 45 times
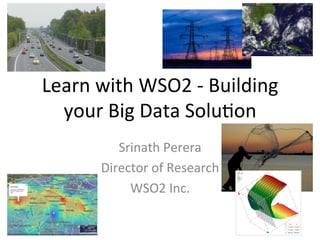

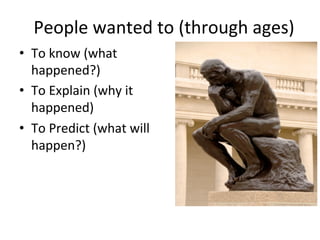
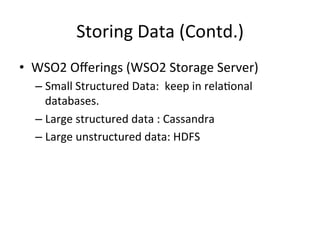
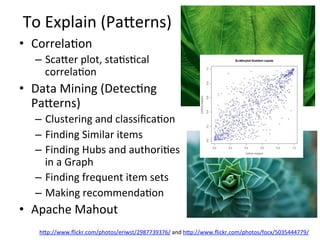
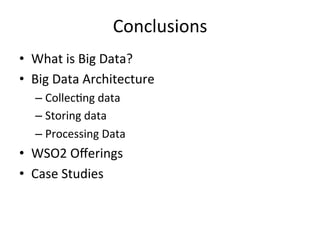
![Storing
Data
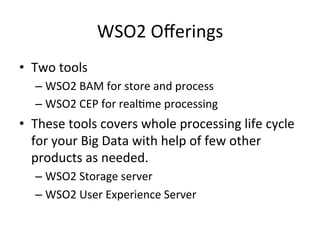
• Historically
we
used
databases
– Scale
is
a
challenge:
replica8on,
sharding
• Scalable
op8ons
– NoSQL
(Cassandra,
Hbase)
[If
data
is
structured]
• Column
families
Gaining
Ground
– Distributed
file
systems
(e.g.
HDFS)
[If
data
is
unstructured]
• New
SQL
– In
Memory
compu8ng,
VoltDB
• Specialized
data
structures
– Graph
Databases,
Data
structure
servers
hap://www.flickr.com/photos/keso/
363133967/](https://image.slidesharecdn.com/bigdata-130906000826-/85/Building-your-big-data-solution-17-320.jpg)
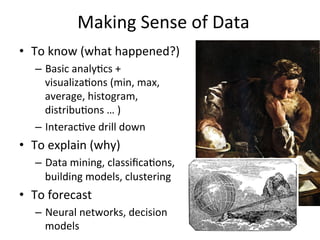
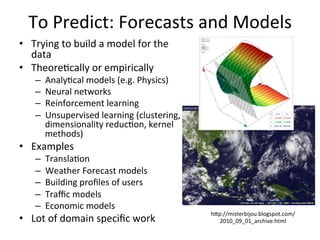
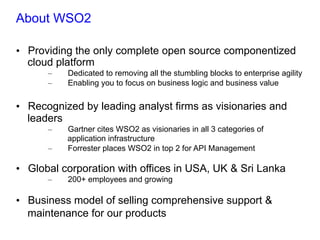
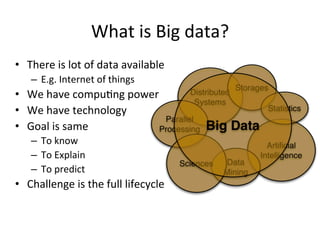
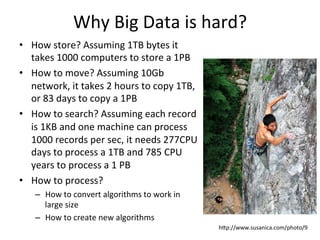
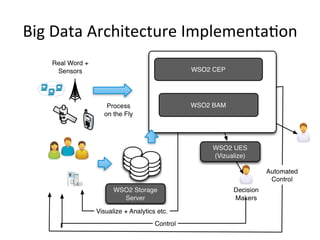
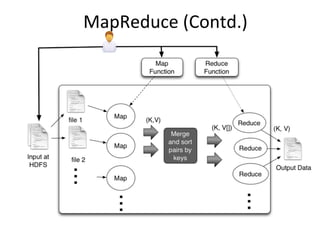
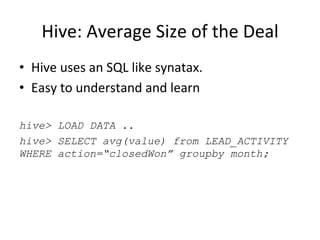
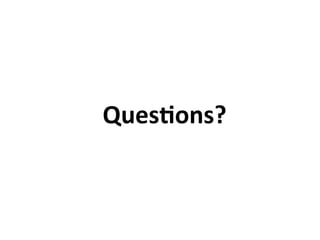
![MapReduce/
Hadoop
• First
introduced
by
Google,
and
used
as
the
processing
model
for
their
architecture
• Implemented
by
opensource
projects
like
Apache
Hadoop
and
Spark
• Users
writes
two
func8ons:
map
and
reduce
• The
framework
handles
the
details
like
distributed
processing,
fault
tolerance,
load
balancing
etc.
• Widely
used,
and
the
one
of
the
catalyst
of
Big
data
void map(ctx, k, v){
tokens = v.split();
for t in tokens
ctx.emit(t,1)
}
void reduce(ctx, k, values[]){
count = 0;
for v in values
count = count + v;
ctx.emit(k,count);
}](https://image.slidesharecdn.com/bigdata-130906000826-/85/Building-your-big-data-solution-26-320.jpg)
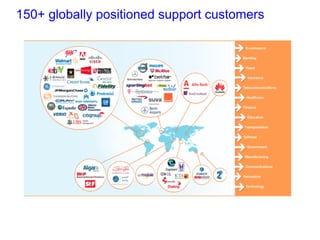
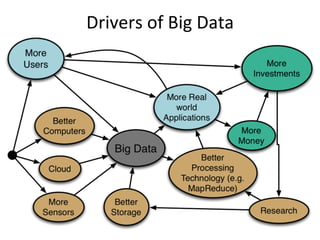
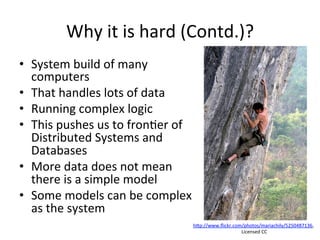
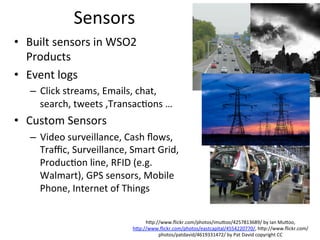
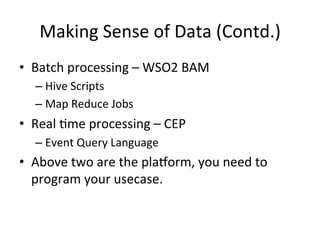
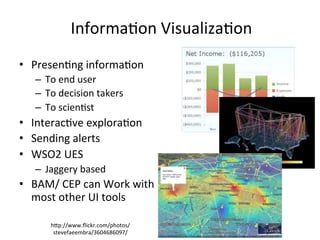
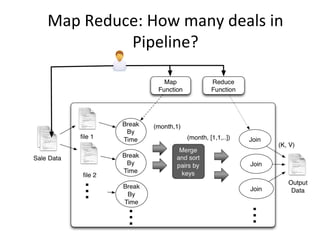
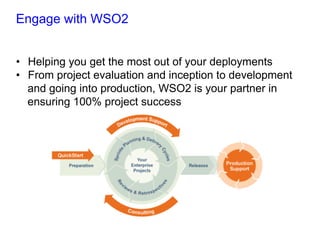
![Complex
Event
Processing
(CEP)
• Sees
inputs
as
Event
streams
and
queried
with
SQL
like
language
• Supports
Filters,
Windows,
Join,
Paaerns
and
Sequences
from p=PINChangeEvents#win.time(3600) join
t=TransactionEvents[p.custid=custid][amount>10000]
#win.time(3600)
return t.custid, t.amount;](https://image.slidesharecdn.com/bigdata-130906000826-/85/Building-your-big-data-solution-29-320.jpg)
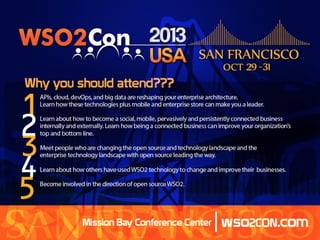
![How
many
deals
in
Pipeline?(Contd.)
void map(ctx, k, v){
Deals deal= parse(v);
int month = getMonth(deal.time);
ctx.emit(month,1)
}
void reduce(ctx, k, values[]){
count = 0;
for v in values
count = count + v;
ctx.emit(k,count);
}](https://image.slidesharecdn.com/bigdata-130906000826-/85/Building-your-big-data-solution-35-320.jpg)
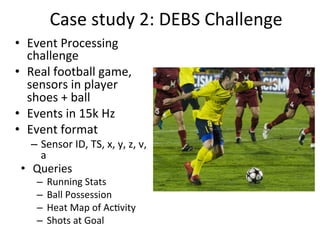
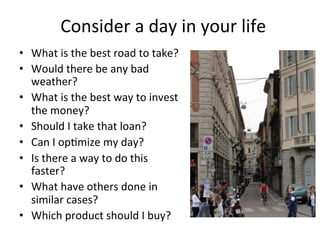
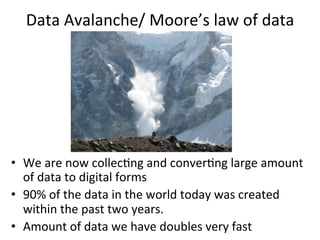
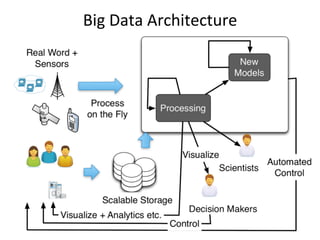
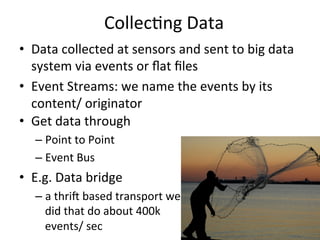
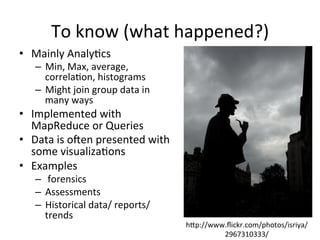
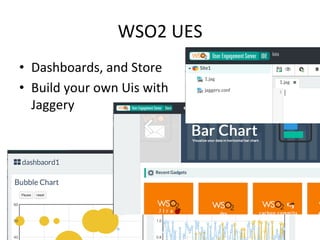
![Example:
Detect
ball
Possession
• Possession
is
8me
a
player
hit
the
ball
un8l
someone
else
hits
it
or
it
goes
out
of
the
ground
from Ball#window.length(1) as b join
Players#window.length(1) as p
unidirectional
on debs: getDistance(b.x,b.y,b.z,
p.x, p.y, p.z) < 1000
and b.a > 55
select ...
insert into hitStream
from old = hitStream ,
b = hitStream [old. pid != pid ],
n= hitStream[b.pid == pid]*,
( e1 = hitStream[b.pid != pid ]
or e2= ballLeavingHitStream)
select ...
insert into BallPossessionStream
hap://www.flickr.com/photos/glennharper/146164820/](https://image.slidesharecdn.com/bigdata-130906000826-/85/Building-your-big-data-solution-37-320.jpg)

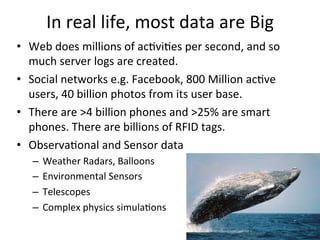
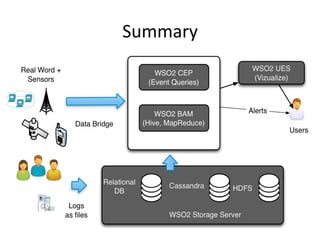
This document provides an overview of WSO2 and their offerings for building big data solutions. WSO2 provides open source components for building complete cloud platforms and is recognized as a leader in application infrastructure by Gartner and Forrester. They discuss the challenges of big data due to the large volumes and speeds at which data is generated today. WSO2's products like BAM and CEP help customers address the full data lifecycle from collection, storage, processing to analytics for big data use cases. The document outlines an example big data architecture implemented using WSO2 components along with other technologies like Cassandra.


![[Roundtable] Choreo - The AI-Native Internal Developer Platform as a Service](https://cdn.slidesharecdn.com/ss_thumbnails/choreo-deck-250328074645-511dded7-thumbnail.jpg?width=640&height=640&fit=bounds)


