Downloaded 28 times


![PaCO2
arterial carbon dioxide tension
PACO2
partial pressure of carbon dioxide in the alveoli
Palv
alveolar pressure
Pao
pressure at the mouth
PaO2
arterial oxygen tension
PAO2
partial pressure of oxygen in the alveoli
Patm
atmospheric pressure
PCO2
partial pressure of carbon dioxide
PEF
peak expiratory flow
PEmax
maximal expiratory pressure
PH2O
partial pressure of water
PImax
maximal inspiratory pressure
PO2
partial pressure of oxygen
Ppl
pleural pressure
Pst
lung static elastic recoil pressure
PTLC
lung recoil pressure at TLC
Ptr
pressure inside the trachea
P[v with bar above]O2
mixed venous oxygen tension
[Q with dot above]
perfusion
R](https://image.slidesharecdn.com/interpretationofpulmonaryfunctiontests-170711145442/85/Interpretation-of-pulmonary-function-tests-a-practical-guide-6-320.jpg)
![resistance
Raw
airway resistance
Rpulm
pulmonary resistance
RQ
respiratory quotient
RV
residual volume
SAD
small airway disease
SBDLCO
single-breath method for estimating DLCO
SBN2
single-breath nitrogen (test)
SVC
slow vital capacity
TLC
total lung capacity
V
volume
P.xiii
[V with dot above]
ventilation
VA
alveolar volume
[V with dot above]A
alveolar ventilation
VC
vital capacity
[V with dot above]CO2
carbon dioxide production
VD
dead space volume
[V with dot above]E
ventilation measured at the mouth
[V with dot above]max](https://image.slidesharecdn.com/interpretationofpulmonaryfunctiontests-170711145442/85/Interpretation-of-pulmonary-function-tests-a-practical-guide-7-320.jpg)
![maximal expiratory flow
[V with dot above]O2
oxygen consumption
[V with dot above]O2 max
maximal oxygen consumption
[V with dot above]/[Q with dot above]
ventilation-perfusion
VR
ventilatory reserve
VT
tidal volume](https://image.slidesharecdn.com/interpretationofpulmonaryfunctiontests-170711145442/85/Interpretation-of-pulmonary-function-tests-a-practical-guide-8-320.jpg)
![States have COPD. All too often the condition is not diagnosed until the disease is far advanced. In a significant
number of cases, lung disease is still not being detected. If we are to make an impact on COPD, it needs to be
detected in the early stage, at which point smoking cessation markedly reduces the likelihood of progression to
severe COPD. Figure 1-1 shows the progression of a typical case of COPD. By the time dyspnea occurs, airway
obstruction is moderately or severely advanced. Looked at differently, spirometry can detect airway
obstruction in COPD 5 to 10 years before dyspnea occurs.
Nevertheless, few primary care physicians routinely order pulmonary function tests for their patients who
smoke or for patients with mild to moderate dyspnea. For patients with dyspnea, however, in all likelihood the
blood pressure has been checked and
P.3
chest radiography and electrocardiography have been performed. Wehave seen patientswho have had coronary
angiography before simple spirometry identified the true cause of their dyspnea.
View Figure
FIG. 1-1. Typical progression of the symptoms of chronic
obstructive pulmonary disease (COPD). Only spirometry enables the
detection of COPD years before shortness of breath develops. (From
PL Enright, RE Hyatt [eds]: Office Spirometry: A Practical Guide to
the Selection and Use of Spirometers. Philadelphia: Lea & Febiger,
1987. Used with permission of Mayo Foundation for Medical
Education and Research.)
Whyare so few pulmonary function tests done? It is our impression that a great many clinicians are
uncomfortable interpreting the test results. They are not sure what the tests measure or what they mean, and,
hence, the tests are not ordered. Unfortunately, very little time is devoted to this subject in medical school
and in residency training. Furthermore, it is difficult to determine the practical clinical value of pulmonary
function tests from currently available texts of pulmonary physiology and pulmonary function testing. The 2007
Joint Commission Disease-Specific Care program for the management of COPD may prompt primary care
practitioners to adopt more sensitive and specific diagnostic methods.
The sole purpose of, and justification for, this text is to make pulmonary function tests user-friendly. The text
targets the basic clinical utility of the most common tests, which also happen to be the most important.
Interesting but more complex procedures that have a less important clinical role are left to the standard
physiologic texts.](https://image.slidesharecdn.com/interpretationofpulmonaryfunctiontests-170711145442/85/Interpretation-of-pulmonary-function-tests-a-practical-guide-10-320.jpg)
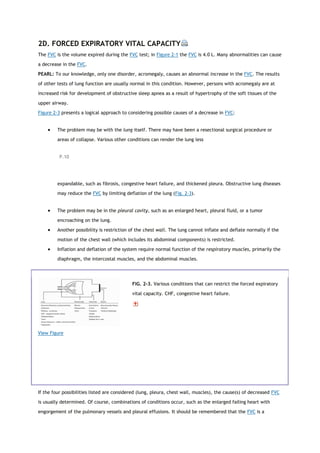
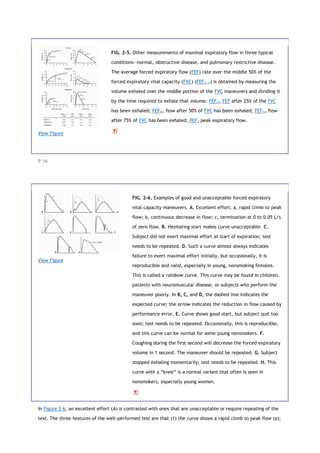
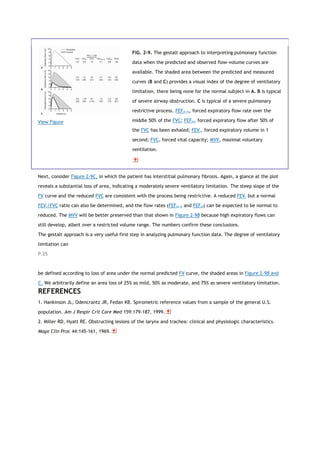
![View Figure
FIG. 2-4. Typical spirograms and flow-volume curves during forced
expiration. A and B. Normal subjects of different sizes. C. Patient with
severe airway obstruction. D. Values typical of a pulmonary restrictive
process. The arrows indicate the forced expiratory volume in 1 second
(FEV1). The ratios of FEV1 to forced expiratory vital capacity (FEV1/FVC) and
the slopes of the flow-volume curves (dashed lines) are also shown.
2F. FEV1/FVC RATIO
The FEV1/FVC ratio is generally expressed as a percentage. The amount exhaled during the first second is a
fairly constant fraction of the FVC, irrespective of lung size. In the normal adult, the ratio
P.13
ranges from 75 to 85%, but it decreases somewhat with aging. Children have high flows for their size, and thus,
their ratios are higher, up to 90%.
The significance of this ratio is twofold. First, it aids in quickly identifying persons with airway obstruction in
whom the FVC is reduced. For example, in Figure 2-4C, the FEV1/FVC is very low at 43%, indicating that the low
FVC is due to airway obstruction and not pulmonary restriction. Second, the ratio is valuable for identifying the
cause of a low FEV1. In pulmonary restriction (without any associated obstruction), the FEV1 and FVC are
decreased proportionally; hence, the ratio is in the normal range, as in the case of fibrosis in Figure 2-4D, in
which it is 87%. Indeed, in some cases of pulmonary fibrosis, the ratio may increase even more because of the
increased elastic recoil of such a lung.
Thus, in regard to the question of how to determine whether airway obstruction or a restrictive process is
causing a reduced FEV1, the answer is to check the FEV1/FVC ratio. A low FEV1 with a normal ratio usually
indicates a restrictive process, whereas a low FEV1 and a decreased ratio signify a predominantly obstructive
process.
In severe obstructive lung disease near the end of a forced expiration, the flows may be very low, barely
perceptible. Continuation of the forced expiration can be very tiring and uncomfortable. To avoid patient
fatigue, one can substitute the volume expired in 6 seconds, the FEV6, for the FVC in the ratio. Normal values
for FEV1/FEV6 were developed in the third National Health and Nutrition Examination Survey (NHANES III) [1].
PEARL: Look at the FV curve. If significant scooping or concavity can be seen, as in Figure 2-4C, obstruction is
usually present (older normal adults usually have some degree of scooping). In addition, look at the slope of
the FV curve, the average change in flow divided by the change in volume. In normal subjects, this is roughly
2.5 (2.5 L/s per liter). The normal range is approximately 2.0 to 3.0. In the case of airway obstruction (Fig. 2-](https://image.slidesharecdn.com/interpretationofpulmonaryfunctiontests-170711145442/85/Interpretation-of-pulmonary-function-tests-a-practical-guide-16-320.jpg)
![diseases (amyotrophic lateral sclerosis, myasthenia gravis, polymyositis). Thus, all these conditions need to be
considered when the MVV is reduced out of proportion to the FEV1.
2J. MAXIMAL INSPIRATORY FLOWS
With spirometer systems that measure both expiratory and inspiratory flows, the maximal inspiratory flow (MIF)
can be measured. The usual approach is shown in Figure 2-7A. The subject exhales maximally (the FVC test)
and then immediately inhales as rapidly and completely as possible, producing an inspiratory curve. The
combined expiratory and inspiratory FV curves form the FV loop. Increased airway resistance decreases both
maximal expiratory flow and MIF. However, unlike expiration, in which there is a limit to maximal flow, no
mechanism such as dynamic compression limits MIF. Thus, it is very effort-dependent.
For these reasons, measurements of MIF are not widely obtained. They add little, other than cost, to the
evaluation of most patients undergoing pulmonary function tests. The main value of testing MIF is for detecting
lesions of the major airway.
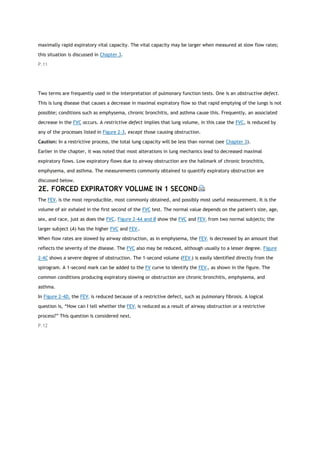
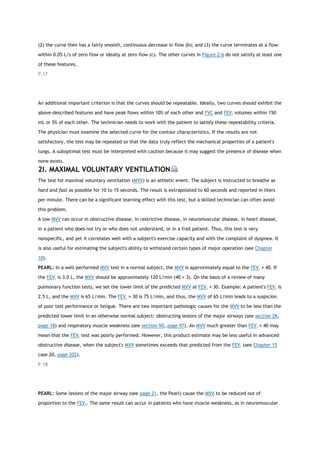
2K. OBSTRUCTING LESIONS OF THE MAJOR AIRWAY
Obstructing lesions involving the major airway (carina to oral pharynx) are relatively uncommon. When
present, however, they can often be detected by changes in the FV loop [2]. This is a very important diagnosis
to make.
The identification of these lesions from the FV loop depends on two characteristics. One is the behavior of the
lesion during rapid expiration and inspiration. Does the lesion narrow and decrease flow excessively during one
or the other phases of respiration? If it does, the lesion is categorized as variable. If the lesion is narrowed and
decreases flow equally during both phases, the lesion is categorized as fixed. The other characteristic is the
location of the lesion. Is it extrathoracic (above the thoracic outlet) or intrathoracic (to and including the
carina but generally not beyond)?
P.19
View Figure
FIG. 2-7. Comparison of typical flow-volume loops (A-C) with the
classic flow-volume loops in cases of lesions of the major airway (D-
F). FEF50, forced expiratory flow (expir flow) after 50% of the FVC
has been exhaled; FIF50, forced inspiratory flow (inspir flow)
measured at the same volume as FEF50.
Figure 2-7 illustrates typical FV loops in normal subjects (Fig. 2-7A), various disease states (Fig. 2-7B and C),
and the three classic loops caused by lesions of the major airway (Fig. 2-7D-F). The factors that determine the](https://image.slidesharecdn.com/interpretationofpulmonaryfunctiontests-170711145442/85/Interpretation-of-pulmonary-function-tests-a-practical-guide-20-320.jpg)

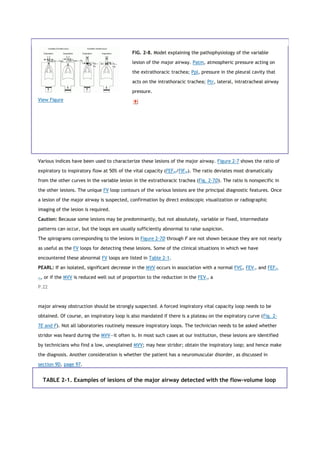

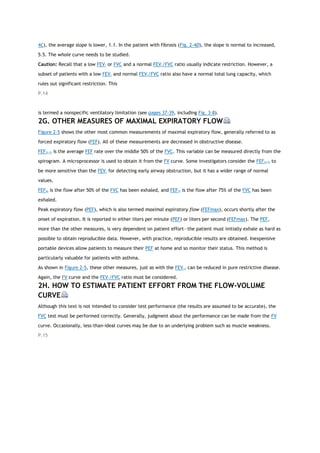
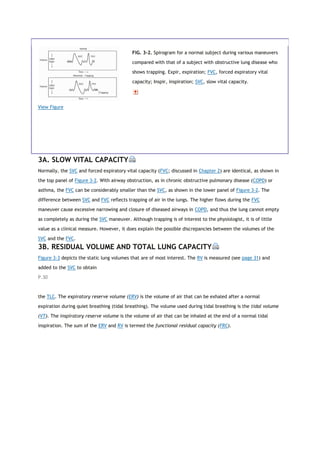
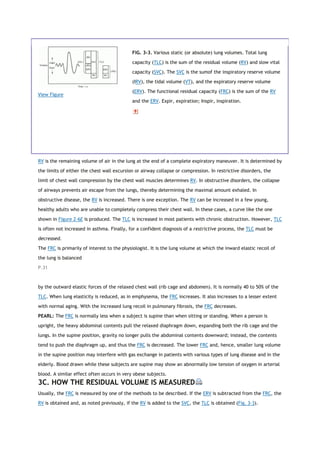
![3
Static (Absolute) Lung Volumes
Measures of the so-called static (or absolute) lung volumes are often informative [1]. The most important are
the vital capacity, residual volume, and total lung capacity. The vital capacity (VC) is measured by having the
subject inhale maximally and then exhale slowly and completely. This VC is called the slow vital capacity
(SVC). Similar to the SVC is the inspiratory vital capacity (IVC). The patient breathes normally and then exhales
slowly and completely and inhales maximally. The SVC and the IVC provide similar results. The SVC is used in
this book.
With complete exhaling, air still remains in the lung. This remaining volume is the residual volume (RV). The
RV can be visualized by comparing the inspiratory and expiratory chest radiographs (Fig. 3-1). The fact that the
lungs do not collapse completely on full expiration is important physiologically. With complete collapse,
transient hypoxemia would occur because mixed venous blood reaching the lung would have no oxygen to pick
up. Furthermore, inflation of a collapsed lung requires very high inflating pressures, which would quickly
fatigue the respiratory muscles and could tear the lung, leading to a pneumothorax. This is the problem in
infants born with respiratory distress syndrome, in which portions of the lung can collapse (individual acinar
units, up to whole lobes) at the end of exhalation.
The RV can be measured and added to the SVC to obtain the total lung capacity (TLC). Alternatively, the TLC
can be measured and the SVC subtracted from it to obtain the RV. The value of these volumes is discussed on
page 35.
P.28
View Figure
FIG. 3-1. Radiographs obtained from a healthy subject at full
inspiration (that is, at total lung capacity; A) and full expiration (B),
in which the air remaining in the lung is the residual volume.
P.29](https://image.slidesharecdn.com/interpretationofpulmonaryfunctiontests-170711145442/85/Interpretation-of-pulmonary-function-tests-a-practical-guide-27-320.jpg)
![View Figure
FIG. 3-6. The equipment and the measurements needed to measure
the functional residual capacity (FRC) by using a body
plethysmograph and applying Boyle's law (Eq 1). The subject is
seated in an airtight plethysmograph and the pressure in the
plethysmograph (Ppleth) changes with changes in lung volume.
When the subject stops breathing, alveolar pressure equals
barometric pressure (PB). Consider what happens if the valve at the
mouth is closed at the end of a quiet expiration, that is, FRC, and
the subject makes an expiratory effort. Alveolar pressure increases
by an amount (ΔP) that is measured by the mouth gauge, P. Lung
volume decreases as a result of gas compression, there being no
airflow, and hence Ppleth decreases. The change in Ppleth provides
a measure of the change in volume (ΔV), as follows. With the
subject momentarily not breathing, the piston pump is cycled and
the known volume changes produce known changes in Ppleth. These
measurements provide all the data needed to solve the above
equation for VF. The final equation is simplified by omitting ΔP from
the quantity (PB +ΔP). Because ΔP is small (˜20 cm H2O) compared
with PB (˜1,000 cm H2O), it can be neglected. PV, product of
pressure and volume.
P.35
Radiographic Method
If the above-described methods are not available, radiographic methods can provide a good estimate of TLC.
Posterior-anterior and lateral radiographs are obtained while the subject holds his or her breath at TLC. TLC is
estimated by either planimetry or the elliptic method [2]. The radiographic technique compares favorably with
the body plethysmographic method and is more accurate than the gas methods in patients with COPD. It is also
accurate in patients with pulmonary fibrosis. The technique is not difficult but requires that radiographs be
obtained at maximal inspiration.
3D. SIGNIFICANCE OF RESIDUAL VOLUME AND TOTAL LUNG CAPACITY
Knowledge of the RV and TLC can help in determining whether a restrictive or an obstructive process is the
cause of a decrease in FVC and FEV1. This distinction is not always apparent from the flow-volume (FV) curves.
The chest radiographs may help when obvious hyperinflation or fibrosis is present.
As noted in section 2F, page 12, the FEV1/FVC ratio usually provides the answer. However, in a patient with
asthma who is not wheezing and has a decreased FVC and FEV1
, both the FEV1
/FVC ratio and the slope of the FV
curve may be normal. In this case the RV should be mildly increased, but often the TLC is normal.](https://image.slidesharecdn.com/interpretationofpulmonaryfunctiontests-170711145442/85/Interpretation-of-pulmonary-function-tests-a-practical-guide-32-320.jpg)
![The FV curve in Figure 3-7C is consistent with severe ventilatory limitation due to a restrictive process. This
diagnosis requires the TLC to be decreased, and the RV/TLC ratio is expected to be essentially normal. The
values on the right of the figure confirm these expectations.
A question in regard to Figure 3-7C is, What is the cause of this restrictive process? The answer to this question
requires review of Figure 2-3 (page 10), in which all but the obstructive diseases need to be considered. Most
restrictive processes can be evaluated from the history, physical examination, and chest radiograph. In fibrosis,
diffusing capacity (discussed in Chapter 4) is expected to be reduced and radiographic changes evident. Poor
patient effort can be excluded by evaluating the FV curve (see Fig. 2-6, page 16) and by noting that the patient
gives reproducible efforts.
A curve similar to that in Figure 3-7C but with reduced peak flows is found in patients with normal lungs in
whom a neuromuscular disorder such as amyotrophic lateral sclerosis or muscular dystrophy develops. In this
case, the maximal voluntary ventilation is often reduced (see section 2I, page 17). In addition,with this
reduction in the FVC, the maximal respiratory muscle strength is reduced, as discussed in Chapter 9.
Interestingly, patients with bilateral diaphragmatic paralysis can present with this pattern. However, these
patients differ in that their dyspnea becomes extreme, and often intolerable, when they lie down.
Some massively obese subjects also show the pattern in Figure 3-7C. They have a very abnormal ratio of weight
(in kilograms) to height2
(in meters), the body mass index (BMI), which has become the standard index for
obesity. A BMI more than 25 is considered overweight. Anyone with a BMI of 30 or more is considered obese. In
our laboratory, we find that a BMI more than 35 is associated with an average reduction in FVC of 5 to 10%
(unpublished data). There is a large variation, however: Some obese individuals have normal lung volumes, and
others are more severely affected. This difference may be related to fat distribution or to the relationship
between fat mass and muscle mass [3].
Figure 3-8 shows two curves in which the FEV1 and FVC are reduced and the FEV1/FVC ratio is normal. Both are
consistent with a restrictive process. However, in both cases the TLC is normal. Therefore, the diagnosis of a
restrictive process cannot
P.38
be made. In this case, the term nonspecific ventilatory limitation is applied (see section 2F, pages 12-14).](https://image.slidesharecdn.com/interpretationofpulmonaryfunctiontests-170711145442/85/Interpretation-of-pulmonary-function-tests-a-practical-guide-34-320.jpg)
![View Figure
FIG. 3-8. A and B. Examples of nonspecific ventilatory impairment
in which the forced expiratory volume in 1 second (FEV1) and forced
expiratory vital capacity (FVC) are reduced proportionately, giving a
normal FEV1/FVC ratio, and the total lung capacity (TLC) is normal.
The numbers in parentheses are the percentage of predicted
normal. Note that residual volume (RV) is increased. This should not
be confused with the previously discussed obstructive disorders in
which RV is also increased.
Sometimes a more definitive diagnosis can be made. For example, Figure 3-8A shows a parallel shift of the FV
curve. Ventilatory limitation is mild to moderate. This finding is common in mild asthma [4]. The TLC is
normal, and the RV and RV/TLC are mildly increased. The history may be consistent with asthma with or
without wheezing. The subject often has a higher than normal increase in expiratory flows on the FV curve
after use of an inhaled bronchodilator. If this does not occur, a methacholine challenge test is often
recommended in an attempt to uncover a possible asthmatic process. These procedures are discussed in
Chapter 5.
Figure 3-8B is a nonspecific ventilatory limitation of moderate degree. In this case, the slope of the FV curve is
increased, but there is no clinical evidence of parenchymal involvement, and the pulmonary diffusing capacity
(DLCO, see Chapter 4) is normal, as is the TLC. This pattern can also occur in patients with relatively
P.39
quiescent asthma. A thorough history and physical examination may uncover the problem. The response to a
bronchodilator may be marked, or results of the methacholine challenge test may be positive.
We recently studied a random sample of 100 patients with the nonspecific ventilatory limitation pattern. All
had a TLC by plethysmography and a diffusing capacity within normal limits; thus, restriction was ruled out.
There were 62 men and 38 women 20 years or older. Airway hyperreactivity based on bronchodilator response
or methacholine challenge was present in 56. Fifty of the subjects were obese. Chronic obstructive disease was
present in 16%. Forty-one subjects had multiple tests, and 56% of these had, on one occasion, either an
obstructive pattern or a normal test result. Thus, airway hyperreactivity and obesity are commonly associated
with the nonspecific pattern, and the pattern may vacillate between normal and obstructive. If this nonspecific
pattern is found, testing for airway hyperreactivity should be done by either the bronchodilator or the
methacholine method, and occasionally both may be indicated. Normal predicted values of the FV curves are
relied on heavily. The values used in our laboratory are given in the Appendix.
Table 3-1 is an expansion of Table 2-2 (page 23): the TLC, RV, and RV/TLC ratio are added.
TABLE 3-1. Typical patterns of impairment](https://image.slidesharecdn.com/interpretationofpulmonaryfunctiontests-170711145442/85/Interpretation-of-pulmonary-function-tests-a-practical-guide-35-320.jpg)

![Several techniques for estimating DLCO have been described. The most widely used is the single-breath (SB)
method (SBDLCO). The subject exhales to residual volume and then inhales a gas mixture containing a very low
concentration of carbon monoxide plus an inert gas, usually helium. After a maximal inhalation to total lung
capacity (TLC), the patient holds his or her breath for 10 seconds and then exhales completely. A sample of
exhaled alveolar gas is collected and analyzed. By measuring the concentration of the exhaled carbon
monoxide and helium, the value of the DLCO can be computed. The helium is used to calculate TLC, and the
exhaled carbon monoxide is used to calculate the amount of carbon monoxide transferred to the blood.
The technical details of measurement of SBDLCO are complex. To improve accuracy and reproducibility of
testing among laboratories, the American Thoracic Society has established standards for performance of the
test [1,2].
P.43
4B. NORMAL VALUES OF DLCO
An average normal value is 20 to 30 mL/min per mm Hg; that is, 20 to 30 mL carbon monoxide is transferred
per minute per mm Hg difference in the driving pressure of carbon monoxide. The normal values depend on age
(decrease with aging), sex (slightly lower in females), and size (taller people have larger lungs and therefore a
higher DLCO). The inclusion of helium provides an estimate of total alveolar volume (VA). Dividing DLCO by VA
tends to normalize for difference in size and therefore the DLCO/VA ratio (or Krogh constant) tends to be the
same in various-sized normal subjects. To an extent in a given subject, the DLCO is also directly related to the
volume of the inhaled breath. The smaller the volume, the lower the DLCO. The DLCO/VA in this situation
would change little, however, if at all. This fact is useful, especially when repeated tests are obtained over
time. The volume inhaled might vary from year to year, but the DLCO/VA tends to correct for this. Most
patients can hold their breath for 10 seconds, but some subjects with very small vital capacities cannot inhale
a sufficient quantity of the gas mixture to give a valid test.
PEARL: In the healthy subject, the VA is essentially the same as the TLC and can be used as an estimate of
TLC. The VA is also a good estimate of TLC in most restrictive conditions. With obstructive disease, VA
underestimates TLC, just as the nitrogen washout and inert gas dilution techniques do (see section 3C, page
31). However, TLC obtained with plethysmography minus the VA provides an estimate of the severity of
nonuniform gas distribution, that is, the volume of poorly ventilated lung (see Chapter 3, first Pearl, page 40).
4C. CAUSES OF INCREASED DLCO
Usually, an increased DLCO is not a concern. However, there are some interesting causes of an increased DLCO,
as follows:
Supine position: Rarely is the DLCO measured while the subject is supine, but this position produces a
higher value because of increased perfusion and blood volume of the upper lobes.
Exercise: It is difficult to hold one's breath for 10 seconds during exercise. When this is done just after
exercise,
P.44](https://image.slidesharecdn.com/interpretationofpulmonaryfunctiontests-170711145442/85/Interpretation-of-pulmonary-function-tests-a-practical-guide-39-320.jpg)


![ Alveolar proteinosis: Alveoli are filled with a phospholipidrich material.
Miscellaneous Causes
The high carbon monoxide tension in the blood of a heavy smoker can decrease the ΔPCO or driving
pressure. This lowers the DLCO (Eq. 1).
Pregnancy usually reduces the DLCO by approximately 15%, but the mechanism is not fully understood.
With an isolated, unexplained reduction in DLCO (with normal results on spirometry and normal lung
volumes), pulmonary vascular disease, such as primary pulmonary hypertension, recurrent pulmonary
emboli, or obliterative
P.47
vasculopathy, should be considered. A recent study in which computed tomography was used to
evaluate an isolated reduction in DLCO found mild emphysema or mild fibrosis to explain most of the
cases [3].
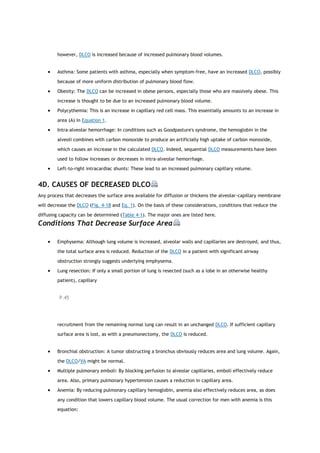
View Figure
FIG. 4-2. Case of severe restrictive disease. Total lung capacity
(TLC) is markedly reduced, the ratio of forced expiratory volume in
1 second to forced vital capacity (FEV1/FVC) is normal, the carbon
monoxide diffusing capacity of the lung (DLCO) is reduced, and the
oxygen saturation (SaO2) is decreased with exercise. The maximal
voluntary ventilation (MVV) is not as severely reduced as the FEV1;
thus, the calculation of FEV1 × 40 does not work in this situation.
The steep slope of the flow-volume (FV) curve and the reduced
DLCO suggest a pulmonary parenchymal cause of the severe
restriction. The diagnosis in this case was idiopathic pulmonary
fibrosis. Numbers in parentheses are percent of predicted, except
for slope FV curve, in which numbers are a range.
Figures 4-2 through 4-4 present cases in which knowledge of the DLCO is very useful.
4E. OTHER CONSIDERATIONS
The test for DLCO is very sensitive. We have found transient decreases of 3 to 5 mL/min per mm Hg with mild
respiratory infections in healthy subjects. It is a useful test for following the course of patients with idiopathic
pulmonary fibrosis or sarcoidosis and for monitoring the toxicity of chemotherapy or for evaluating therapeutic
interventions. The test has also been used to follow the extent of intra-alveolar hemorrhage in conditions such
as Goodpasture's syndrome.
P.48](https://image.slidesharecdn.com/interpretationofpulmonaryfunctiontests-170711145442/85/Interpretation-of-pulmonary-function-tests-a-practical-guide-43-320.jpg)

![5
Bronchodilators and Bronchial Challenge Testing
When a patient undergoes pulmonary function tests for the first time, it is almost always worthwhile to have
spirometry performed before and after the administration of an inhaled bronchodilator.
5A. REASONS FOR BRONCHODILATOR TESTING
Administering a β2 agonist is rarely contraindicated. Ipratropium bromide can be used if the β2 agonist is
contraindicated. The major values of bronchodilator testing are as follows:
If the patient shows a positive response (see section 5C below), one is inclined to treat more
aggressively with bronchodilators and possibly with inhaled corticosteroids. The improvement can be
shown to the patient, and compliance is thus often improved. However, even if no measurable
improvement occurs, a therapeutic trial (2 weeks) of an inhaled bronchodilator in patients with
obstructive disease may provide symptomatic and objective improvement.
Patients with chronic obstructive pulmonary disease (COPD) who acutely show a heightened response
to a bronchodilator have been found to have an accelerated decrease in pulmonary function over
time. In such cases, aggressive therapy of the COPD seems warranted.
PEARL: Some pulmonologists believe that a positive response to a bronchodilator in COPD warrants a
trial of
P.52
inhaled corticosteroid therapy. However, bronchodilator response does not predict response to inhaled
corticosteroid. Inhaled corticosteroid therapy is indicated for patients with moderate to severe COPD
(forced expiratory volume in 1 second [FEV1] <80% predicted) with frequent (more than once a year) or
recent exacerbations. This therapy reduces the frequency of exacerbations and improves symptoms
and quality of life [1,2].
Possibly the most important result is the detection of unsuspected asthma in a person with low-normal
results on spirometry.
5B. ADMINISTRATION OF BRONCHODILATOR
The agent can be administered either by a nebulizer unit or by use of a metered-dose inhaler. The technique
for the inhaler is described in Figure 5-1.](https://image.slidesharecdn.com/interpretationofpulmonaryfunctiontests-170711145442/85/Interpretation-of-pulmonary-function-tests-a-practical-guide-46-320.jpg)
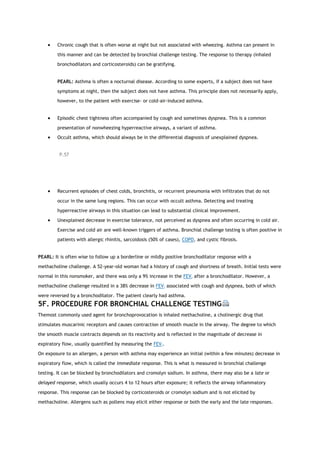
![than the maximal effort. This result could be interpreted as a significant bronchodilator effect. Clearly, the
subject's lungs and airways have not changed, however. The increase of FEV1 with less effort shown on curve b
can be considered an artifact resulting from the slight difference in initial effort.
View Figure
FIG. 5-2. By definition, the FEF25-75 (forced expiratory flow rate) is
measured over the middle 50% of the vital capacity (A). The
spirograms and flow-volume curves show an increase in both flow
and volume after use of a bronchodilator. Yet the control FEF25-75
(0.67 L/s) is higher than the postdilator value (0.5 L/s). The reason
for this apparent paradox can be appreciated from the flow-volume
curves (B). The solid arrows indicate the volume range over which
the control FEF25-75 is calculated. The dashed arrows show the
volume range over which the postdilator FEF25-75 is calculated. The
flows are lower at the end of the 25 to 75% volume range on the
postdilator curve than those on the control curve. More time is
spent at the low flows, which, in turn, causes the postdilator FEF25-75
to be lower than the control value. Recommendation: Do not use
the FEF25-75 to evaluate bronchodilator response. Instead use the
forced expiratory volume in 1 second and always look at the curves.
There is a physiologic explanation for this apparent paradox, and the interested reader is referred to Krowka
and associates [3], but it is sufficient that one be alert to this potentially confusing occurrence, which can be
very marked in patients with obstructive lung disease. The best way to avoid this problem is to require that all
flow-volume curves have sharp peak flows, as in curve a on Figure 5-4, especially when two efforts are
compared. Short of that, the peak flows should be very nearly identical (<10-15% difference). The principle
also applies to bronchial challenge testing (see below). This paradoxical behavior can easily be identified from
flow-volume curves; it is almost impossible to recognize it from volume-time graphs.
P.55](https://image.slidesharecdn.com/interpretationofpulmonaryfunctiontests-170711145442/85/Interpretation-of-pulmonary-function-tests-a-practical-guide-48-320.jpg)
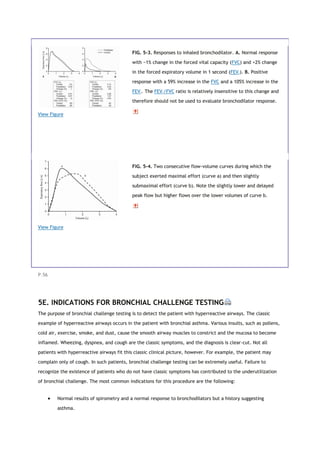
![Although methacholine provokes only the early phase of the classic asthmatic hyperreactive airway response, it
nevertheless is an excellent predictor of the presence of asthma. Thus, a positive
P.58
result on methacholine challenge testing is predictive of asthma attacks provoked by, for example, cold air,
exercise, pollens, or infection. An example of a positive methacholine challenge study is illustrated in Figure 5-
5.
View Figure
FIG. 5-5. Results of bronchial challenge testing in a 43-year-old
woman who had a 3-year history of persistent cough, often at night.
She denied wheezing but had mild dyspnea on exertion. One breath
of methacholine produced a parallel shift in the flow-volume curve,
no change in the ratio of forced expiratory volume in 1 second to
forced vital capacity (FEV1/FVC), a decrease of 11% in the FEV1, and
mild chest tightness. She was given four additional breaths of
methacholine, and cough and chest tightness developed, but there
was no audible wheezing. This is a positive test result with a 36%
decrease in the FEV1. Note that at five breaths, the flow-volume
curve shows scooping and is no longer parallel with the control
curve. The curve after one breath demonstrates that mild
bronchoconstriction may produce only a mild decrease in FEV1 and
no change in the FEV1/FVC ratio (see section 3E, page 36 and Fig. 3-
8A, page 38). Further constriction (curve after five breaths) leads to
a flow-volume curve that is classic for obstruction, with scooping, a
low FEV1, and a decreased FEV1/FVC ratio.
Several protocols have been developed for bronchial challenge testing [4]. Clinically, the goal is to determine
whether the patient has asthma. For this purpose, we favor a simple screening procedure such as that
described by Parker and associates [5] in 1965. The procedure is as follows:
Five milliliters of a 25 mg/mL solution of methacholine chloride in normal saline is freshly prepared,
and 2 to 3 mL
P.59
is placed in a standard nebulizer. It is not advisable to subject a patient to bronchial challenge if the
baseline FEV1 is less than 65% of predicted. If the FEV1 is between 65 and 75% of predicted, the test is
done with caution. If very hyperreactive airways are suspected, a concentration of 5 mg/mL or lower](https://image.slidesharecdn.com/interpretationofpulmonaryfunctiontests-170711145442/85/Interpretation-of-pulmonary-function-tests-a-practical-guide-51-320.jpg)
![ Many patients with COPD or chronic bronchitis have an increase in bronchial reactivity. Their results
on methacholine challenge will usually be between those of normal subjects and persons with asthma.
The clinical history is usually sufficiently different in the two groups to permit distinction; however,
there can be considerable overlap, leading to confusion in diagnosis and treatment.
Airway reactivity may vary over time. Airway responsiveness in asthma improves with long-term
inhaled corticosteroid therapy. The degree of responsiveness correlates with the degree of airway
narrowing because narrowed airways need to constrict only slightly to increase resistance and
decrease the FEV1 markedly.
5G. EXHALED NITRIC OXIDE IN LABORATORY ASSESSMENT OF ASTHMA
Asthma is recognized as a disease characterized by airway obstruction, airway hyperresponsiveness to
contractile stimuli, and
P.61
airway inflammation. The challenges in the laboratory assessment of asthma are to identify evidence of
inflammation or airway hyperresponsiveness in patients without baseline airway obstruction and to distinguish
asthma as a cause of airway obstruction from other causes. Spirometry is helpful for grading the degree of
airway obstruction both at baseline and after bronchodilator administration. Bronchoprovocation, most
commonly with methacholine, is not always used because there are safety issues for patients with moderate to
severe obstruction and for certain other patients (for example, pregnant women and patients with other
medical conditions). Measures of airway inflammation are even less commonly used. Bronchial mucosal biopsy
is invasive, and quantification of sputum eosinophils is challenging to perform accurately, although it has been
standardized.
For these reasons, an alternative assessment of airway inflammation could be helpful. Measurement of exhaled
nitric oxide (NO) has been shown to correlate well with the presence of eosinophilic mucosal inflammation in
patients with asthma [6]. NO was first described in exhaled breath in 1991. NO has been shown to be increased
in most asthmatics and to be reduced by therapy with inhaled corticosteroids. It is also increased in viral
respiratory tract infections, lupus erythematosus, hepatic cirrhosis, and lung transplant rejection. It is reduced
or variable in COPD and cystic fibrosis and human immunodeficiency virus infection with pulmonary
hypertension. It is decreased both acutely and chronically by cigarette smoking. Measurement of exhaled NO
has been most widely applied for the diagnosis and management of asthma. The normal value for exhaled NO
from the mouth is 3 to 7 parts per billion (ppb). The upper limit of normal, used to distinguish healthy persons
from patients with asthma, has been variously reported between 15 and 30 ppb.
The method for measuring exhaled NO is somewhat complex and very dependent on a precise method for
reproducible results. Care must be taken to maintain a stable airway pressure and expiratory flow rate and to
avoid contamination with nasal air, which has a much higher concentration of NO. Methods also have been
developed for measuring nasal exhaled NO as an indicator of allergic rhinitis. The American Thoracic Society
and European Respiratory Society [7] published recommendations for standardized procedures for online and
offline measurement of exhaled lower respiratory tract NO and nasal NO in 2005.](https://image.slidesharecdn.com/interpretationofpulmonaryfunctiontests-170711145442/85/Interpretation-of-pulmonary-function-tests-a-practical-guide-53-320.jpg)
![P.62
There are several manufacturers of equipment for measuring NO. All equipment is based on
chemiluminescence, a photochemical reaction of NO with ozone under high-vacuum conditions. The devices
cost $40,000 to $50,000. A new CPT code, 95012, was approved by the American Medical Association in 2007
for billing for procedures.
The role of measurement of exhaled NO in the diagnosis and management of asthma is evolving. The value
should be clarified with ongoing studies.
REFERENCES
1. GOLD: The global initiative for chronic obstructive lung disease [homepage on the Internet]. Bethesda (MD):
National Heart, Lung, and Blood Institute, National Institutes of Health, USA, and the World Health
Organization [cited 2007 Dec 17]. Available from: http://www.goldcopd.com.
2. COPD guidelines. New York: American Thoracic Society; c2007 [cited 2007 Dec 17]. Available from:
http://www.thoracic.org/sections/copd/.
3. Krowka MJ, Enright PL, Rodarte JR, Hyatt RE. Effect of effort on measurement of forced expiratory volume
in one second. Am Rev Respir Dis 136:829-833, 1987.
4. Crapo RO, Casaburi R, Coates AL, et al. Guidelines for methacholine and exercise challenge testing—1999.
Am J Respir Crit Care Med 161:309-329, 2000.
5. Parker CD, Bilbo RE, Reed CE. Methacholine aerosol as test for bronchial asthma. Arch Intern Med 115:452-
458, 1965.
6. Payne DN, Adcock IM, Wilson NM, et al. Relationship between exhaled nitric oxide and mucosal eosinophilic
inflammation in children with difficult asthma, after treatment with oral prednisolone. Am J Respir Crit Care
Med 164:1376-1381, 2001.
7. American Thoracic Society; European Respiratory Society. ATS/ERS recommendations for standardized
procedures for the online and offline measurement of exhaled lower respiratory nitric oxide and nasal nitric
oxide, 2005. Am J Respir Crit Care Med 171:912-930, 2005](https://image.slidesharecdn.com/interpretationofpulmonaryfunctiontests-170711145442/85/Interpretation-of-pulmonary-function-tests-a-practical-guide-54-320.jpg)
![6
Arterial Blood Gases
Arterial blood gas analysis is performed to answer various clinical questions: Is gas exchange normal? Is there
carbon dioxide retention in the patient with chronic obstructive pulmonary disease (COPD), severe asthma, or
severe restrictive disease? Is there hypoxemia (low oxygen saturation)? Does the saturation decrease with
exercise? What is the acid-base status?
Several important aspects need to be considered for obtaining and handling arterial blood specimens. The
laboratory must always indicate on the report form whether the patient was breathing room air or an increased
oxygen concentration. As stated in section 3B (page 29), the arterial oxygen tension may be lower in the supine
position than the upright posture. Therefore, the posture of the patient should be noted. The patient should be
neither hyperventilating nor holding his or her breath. The specimen should not contain any air bubbles, and it
should be quickly iced and promptly analyzed. Similar precautions apply to analysis of the pH of pleural fluid
when empyema is a possibility.
6A. ARTERIAL OXYGEN TENSION
There are four major steps in the transfer of oxygen from inhaled air to the tissues:
Ventilation of the alveoli must be adequate.
Within the lung, the inhaled air must come in contact with venous blood; that is, there must be
adequate matching of ventilation ([V with dot above]) to perfusion ([Q with dot above]).
There must be diffusion of the oxygen through the alveolar wall into the hemoglobin in the red cells
(see Chapter 4).
P.64
Oxygenated hemoglobin must then be transported by the cardiovascular system to the tissues.
The first two steps are discussed in this chapter. Transport, or so-called internal respiration, deals with the
oxygen content of blood, the cardiac output, and the distribution of blood flow to the organs, and this topic is
outside the province of this book.
The tension of oxygen in the arterial blood (Pao2) reflects the adequacy of the transfer of oxygen from ambient
air to blood. In normal young adults, the Pao2 values at sea level range from 85 to 100 mm Hg. The values
decrease slightly with age, to about 80 mm Hg at age 70. Hypoxemia exists when the Pao2 is less than these
values. The oxygen dissociation curve is useful in the consideration of hypoxemia. Figure 6-1 shows the average
values for the oxygen tension of mixed venous blood (V ˜ P[v with bar above]o2 = 40 mm Hg, saturation 75%)
and arterial blood (a ˜ Pao2 = 100 mm Hg, saturation 96%). The curve is very steep at and below the venous
point where small changes in oxygen tension produce dramatic change in the oxygen content of blood, and
hence the saturation. Conversely, at oxygen tensions of more than 60 to 70 mm Hg, large changes in tension
have a relatively small effect on saturation.](https://image.slidesharecdn.com/interpretationofpulmonaryfunctiontests-170711145442/85/Interpretation-of-pulmonary-function-tests-a-practical-guide-55-320.jpg)
![P.65
Hence, very little additional oxygen can normally be added to the blood by using very high inspired oxygen
tensions. Cyanosis is not easily appreciated until the saturation has decreased to less than 75%.
View Figure
FIG. 6-1. Oxyhemoglobin dissociation curve for hemoglobin that
plots oxygen saturation against the partial pressure of oxygen (Po2)
and also the oxygen content (Co2). P50 is the partial pressure of
oxygen that results in a 50% saturation of hemoglobin. a, arterial
blood; v, mixed venous blood. (From AE Taylor, K Rehder, RE Hyatt,
et al [eds]. Clinical Respiratory Physiology. Philadelphia: Saunders,
1989. Used with permission.)
The four common causes of hypoxemia occurring with a normal inspired oxygen tension and barometric
pressure are hypoventilation, ventilation-perfusion ([V with dot above]/[Q with dot above]) mismatch, shunt,
and impaired diffusion.
Hypoventilation
This term refers specifically to alveolar hypoventilation. There are two important, distinguishing features of
alveolar hypoventilation. One feature is that arterial carbon dioxide tension (Paco2) is always increased. The
following simple equation defines the relationship between Paco2 and alveolar ventilation ([V with dot above]A)
and carbon dioxide production by the body ([V with dot above]co2) (“k” is a constant):
Assume [V with dot above]co2 stays constant. When ([V with dot above]A) decreases, Paco2 must increase.
Similarly, an increase in [V with dot above]co2 can increase Paco2, unless alveolar ventilation increases
proportionately.
A way to think of alveolar ventilation is as follows. When a subject inhales a tidal volume breath (designated
VT), a certain amount of that breath does not reach the gas-exchanging alveoli. A portion stays in the upper
airway, trachea, and bronchi, and a portion may go to alveoli with no perfusion (especially in disease), so that
gas exchange does not occur in either case. This fraction of the inhaled VT is referred to as the dead space
volume (VD). The VD is small in normal conditions but increased in diseases such as emphysema and chronic
bronchitis. If total ventilation ([V with dot above]E) is defined as the ventilation measured at the mouth, then](https://image.slidesharecdn.com/interpretationofpulmonaryfunctiontests-170711145442/85/Interpretation-of-pulmonary-function-tests-a-practical-guide-56-320.jpg)
![That is, alveolar ventilation is the total ventilation minus the amount ventilating the dead space. Thus, [V with
dot above]A in Equation 1 may be reduced by a decrease in [V with dot above]E or by an increase in VD/VT.
The second feature is that the hypoxemia due to alveolar hypoventilation can always be corrected by
increasing the inspired
P.66
oxygen concentration. An increase of approximately 1 mm Hg in inspired oxygen tension produces a 1-mm Hg
increase in arterial oxygen tension. Inspired oxygen can be increased several hundred millimeters of mercury,
and the hypoxemia is easily corrected. Some of the more common causes of hypoventilation are listed in Table
6-1; all reflect abnormalities in the function of the respiratory pump.
TABLE 6-1. Some causes of alveolar hypoventilation
Central nervous system depression caused by drugs, anesthesia, hypothyroidism
Disorders of the medullary respiratory center caused by trauma, hemorrhage, encephalitis, stroke,
tumor
Disorders of respiratory control such as sleep apnea and the obesity hypoventilation syndrome
Chest trauma with flail chest, kyphoscoliosis, thoracoplasty
Neuromuscular disease affecting the efferent nerves (such as poliomyelitis, Guillain-Barré syndrome,
and amyotrophic lateral sclerosis); the neuromuscular junction (such as myasthenia gravis); or the
respiratory muscles (such as muscular dystrophy, acid maltase deficiency, and other myopathies)
Hypoventilation can be identified as a cause of hypoxia with use of the alveolar air equation:
where PAO2 is the partial pressure of oxygen in the alveoli, Patm is atmospheric pressure, PH2O is the partial
pressure of water (47 mm Hg at body temperature), FIO2 is the fraction of inspired oxygen, PACO2 is the partial
pressure of carbon dioxide in the alveoli, and RQ is respiratory quotient (usually 0.7-0.8 with a normal diet).
PAO2-Pao2 is usually called the A-a gradient or, (A-a) Do2. It is typically less than 10 in a young person and less
than 20 in an older person. If it is normal, hypoxia is due to hypoventilation or a low FIO2. If it is high, hypoxia
may be due to [V with dot above]/[Q with dot above] mismatch, shunt, or diffusion impairment.](https://image.slidesharecdn.com/interpretationofpulmonaryfunctiontests-170711145442/85/Interpretation-of-pulmonary-function-tests-a-practical-guide-57-320.jpg)
![Ventilation-Perfusion Mismatch
Instead of the normal situation in which nearly equal volumes of air and venous blood go to all alveoli, a
disparity (mismatch) may develop. Increased blood flow ([Q with dot above]) may go to alveoli whose
ventilation ([V with dot above]) is reduced. Conversely, increased ventilation may go to areas with reduced
blood flow. The result in either case is impaired gas exchange, often of a significant degree. In the
P.67
ultimate hypothetical mismatch, all the blood goes to one lung and all the ventilation to the other, a situation
incompatible with life. In the real-life situation, hypoxemia due to [V with dot above]/[Q with dot above]
mismatch can be improved and usually corrected by increased inspired oxygen concentrations.
[V with dot above]/[Q with dot above] mismatch is the most common cause of hypoxemia encountered in
clinical practice. It explains the hypoxemia in chronic bronchitis, emphysema, and asthma. It also explains
much of the hypoxemia in interstitial lung disease and pulmonary edema.
Estimating the degree and type of mismatch is complex and beyond the scope of this book. Suffice it to say, an
increase in the (A-a) Do2 most often suggests the existence of lung regions with a low [V with dot above]/[Q
with dot above] ratio, due to perfusion exceeding ventilation. The so-called physiologic dead space (VD) can
also be estimated; an increase implies the existence of lung regions with a high [V with dot above]/[Q with dot
above] ratio due to a relative increase in ventilation. To pursue this interesting subject further, the reader
should consult a standard text of respiratory physiology.
Right-to-Left Shunt
In this situation, a quantity of venous blood totally bypasses the alveoli. The shunt may be intracardiac, as in
atrial septal defect or tetralogy of Fallot, or it may occur within the lung, such as with arteriovenous fistulas in
hereditary hemorrhagic telangiectasia (the Osler-Weber-Rendu syndrome). Blood flow through a region of total
pneumonic consolidation or atelectasis also constitutes a right-to-left shunt. In shunt, the hypoxemia cannot be
abolished by breathing 100% oxygen.
Impaired Diffusion
Diffusion is discussed in detail in Chapter 4. As mentioned before, [V with dot above]/[Q with dot above]
mismatch may contribute to the reduction in the diffusing capacity that is measured in the laboratory.
Breathing a high-oxygen concentration can usually correct the hypoxemia caused by the diffusion impairment.
Mixed Causes
There are also mixed causes of hypoxemia. The patient with COPD and pneumonia has both [V with dot
above]/[Q with dot above] mismatch and right-to-left
P.68
shunting. The patient with pulmonary fibrosis has both a diffusion defect and [V with dot above]/[Q with dot
above] mismatch.
6B. ARTERIAL CARBON DIOXIDE TENSION
The normal values for Paco2 range from 35 to 45 mm Hg and, unlike Pao2, are not affected by age. Figure 6-2
contrasts the dissociation curve of carbon dioxide with that of oxygen. The carbon dioxide curve does not have](https://image.slidesharecdn.com/interpretationofpulmonaryfunctiontests-170711145442/85/Interpretation-of-pulmonary-function-tests-a-practical-guide-58-320.jpg)
![a plateau. Thus, the carbon dioxide content of blood is strongly dependent on Paco2, which in turn is inversely
proportional to the level of alveolar ventilation (Eq. 1).
Hypercapnia (that is, carbon dioxide retention with increased Paco2) can result from either of two mechanisms.
The first mechanism, hypoventilation (Table 6-1), is more readily understood. Section 6A explains that Paco2 is
inversely proportional to
P.69
alveolar ventilation (Eq. 1). When alveolar ventilation decreases, Paco2 increases.
View Figure
FIG. 6-2. Comparison of the shape of the oxyhemoglobin and carbon
dioxide dissociation curves. The slope of the carbon dioxide
dissociation curve is about three times steeper than that of the
oxyhemoglobin dissociation curve. Cco2 is the carbon dioxide
content of blood, Co2 is the oxygen content of blood, and Pco2 and
Po2 are the partial pressures of carbon dioxide and oxygen in blood,
respectively. (Modified from JB West [ed]. Respiratory Physiology:
The Essentials [3rd ed]. Baltimore: Williams & Wilkins, 1985. Used
with permission.)
The second mechanism is that severe [V with dot above]/[Q with dot above] mismatch can also lead to carbon
dioxide retention. When Pao2 decreases as a result of [V with dot above]/[Q with dot above] mismatch, as
discussed previously, Paco2 increases. This commonly occurs in COPD. However, in some patients ventilation
increases to maintain a normal Paco2. Pao2 also improves some. These are the “pink puffers.” In other patients
with COPD, the Paco2 increases and the Pao2 decreases as a result of [V with dot above]/[Q with dot above]
mismatch. These are the classic “blue bloaters,” the cyanotic hypoventilators. Of course, many patients with
COPD have a course between these two extremes.
6C. ARTERIAL pH
pH is the negative log of the hydrogen ion concentration. This means that in acidosis (low pH) there is an
increase in H+
ions. The converse holds for alkalosis, with its decrease in H+
ions and increased pH.
The acid-base status of the blood is classically analyzed in terms of the Henderson-Hasselbalch equation for the
bicarbonate buffer system, which highlights the importance of the arterial partial pressure of carbon dioxide
(Pco2).
The pK is a constant related to the dissociation of carbonic acid. Note that with constant bicarbonate,
increases in the Pco2 lower the pH. Conversely, lowering the Pco2 by increasing ventilation produces alkalosis
(increased pH).](https://image.slidesharecdn.com/interpretationofpulmonaryfunctiontests-170711145442/85/Interpretation-of-pulmonary-function-tests-a-practical-guide-59-320.jpg)
![Respiratory alterations in acid-base status are related to elimination of carbon dioxide. Metabolic
abnormalities, however, entail either a gain or a loss of fixed acid or bicarbonate in the extracellular fluid.
Metabolic alterations in acid-base balance are rapidly compensated for by alternating the amount of carbon
dioxide eliminated by ventilation. This is followed by the slower elimination by the kidneys of excess acid or
base.
The Davenport pH-[HCO3
−
] diagram shown in Figure 6-3 is a useful way of looking at the body's response to acid-
base alterations. It is a graphic representation of the Henderson-Hasselbalch equation. Shown are three
different buffer lines
P.70
(slanting down and to the right) defining the [HCO3
−
] and pH responses resulting from adding metabolic acid or
base to plasma. Also shown are three isopleths (slanting up and to the right) relating pH to [HCO3
−
] for three
levels of Pco2. Point A indicates the normal situation: pH = 7.4, [HCO3
−
] = 24 mEq/L, and Pco2 = 40 mm Hg.
View Figure
FIG. 6-3. Davenport diagram showing [HCO3
−
] as a function of pH
and partial pressure of carbon dioxide (Pco2). (From AE Taylor, K
Rehder, RE Hyatt, et al [eds]. Clinical Respiratory Physiology.
Philadelphia: Saunders, 1989. Used with permission.)
Compensatory Mechanisms
Respiratory acidosis: Point B in Figure 6-3 shows the result of acute hypoventilation; Pco2 increases
and pH decreases. The kidney seeks to compensate for the acidosis when hypoventilation becomes
chronic, as in COPD, by conserving [HCO3
−
]. The result is that point B moves toward point D and pH
returns toward normal.
Respiratory alkalosis: Point C shows what occurs with acute hyperventilation; Pco2 decreases and pH
increases. As hyperventilation persists, for example, during acclimatization to altitude, the kidneys
excrete [HCO3
−
], and as predicted from Equation 2 the pH is normalized from C toward F.
P.71](https://image.slidesharecdn.com/interpretationofpulmonaryfunctiontests-170711145442/85/Interpretation-of-pulmonary-function-tests-a-practical-guide-60-320.jpg)
![ Metabolic acidosis: Point G represents acidosis due to the accumulation of fixed acids with a lowering
of plasma [HCO3
−
]. The respiratory system attempts to compensate by increasing ventilation, thus
lowering Pco2 and moving from G toward F. The classic example is the hyperpnea of diabetic acidosis.
Metabolic alkalosis: Loss of fixed acids, as with repeated vomiting, causes a shift from A to E. The
respiratory response is a decrease in ventilation resulting in an increase in Pco2 and movement from E
toward D.
6D. AN ALTERNATIVE APPROACH TO ACID-BASE ANALYSIS
An alternative approach to the Davenport diagram is preferred by some and may be easier to use in the
community hospital. Not all laboratories that perform arterial blood gas analysis have a co-oximeter to
determine the bicarbonate level. The bicarbonate level can be calculated with the Henderson equation, in
which [H+
] is the hydrogen ion concentration:
This can be rearranged to calculate the bicarbonate concentration:
The hydrogen ion concentration (in mEq) can be calculated from the pH. Typical values are listed in Table 6-2.
Intermediate values can be calculated by interpolation. Once the bicarbonate,
P.72
the pH, and the Pco2 values are found, the acid-base status can be determined, and respiratory and metabolic
causes of acidosis and alkalosis can be distinguished, as discussed in section 6C and Figure 6-3. A complete
discussion of acid-base disturbances is beyond the scope of this book.
TABLE 6-2. Relation of pH to hydrogen ion concentration
pH [H+
]
7.50 32
7.40 40
7.30 50
7.22 60](https://image.slidesharecdn.com/interpretationofpulmonaryfunctiontests-170711145442/85/Interpretation-of-pulmonary-function-tests-a-practical-guide-61-320.jpg)

![7
Other Tests of Lung Mechanics: Resistance and
Compliance
The tests described here are usually performed in fully equipped laboratories. In the outpatient setting, they
add relatively little to the basic evaluations discussed in previous chapters (spirometry, lung volumes, diffusing
capacity, and arterial blood gases). However, these tests might be encountered in either graduate training or
in laboratory reports and therefore are considered briefly. Also, understanding these concepts is important in
the management of patients requiring mechanical ventilation.
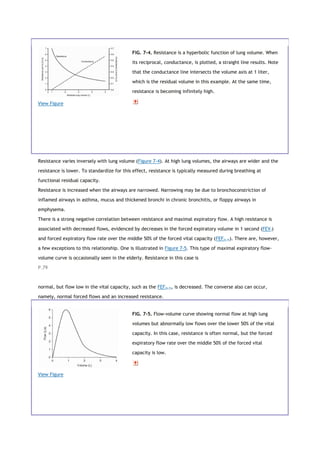
7A. RESISTANCE
Resistance is the pressure required to produce a flow of 1 L/s into or out of the lung. The units are centimeters
of water per liter per second, (cm H2O per liter per second). This general concept is illustrated in Figure 7-1, in
which the pertinent driving pressure (ΔP) is the pressure difference between the ends of the tubes. The
pressure required to produce a flow of 1 L/s in a large tube is less than that in a small tube. Hence, the
resistance (R) of the small tube is much higher than that of the large tube.
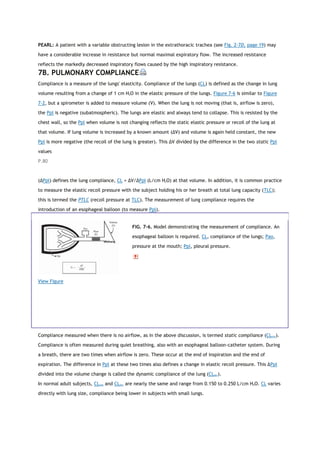
In the lung, measurement of the resistance of the entire system is of interest. Figure 7-2 illustrates how this
can be obtained. Flow at the mouth can be measured with a flowmeter. The pressure driving the flow can be
measured in either of two ways. Pleural pressure (Ppl) can be measured from a small balloon-catheter unit
placed in the lower third of the esophagus and attached to
P.76
a pressure transducer. Pressure changes in the esophagus have been shown to reflect those in the pleural
cavity. The difference between Ppl and Pao (the pressure at the mouth) is the driving pressure, which divided
by flow ([V with dot above]) is defined as the pulmonary resistance (Rpulm). Rpulm includes airway resistance
plus a small component due to the resistance of the lung tissue.
View Figure
FIG. 7-1. Measurement of resistance (R) through a large tube (A)
and small tube (B). Flow ([V with dot above]) is measured by the
flowmeter, and driving pressure (ΔP) is measured by a differential
pressure transducer. To drive the same flow, the decrease in
pressure is greater in tube B and hence the resistance (R) of tube B
is higher than that of tube A.
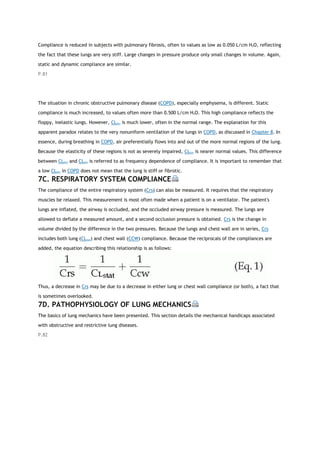
The other and much more common resistance measurement is obtained by measuring alveolar pressure (Palv)
and relating this to Pao. Palv can be measured in a body plethysmograph and does not require swallowing an
esophageal balloon. In this method, the driving pressure is Palv minus Pao. This result is divided by flow to](https://image.slidesharecdn.com/interpretationofpulmonaryfunctiontests-170711145442/85/Interpretation-of-pulmonary-function-tests-a-practical-guide-64-320.jpg)
![determine the airway resistance, Raw. Raw is slightly lower than Rpulm because of the absence of tissue
resistance. Both Rpulm and Raw can be measured during either inspiration or expiration, or as an average of
both. Figure 7-3 describes how Raw is measured.
Average resistance in normal adults is 1 to 3 cm H2O/L per second. It is higher in the small lungs of children
because the airways are smaller. Occasionally, the term conductance is used. Conductance is a term borrowed
from the electrical engineering field and is the reciprocal of resistance, its units being liters per second per
centimeter of water, L/s per cm H2O. Thus, a high resistance means a low conductance—flow is not
“conducted” well.
P.77
View Figure
FIG. 7-2. Model illustrating how pulmonary resistance (Rpulm) and
airway resistance (Raw) are measured. An esophageal balloon is
required to measure pleural pressure (Ppl). Palv, alveolar pressure;
Pao, pressure at the mouth; [V with dot above], flow.
View Figure
FIG. 7-3. The equipment used to measure lung volume by the body
plethysmograph (see Fig. 3-6, page 34) has been modified by
inserting a flowmeter between the patient's mouth and the pressure
gauge and valve. The flowmeter measures airflow ([V with dot
above]). The subject is instructed to pant shallowly through the
system with the valve open. This provides a measure of
plethsymographic pressure as a function of flow, that is, Ppleth/[V
with dot above]. With the subject still panting, the valve is closed.
This provides a measure of alveolar pressure as a function of
plethysmographic pressure, that is, Palv/Ppleth. As shown, airway
resistance (Raw) is obtained by multiplying these two ratios.
P.78](https://image.slidesharecdn.com/interpretationofpulmonaryfunctiontests-170711145442/85/Interpretation-of-pulmonary-function-tests-a-practical-guide-65-320.jpg)
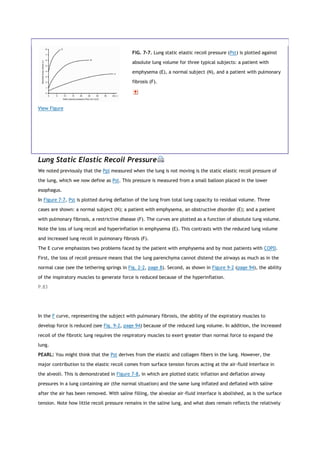
![View Figure
FIG. 7-9. The pleural pressure generated during an inspiratory
breath is plotted for a normal subject (N), a patient with
emphysema (E), and a patient with fibrosis (F). The inspiratory
loops are plotted on the static recoil curves of Figure 7-7. The
hatched areas reflect the work of breathing required to overcome
the resistance to airflow (RS). The areas between the static curve
and the zero-pressure line reflect the work required to keep the
lung inflated, the elastic work (EL). See text for further discussion.
Static Lung Recoil Pressure and Maximal Expiratory Flow
In section 2B (page 6) and Figure 2-2 (page 8), we noted that lung elasticity, specifically Pst, is the pressure
that drives maximal expiratory flow. It is informative to evaluate the relationship between maximal expiratory
flow and Pst. Figure 7-10A shows how this relationship is obtained, and Figure 7-10B shows its behavior in
normal and diseased lungs.
In Figure 7-10A, flow-volume and static lung recoil curves for a normal subject and a patient with pure
emphysema are plotted on the common vertical axis of absolute lung volume. Thus, at any lung volume
corresponding to the decreasing portion of the flow-volume curve, it is possible to measure simultaneous values
of maximal expiratory flow ([V with dot above]max) and Pst.
View Figure
FIG. 7-10. Relationships between maximal expiratory flow ([V with
dot above] max) and lung static elastic recoil pressure (Pst). A. [V
with dot above]max and Pst are plotted on a common vertical
absolute volume axis for a normal subject and a patient with pure
emphysema. B. Corresponding values of [V with dot above]max and
Pst obtained at various lung volumes are plotted with [V with dot
above]max as a function of Pst. This is called a maximal flow static
recoil curve. In the case of chronic bronchitis, the flow-volume and
Pst-volume curves are not shown. See text for further discussion.
P.86
In Figure 7-10B, Pst is plotted against [V with dot above]max at various lung volumes. Such a graph is called a
maximal flow static recoil (MFSR) curve. The normal range of values is shown by the two dashed lines. Values
obtained from the normal curve in Figure 7-10A are connected by the solid line. The same has been done for](https://image.slidesharecdn.com/interpretationofpulmonaryfunctiontests-170711145442/85/Interpretation-of-pulmonary-function-tests-a-practical-guide-71-320.jpg)

![View Figure
FIG. 8-3. Normal distribution of a breath of oxygen inhaled from
residual volume and the resulting gravity-dependent alveolar
nitrogen concentration (N2 conc). A. Lung at residual volume. B.
Lung after a maximal inspiration to total lung capacity.
P.90
Phase III consists entirely of alveolar gas. During a slow expiration, initially gas comes predominantly from the
dependent alveolar regions, where the nitrogen concentration is lowest. As expiration continues, increasing
amounts of gas come from the more superior regions, where nitrogen concentrations are higher. This sequence
of events produces a gradually increasing nitrogen concentration during phase III. The normal slope of phase III
is 1.0 to 2.5% nitrogen per liter expired. This value increases in the elderly.
An abrupt increase in nitrogen concentration occurs at the onset of phase IV. This reflects the decreased
emptying of the dependent regions of the lung. Most of the final expiration comes from the apical regions,
which have a higher concentration of nitrogen. The onset of phase IV is said to reflect the onset of airway
closure in the dependent regions, and it is often called the closing volume. Whether airway closure actually
occurs at this volume is debatable [1]. Normally, phase IV occurs with approximately 15% of the vital capacity
still remaining. This value increases during normal aging, up to values of 25% vital capacity.
8B. CHANGES IN THE SINGLE-BREATH NITROGEN TEST IN DISEASE
In obstructive lung disease, the SBN2 test is altered in two ways (Fig. 8-2B). The lung volume at which phase IV
occurs (closing volume) increases. In addition, the slope of phase III increases. This occurs because the normal
pattern of gas distribution, including the vertical gradient of nitrogen concentration described previously, is
gradually abolished. Disease occurs unevenly throughout the lung. Regions of greater disease with high airway
flow resistance empty less completely and hence receive less oxygen, and thus their nitrogen concentration is
well above normal levels. Because the diseased areas empty more slowly than the more normal regions, the
slope of phase III is greatly increased.
In more advanced obstructive disease (Fig. 8-2C), there is no longer a phase IV. It becomes lost in the very
steep slope of phase III.
P.91](https://image.slidesharecdn.com/interpretationofpulmonaryfunctiontests-170711145442/85/Interpretation-of-pulmonary-function-tests-a-practical-guide-75-320.jpg)
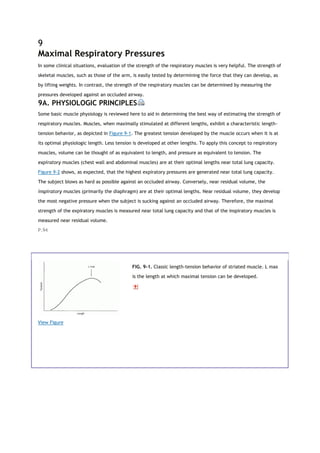
![*
Numbers represent mean ±2 standard deviations.
9C. NORMAL VALUES
Normal values obtained from a motivated group of 60 healthy male and 60 healthy female subjects are listed in
Table 9-1. As anticipated from Figure 9-2, PEmax is roughly double the PImax. Male subjects developed greater
pressures than female subjects, and both sexes had a decline in pressure with age, except for inspiratory
pressures in male subjects.
9D. INDICATIONS FOR MAXIMAL PRESSURE MEASUREMENTS
In patients with neuromuscular disease who have dyspnea, measurement of respiratory muscle
strength is a more sensitive test than spirometry or maximal voluntary ventilation [1]. We studied 10
patients with early neuromuscular diseases (amyotrophic lateral sclerosis, myasthenia gravis, and
polymyositis). Eight of the 10 had considerable dyspnea, but only 2 had a significant reduction in the
vital capacity (77%). Five had a reduced maximal voluntary ventilation (73%). However, nine patients
had significant reductions in PEmax (47% predicted) and PImax (34% predicted). In the early stages,
dyspnea was best explained by a reduction in respiratory muscle strength at a time when the strength
of other skeletal muscles was little impaired. Table 9-2 lists some neuromuscular conditions in which
respiratory muscle weakness has been encountered.
P.98
It is useful to measure respiratory muscle strength in the cooperative subject with an isolated,
unexplained decrease in the vital capacity or maximal voluntary ventilation. Such decreases could be
early signs of respiratory muscle weakness and could explain a complaint of dyspnea. Other conditions
in which muscle weakness has been documented are lupus erythematosus, lead poisoning,
scleroderma, and hyperthyroidism.](https://image.slidesharecdn.com/interpretationofpulmonaryfunctiontests-170711145442/85/Interpretation-of-pulmonary-function-tests-a-practical-guide-80-320.jpg)

![P.104
10D. WHAT IS PROHIBITIVE RISK?
Several algorithms have been developed for calculation of lung function after resection of lung tissue. One
approach requires an estimation of the number of lung segments, out of a total of 18, that are likely to be
removed. Then the following calculation is performed:
Thus, if five segments are to be removed and the preoperative FEV1 is 2.0 L, the predicted postoperative FEV1
is 1.4 L
The postoperative FEV1 predicted from this calculation is the estimated level of lung function after full
recovery, not immediately after operation. In the past, a common recommendation was that surgical resection
should not be performed if the predicted postoperative FEV1 was less than 0.8 L. However, several studies
show that with modern postoperative care this is no longer an absolute contraindication. Specialized centers
with excellent perioperative care have reported low morbidity and mortality in such severely impaired patients
[1].
REFERENCE
1. Cerfolio RJ, Allen MS, Trastek VF, Deschamps C, Scanlon PD, Pairolero PC. Lung resection in patients with
compromised pulmonary function. Ann Thorac Surg 62:348-351, 1996.](https://image.slidesharecdn.com/interpretationofpulmonaryfunctiontests-170711145442/85/Interpretation-of-pulmonary-function-tests-a-practical-guide-86-320.jpg)
![These simple walking tests are useful for quantifying and documenting over time a patient's exercise capacity.
They can be utilized in both pulmonary and cardiac disease with reasonable precautions. They are also valuable
for quantifying the progress of patients in rehabilitation programs [1].
The tests are best performed in a building with unobstructed, level corridors. A distance of 100 ft can be
measured and the number of laps counted. Neither test is superior over the other. Because the 6-minute test is
less demanding, it is used more often, especially in very sick patients. The subject is instructed to walk back
and forth over the course and go as far as possible in 6 minutes. The subject should be encouraged by
standardized statements such as “You're doing well” or “Keep up the
P.107
good work.” Subjects are allowed to stop and rest during the test but are asked to resume walking as soon as
possible. Pulse rate is recorded before and after the test. If the patient is receiving oxygen, the flow rate and
mode of transport, such as carried or pulled unit, are recorded.
TABLE 11-1. Relation of 6- and 12-minute walks to speed*
Distance (ft) walked in:
Speed (mph) 6 min 12 min
3 1,584 3,168
2 1,056 2,112
1 528 1,056
0.5 264 528
0.25 132 264
*
Prediction equations for the distance walked during the 6-minute (6MWD) test for adults of ages 40 to
80 years. Results are given in meters (1 meter = 3.28 ft) [2]. Men: 6MWD = (7.57 × height cm) - (5.02 ×
age yr) - (1.76 × weight kg) - 309 meters. Women: 6MWD= (2.11 × height cm) - (5.78 × age yr) - (2.29 ×
weight kg) + 667 meters [2].](https://image.slidesharecdn.com/interpretationofpulmonaryfunctiontests-170711145442/85/Interpretation-of-pulmonary-function-tests-a-practical-guide-88-320.jpg)
![Table 11-1 relates the distances walked to the average rate of walking in miles per hour. Prediction equations
for the 6-minute test are available for average healthy adults of ages 40 to 80 years [2]. These are listed in
Table 11-1. The use of the test is twofold. First, by comparing a patient's results with the predicted norm, the
patient's degree of impairment can be estimated. Second, the test is most valuable as a measure of the
patient's response to therapy or the progression of disease.
11C. STAIR-CLIMBING TEST
For many years, physicians have used stair climbing to estimate a patient's cardiopulmonary reserve. The
empirical nature of stair climbing has been a drawback. However, in one study, subjects with COPD climbed
stairs until they became limited by symptoms and stopped [3]. A significant correlation was found between the
number of steps climbed and (1) peak oxygen consumption and (2) maximal exercise ventilation. This test is
another way to estimate operative risk in patients with COPD who are to undergo thoracic operation. The study
found that, on average, the ability to
P.108
climb 83 steps was equivalent to a maximal oxygen consumption ([V with dot above]O2 max) of 20 mL/kg per
minute. The ability to reach a maximal oxygen consumption of 20 mL/kg per minute has been reported to be
associated with fewer complications after lung resection or thoracotomy.
Stair climbing is more cumbersome than the 6- or 12-minute walk. However, it does push most patients closer
to their maximal oxygen consumption, [V with dot above]O2 max, an end point of greater physiologic
significance.
11D. VENTILATORY RESERVE
Measuring a subject's ventilation during a given task or exercise provides an estimate of the demand of that
task. The definition of ventilatory reserve (VR) is given by this relationship:
Given a maximal voluntary ventilation (MVV) of 60 L/min and an exercise ventilation ([V with dot above]E) of
30 L/min during a given task, the VR is 50% . The greater the [V with dot above]E, the lower
the reserve and the more likely it is that the patient will become dyspneic. A VR of less than 50% is usually
associated with dyspnea. Another approach is to subtract [V with dot above]E from the MVV. A value of MVV -
[V with dot above]E less than 20 L/min indicates severe ventilatory limitation.
11E. RATING OF RESPIRATORY IMPAIRMENT
Another approach to estimating respiratory impairment is based on the percentage reduction in various
pulmonary function tests. One recommendation presented by the American Thoracic Society is summarized in
Table 11-2. It provides useful guidelines. If a patient complains of severe dyspnea but the tests show only mild
to moderate impairment, muscle weakness, upper airway obstruction, or causes other than respiratory should
be considered. If none are found, cardiopulmonary exercise testing might be appropriate.
P.109](https://image.slidesharecdn.com/interpretationofpulmonaryfunctiontests-170711145442/85/Interpretation-of-pulmonary-function-tests-a-practical-guide-89-320.jpg)
![TABLE 11-2. Estimations of respiratory impairment based on results of pulmonary function
tests
Test*
Condition FVC FEV1 FEV1/FVC DLCO [V with dot
above]O2 max
Normal >80 >80 >75 >80 >75
Mild impairment 60-
80
60-
80
60-75 60-
80
60-75
Moderate impairment (unable to meet
physical requirements of many jobs)
50-
60
40-
60
40-60 40-
60
40-60
Severe impairment (unable to meet most
job demands, including travel to work)
<50 <40 <40 <40 <40
*
All tests relate to the percentage of the normal predicted value for an individual.
DLCO, diffusing capacity of carbon monoxide; FEV1, forced expiratory volume in 1 second; FVC, forced
vital capacity; [V with dot above]O2 max, maximal oxygen consumption.
Data from Ad Hoc Committee on Impairment/Disability Evaluation: Evaluation of impairment/disability
secondary to respiratory disorders. Am Rev Respir Dis 133:1205-1209, 1986.
11F. CARDIOPULMONARY EXERCISE TESTING
Cardiopulmonary exercise testing requires sophisticated equipment and should be performed only by
laboratories with strict quality control, experienced physiologic direction, appropriate medical supervision, and
considerable experience in doing such tests [4]. Numerous variables of gas exchange and cardiac function,
often requiring an indwelling arterial catheter for repeated blood gas determinations, are measured. The
measurements include ventilation ([V with dot above]), oxygen consumption ([V with dot above]O2), carbon](https://image.slidesharecdn.com/interpretationofpulmonaryfunctiontests-170711145442/85/Interpretation-of-pulmonary-function-tests-a-practical-guide-90-320.jpg)
![dioxide production ([V with dot above]CO2), dead space ventilation, and alveolararterial oxygen gradients. In
some laboratories, [V with dot above]O2 and [V with dot above]CO2 are measured breath by breath. Also
measured are the heart rate, blood pressure, and lactate levels, and electrocardiography is performed.
Some of the indications for cardiopulmonary exercise testing are as follows:
To distinguish between cardiac and pulmonary causes of dyspnea in complex cases
To determine whether the patient's symptoms are due to deconditioning
P.110
To detect the malingering patient
To provide disability evaluation in problem cases
To determine level of fitness, including whether a subject can meet the work requirements of a given
work assignment
REFERENCES
1. Crapo RO, Casaburi R, Coates AL, et al. ATS statement: Guidelines for the six-minute walk test. Am J Respir
Crit Care Med 166:111-117, 2002.
2. Enright PL, Sherrill DL. Reference equations for the six-minute walk in healthy adults. Am J Respir Crit Care
Med 158:1384-1387, 1998.
Bibliographic Links
ExternalResolverBasic
3. Pollock M, Roa J, Benditt J, Celli B. Estimation of ventilatory reserve by stair climbing: A study in patients
with chronic airflow obstruction. Chest 104:1378-1383, 1993.
4. Jones NL, Killian KJ. Exercise limitation in health and disease. N Engl J Med 343:632-641, 2000](https://image.slidesharecdn.com/interpretationofpulmonaryfunctiontests-170711145442/85/Interpretation-of-pulmonary-function-tests-a-practical-guide-91-320.jpg)
![12
Patterns in Various Diseases
There are patterns of pulmonary function test abnormalities that are typical for most patients with a particular
disease. Table 12-1 expands on Table 3-1, adding data on lung volumes, arterial blood gas values, diffusing
capacity, lung compliance and resistance, the single-breath nitrogen test, and maximal respiratory pressures. It
should be emphasized that a clinical diagnosis is not made from these test results alone. Rather they quantify
the lung impairment and are to be interpreted in the context of the total clinical picture. For this discussion,
obstructive disease is categorized into four conditions: emphysema, chronic bronchitis, chronic obstructive
pulmonary disease, and asthma. Restrictive conditions are divided into those due to pulmonary parenchymal
disease and extrapulmonary causes.
12A. EMPHYSEMA
Pure emphysema (such as α1-antitrypsin deficiency) is associated with hyperinflation (increased total lung
capacity [TLC]); a significant loss of lung elasticity (decreased recoil pressure at TLC and increased static
compliance of the lung [PTLC and CLstat]); and often a substantial decrease in the diffusing capacity of the lung
(DLCO, reflecting destruction of alveoli). Resting arterial tension of oxygen (PaO2) and carbon dioxide (PaCO2)
are generally normal until the condition is far advanced. Bullae, predominantly in the lower lung fields, are
typical in α1-antitrypsin deficiency.
P.112
P.113
TABLE 12-1. Patterns of pulmonary function tests in disease](https://image.slidesharecdn.com/interpretationofpulmonaryfunctiontests-170711145442/85/Interpretation-of-pulmonary-function-tests-a-practical-guide-92-320.jpg)


![The hallmark of early neuromuscular disease is a decrease in respiratory muscle strength reflected in decreases
in maximal expiratory and inspiratory pressures. At this stage, all other test results can be normal despite the
patient complaining of exertional dyspnea. As the process progresses, the maximal voluntary ventilation is next
to decrease, followed by decreases in the FVC and TLC with accompanying impairment of gas exchange.
Ultimately, the picture fits that of a restrictive extrapulmonary disorder.
These patterns are most frequent in amyotrophic lateral sclerosis, myasthenia gravis, and polymyositis. They
have also been noted in syringomyelia, muscular dystrophy, parkinsonism, various myopathies, and Guillain-
Barré syndrome.
12H. CONGESTIVE HEART FAILURE
The effects of left-sided congestive heart failure with pulmonary congestion on the function of an otherwise
normal lung are often not appreciated. In some cases, the predominant change is one of pure restriction with a
normal FEV1/FVC ratio, flows decreased in proportion to the FVC, and a normal flow-volume curve slope. There
is often associated cardiomegaly, which contributes to the restriction. The chest radiograph may be
interpreted as suggesting interstitial fibrosis, but the computed tomographic appearance is distinctly different.
P.117
In other cases, there may be a mixed restrictive-obstructive pattern with decreases in flow out of proportion to
volume reduction. The FEV1/FVC ratio is reduced, as is the slope of the flow-volume curve. The obstructive
component is in part due to peribronchial edema, which narrows the airways and produces “cardiac asthma.”
Of interest, the result of the methacholine challenge test may be positive for reasons that are unclear.
In years past, the effectiveness of therapy for pulmonary congestion was sometimes monitored by measuring
changes in the vital capacity. Congestive heart failure is highlighted here because it is often overlooked as a
possible cause of a restrictive or obstructive pattern.
12I. OBESITY
The changes in pulmonary function tests associated with obesity are indicated in Table 12-1. These changes do
not seem to differ substantially between male and female patients. Some test results, such as the TLC, are
abnormal only at very high body mass indexes. Others, such as decreases in functional residual capacity and
expiratory reserve volume (not included in Table 12-1), occur with milder degrees of obesity. The results for
RV and RV/TLC ratio may depend in part on whether the RV was calculated using the FVC or slow vital capacity
(see section 3C, page 31). Even in the massively obese patient, the FEV1/FVC ratio can be normal. The adverse
effects of obesity are greater in patients with a truncal fat distribution (“apple” versus “pear”) and may be
greater in the elderly and in smokers, variables that are not always reported. In this respect, one study [1]
found that male patients who had obstructive lung disease and gained weight after quitting smoking had a loss
of 17.4 mL in FVC for every kilogram of weight gained. Their FEV1 also decreased by 11.1 mL per kilogram of
weight gained. Similar but smaller changes of 10.6 mL FVC and 5.6 mL FEV1 were found in women.
A very interesting development has been the apparent association between obesity and asthma. Does obesity
increase the risk of asthma? The final answer is not in. A recent review [2] concluded that obesity has an
important but modest impact on the incidence and prevalence of asthma.](https://image.slidesharecdn.com/interpretationofpulmonaryfunctiontests-170711145442/85/Interpretation-of-pulmonary-function-tests-a-practical-guide-97-320.jpg)

![13
When to Test and What to Order
The recommendations for preoperative testing are listed in Chapter 10. Although there are many other
situations in which pulmonary function testing is indicated, for reasons that are unclear these tests are
underutilized. This chapter describes instances in which testing is warranted and includes the basic tests to be
ordered. Depending on the initial test results, additional studies may be indicated.
13A. THE SMOKER
Even if smokers have minimal respiratory symptoms, they should be tested by age 40. Depending on the results
and a patient's smoking habits, repeat testing every 3 to 5 years is reasonable. The logic for early testing is
shown in Figure 13-1. This shows the typical pattern of development of chronic obstructive pulmonary disease
(COPD). Spirometry is the first test to have abnormal results. The innocuous cigarette cough may indicate
significant airway obstruction. When confronted with an abnormal test result, a patient can often be convinced
to make a serious attempt to stop smoking, which is a most important step to improving health. Figure 13-2
shows the average rates of decline in function in smokers with COPD and nonsmokers. The earlier the rapid loss
of function can be interrupted in the smoker, the greater will be the life expectancy.
Test: Spirometry before and after bronchodilator
P.120
View Figure
FIG. 13-1. Progression of symptoms in chronic obstructive
pulmonary disease (COPD) reflected by spirometry, arterial blood
gas studies, and chest radiographs as a function of age in a typical
case. Spirometry can detect COPD years before significant dyspnea
occurs. (From PL Enright, RE Hyatt [eds]. Office Spirometry: A
Practical Guide to the Selection and Use of Spirometers.
Philadelphia: Lea & Febiger, 1987. Used with permission of Mayo
Foundation for Medical Education and Research.)](https://image.slidesharecdn.com/interpretationofpulmonaryfunctiontests-170711145442/85/Interpretation-of-pulmonary-function-tests-a-practical-guide-99-320.jpg)
![View Figure
FIG. 13-2. Normal decline in forced expiratory volume in 1 second
(FEV1) with age contrasted with the accelerated decline in
continuing smoking in chronic obstructive pulmonary disease
(COPD). Smoking cessation can halt this rapid decline. (From PL
Enright, RE Hyatt [eds]. Office Spirometry: A Practical Guide to the
Selection and Use of Spirometers. Philadelphia: Lea & Febiger,
1987. Used with permission of Mayo Foundation for Medical
Education and Research.)
P.121
13B. CHRONIC OBSTRUCTIVE PULMONARY DISEASE
Even if the clinical diagnosis of COPD is clear-cut, it is important to quantify the degree of impairment of
pulmonary function. A forced expiratory volume in 1 second (FEV1) of 50% of predicted portends future
disabling disease. An FEV1 of less than 800 mL predicts future carbon dioxide retention (respiratory
insufficiency).
Repeating spirometry every 1 to 2 years establishes the rate of decline of values such as the FEV1. The FEV1
declines an average of 60 mL/yr in persons with COPD who continue to smoke, compared with 25 to 30 mL/yr
in normal subjects and persons who quit smoking.
Tests:
Initially, spirometry before and after bronchodilator and determination of the diffusing capacity of
carbon monoxide (DLCO). Arterial blood gas studies are recommended when the FEV1 is less than 50%
predicted.
Initially, if available, static lung volumes such as total lung capacity (TLC) and residual volume (RV).
Follow-up testing with spirometry is usually adequate.
13C. ASTHMA
It is important to be sure that the patient with apparent asthma really has this disease. Remember that “not
all that wheezes is asthma.” Major airway lesions can cause stridor or wheezing, which has been mistaken for
asthma. The flow-volume loop often identifies such lesions (see section 2K, page 18).
Testing is also important in patients with asthma in remission or with minimal symptoms. This provides a
baseline against which to compare results of function tests during an attack and thus quantify the severity of
the episode.](https://image.slidesharecdn.com/interpretationofpulmonaryfunctiontests-170711145442/85/Interpretation-of-pulmonary-function-tests-a-practical-guide-100-320.jpg)


![14
Approaches to Interpreting Pulmonary Function Tests
Different experts follow different approaches to interpretation of pulmonary function tests. There is no
universally accepted standard for interpretation, but the two most commonly cited standards have been the
1986 American Thoracic Society Disability Standard [1] and the 1991 statement of the American Thoracic
Society [2]. In 2005, the American Thoracic Society and the European Respiratory Society updated the
pulmonary function interpretation strategies [3].
This chapter describes three approaches. The first uses the flow-volume curve and the normal predicted
values. The second uses the test data without the flow-volume curve. The third uses a pulmonary function test
“crib sheet” developed in the Mayo Clinic Division of Pulmonary and Critical Care Medicine as an instructional
tool for residents and fellows.
14A. FLOW-VOLUME CURVE AVAILABLE
Step I
Examine the flow-volume curve and compare it with the normal predicted curve (see the Appendix for how to
construct the normal curve). Is there any ventilatory limitation (that is, any loss of area)? If not, the test result
is most likely normal.
Is the forced vital capacity (FVC) normal? If so, any significant restriction is essentially ruled out.
Is the FVC reduced? If so, either obstruction or restriction could be the cause (see Fig. 2-3, page 10).
Examine the contour of the flow-volume curve.
o Is it normal-appearing (Fig. 14-1)? If so, and if the FVC is normal, the test result is almost
always normal. Proceed to steps V, VI, and VII. If the FVC is reduced and the flow-volume
slope and ratio of forced expiratory volume in 1 second to FVC (FEV1/FVC ratio) are normal,
restriction, occult asthma, or a nonspecific abnormality may be present (see section 2F, page
12, and section 3E, page 36). The total lung capacity (TLC) will have to be measured to make
the differentiation.
o Is the curve scooped out with reduced flow-volume slope and low flows (Fig. 14-2)? An
obstructive defect is most likely. Remember the occasional mixed restrictive-obstructive
disorder.
Is the slope of the flow-volume curve increased (Fig. 14-3)? This finding is consistent with a pulmonary
parenchymal restrictive process. The FVC, TLC, and diffusing capacity of carbon monoxide (DLCO)
must be reduced to be certain. (Grading the degree of restriction is described in section 14C, page
139.)
If there is a flow-volume loop, is there any suggestion of a major airway lesion (Fig. 14-4)?
P.130](https://image.slidesharecdn.com/interpretationofpulmonaryfunctiontests-170711145442/85/Interpretation-of-pulmonary-function-tests-a-practical-guide-107-320.jpg)

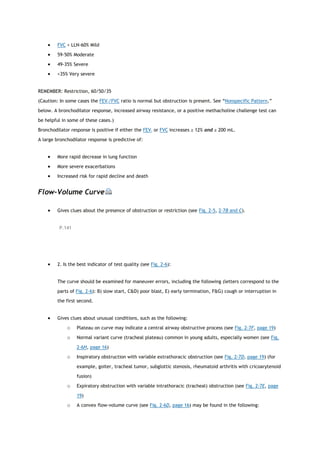

![DLCO may be reduced in pulmonary hypertension, but it is insensitive for detecting cases.
DLCO is often used to monitor for an adverse pulmonary effect of chemotherapy.
DLCO should be adjusted for low hemoglobin for anemic patients.
DLCO may be increased in (1) asthma, (2) obesity, (3) left-to-right shunt, (4) polycythemia, (5) hyperdynamic
states, postexercise, (6) pulmonary hemorrhage, and (7) supine position.
Maximal Respiratory Pressures (“Bugles”)
These are used to assess respiratory muscle strength. If low, they indicate muscle weakness or poor
performance. Inspiratory pressure is mostly a function of diaphragmatic strength. Tetraplegics show reduced
expiratory pressures with inspiratory pressures (diaphragm) relatively preserved. Diaphragmatic paralysis is the
opposite.
Obesity
Obesity has a small but sometimes considerable effect on pulmonary function. The increased chest wall
impedance causes a restrictive pattern in some obese patients. On average, a person with a body mass index of
35 will have a 5 to 10% reduction in FVC. TLC is usually not reduced to the same degree as FVC. Obese people
may wheeze when they breathe near residual volume, sometimes called pseudo-asthma. DLCO is normal or
increased. Additional effects of obesity on pulmonary function are discussed in section 12I (page 117) and
Table 12-1 (page 112-113).
14D. NEW STANDARD FOR PULMONARY FUNCTION TESTING AND
INTERPRETATION
The American Thoracic Society (ATS) has provided standards for the performance of pulmonary function testing
[1,2]. The standards have been periodically updated. British and European societies published standards for
their respective countries. The most recent update, including lung volume measurements, was developed in
conjunction with the European Respiratory Society
P.144
(ERS) and included a strategy for interpreting the results of lung function tests [3]. The basic sequence for
interpretation (Fig. 14-7) is not changed from the methods described in this chapter. However, several aspects
of the new standard are troublesome.](https://image.slidesharecdn.com/interpretationofpulmonaryfunctiontests-170711145442/85/Interpretation-of-pulmonary-function-tests-a-practical-guide-118-320.jpg)
![View Figure
FIG. 14-7. Algorithm for interpretation of results of pulmonary
function tests. CB, chronic bronchitis; CW, chest wall; DLCO,
diffusing capacity of carbon monoxide; FEV1, forced expiratory
volume in 1 second; ILD, interstitial lung disease; LLN, lower limit
of normal; NM, neuromuscular; PV, pulmonary vascular; TLC, total
lung capacity; VC, vital capacity.
The three points of concern are (1) the recommendation to use the FEV1/VC (vital capacity) ratio rather than
FEV1/FVC; (2) the “nonspecific abnormality” with normal FEV1/FVC ratio, low FVC, and normal TLC; and (3) the
isolated reduction in DLCO with normal spirometry and lung volumes.
The recommendation for use of the FEV1/VC ratio rather than FEV1/FVC ratio for diagnosis of obstruction is
based on European
P.145
reference equations. The VC reported is the largest of any VC maneuver regardless of how it was obtained.
Hence, the VC is always equal to or more than the FVC, and the FEV1/VC is always equal to or less than the
FEV1/FVC. The reference equation used is from a U.S. population and calculates an expected value for
FEV1/FVC, not FEV1/VC [4]. Arbitrarily substituting FEV1/VC for FEV1/FVC will cause a systematic bias toward
overdiagnosis of obstruction.
With use of ATS-ERS flow diagram, the “nonspecific abnormality” (normal FEV1/FVC ratio, low FVC and normal
TLC) is interpreted as obstruction (that is, asthma or chronic bronchitis). At Mayo Clinic, this common pattern
accounts for nearly 10% of all pulmonary function tests. As noted in section 3E, page 36, most cases are
associated with asthma, airway hyperreactivity, obesity, and chronic lung disease. However, 25% of the cases
studied had no evidence of airway obstruction.
The isolated reduction in DLCO with normal spirometry and lung volumes is said to be due to pulmonary
vascular disorders. It is true that pulmonary vascular disorders, such as pulmonary hypertension, can cause this
pattern; however, they are relatively rare. The most common cause of an isolated reduction in DLCO with
normal lung mechanics is emphysema, and it is not always mild when examined with computed tomography. In
addition, relatively mild cases of interstitial lung disease often present with low DLCO with lung volumes in the
low-normal range [5].
The new ATS-ERS interpretation strategy changes the thresholds defining the severity of obstruction or
restriction without providing any rationale for doing so. However, we use the classification of severity shown in
Table 14-1.](https://image.slidesharecdn.com/interpretationofpulmonaryfunctiontests-170711145442/85/Interpretation-of-pulmonary-function-tests-a-practical-guide-119-320.jpg)
![Meanwhile, guidelines for chronic obstructive pulmonary disease have been established by numerous groups,
most notably the Global Initiative for Chronic Obstructive Lung Disease and the ATS. These standards have
shifted the grading of severity compared with older standards. This change is said to be motivated by a desire
to improve early recognition of disease, but it may prompt prescription of expensive medications with
associated adverse effects for asymptomatic patients who may not benefit as clearly as more severely affected
patients. These concerns are discussed in references [6] and [7].
P.146
TABLE 14-1. Impairment and severity stratifications
Obstruction (60/40/30)*
Restriction (60/50/35)†
FEV1/FVC < LLN and: FEV1≥LLN Borderline <LLN-
60% Mild 59-40% Moderate 39-30% Severe <30%
Very severe
FEV1/FVC ≥ LLN and TLC < LLN and: FVC < LLN-
60% Mild 59-50% Moderate 49-35% Severe <35%
Very severe
*
Numbers in parentheses are forced expiratory volume in 1 second.
†
Numbers in parentheses are forced expiratory vital capacity. FEV1, forced expiratory volume in 1
second; FVC, forced expiratory vital capacity; LLN, lower limit of normal.
REFERENCES
1. American Thoracic Society. Evaluation of impairment/disability secondary to respiratory disorders. Am Rev
Respir Dis 133:1205-1209, 1986.
ExternalResolverBasic
2. American Thoracic Society. Lung function testing: Selection of reference values and interpretative
strategies. Am Rev Respir Dis 144:1202-1218, 1991.
Bibliographic Links
ExternalResolverBasic
3. Pellegrino R, Viegi G, Brusasco V, et al. Interpretative strategies for lung function tests. Eur Respir J 26:948-
968, 2005.
4. Hankinson JL, Odencrantz JR, Fedan KB. Spirometric reference values from a sample of the general U.S.
population. Am J Respir Crit Care Med 159:179-187, 1999.](https://image.slidesharecdn.com/interpretationofpulmonaryfunctiontests-170711145442/85/Interpretation-of-pulmonary-function-tests-a-practical-guide-120-320.jpg)
![5. Aduen JF, Zisman DA, Mobin SI, et al. Retrospective study of pulmonary function tests in patients presenting
with isolated reduction in single-breath diffusion capacity: implications for the diagnosis of combined
obstructive and restrictive lung disease. Mayo Clin Proc 82:48-54, 2007.
6. Enright P. Flawed interpretative strategies for lung function tests harm patients [editorial]. Eur Respir J
27:1322-1323, 2006.
Bibliographic Links
ExternalResolverBasic
7. Pellegrino R, Brusasco V, Crapo RO, et al. From the authors [editorial]. Eur Respir J 27:1323-1324, 2006.](https://image.slidesharecdn.com/interpretationofpulmonaryfunctiontests-170711145442/85/Interpretation-of-pulmonary-function-tests-a-practical-guide-121-320.jpg)
![15
Illustrative Cases
The cases presented in this chapter demonstrate many of the points made in the preceding text. A few
examples are of unusual cases, but most present problems that are commonly evaluated in the pulmonary
function laboratory.
For most of the cases, the flow-volume curve should be studied first. After a preliminary interpretation is
reached, the measurements should be reviewed to determine whether they support or change this
interpretation. Frequently, some questions are posed, and an attempt should be made to answer them before
the answers are read. (The cases are not arranged in a particular order. In the tables, the normal predicted
value, observed value, and the percentage of the predicted value are listed. Abnormal values that are less or
more than the normal range are indicated by an asterisk [*
]. The equations used to predict these values are
given in the Appendix. The types of cases are listed on pages 247 and 248. Also, the abbreviations used in the
chapter are defined on pages xi-xiii.
P.148
CASE 1](https://image.slidesharecdn.com/interpretationofpulmonaryfunctiontests-170711145442/85/Interpretation-of-pulmonary-function-tests-a-practical-guide-122-320.jpg)
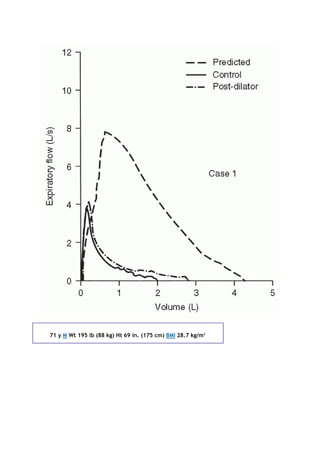
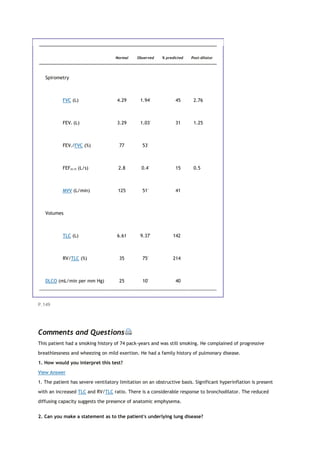
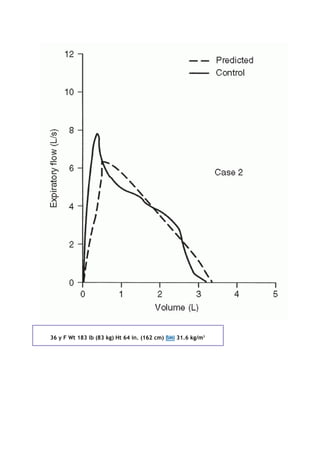

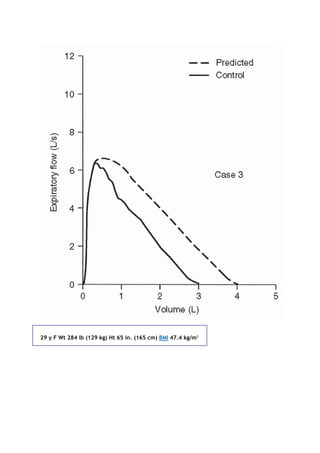

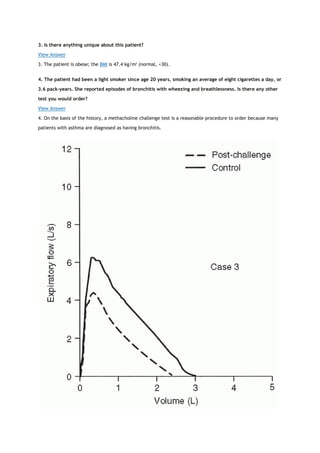
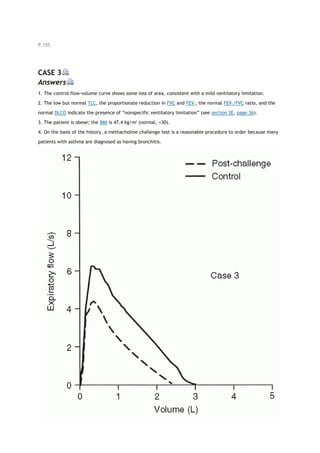
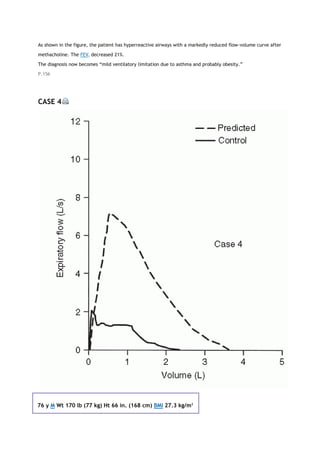
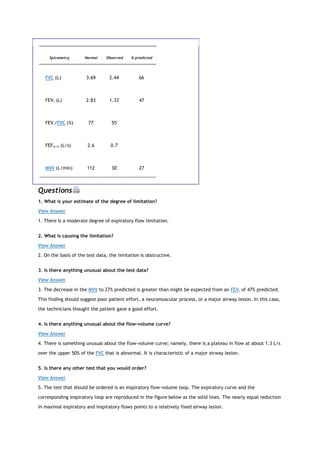
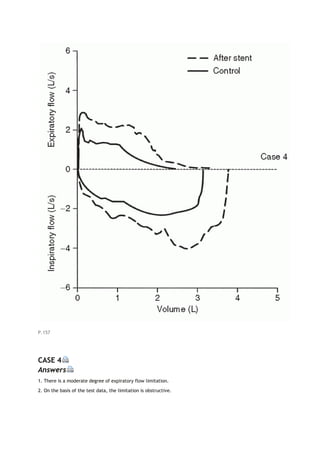
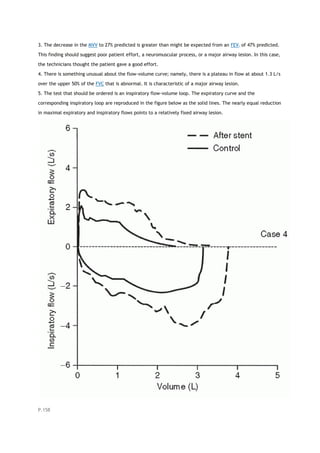

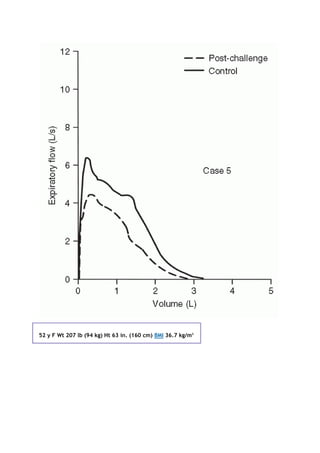
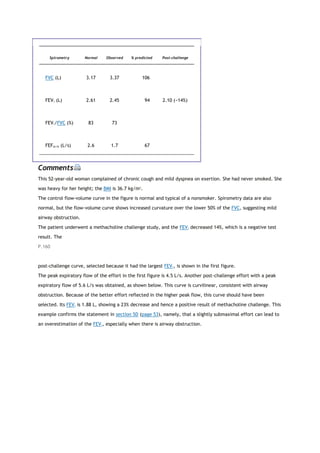
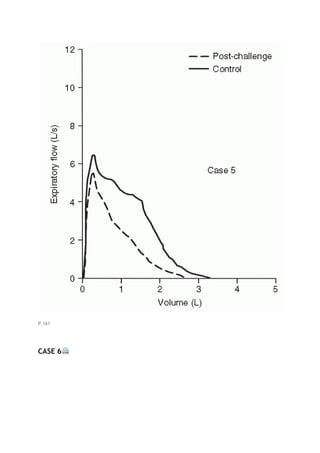
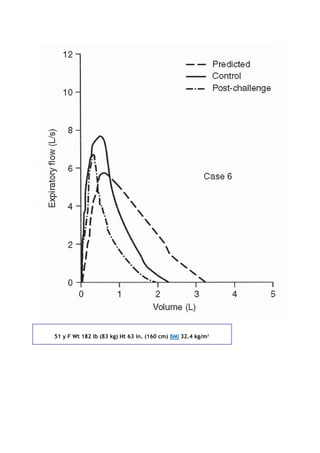
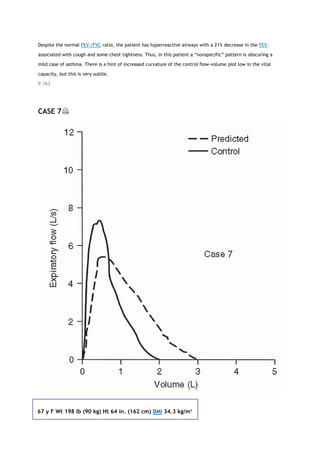
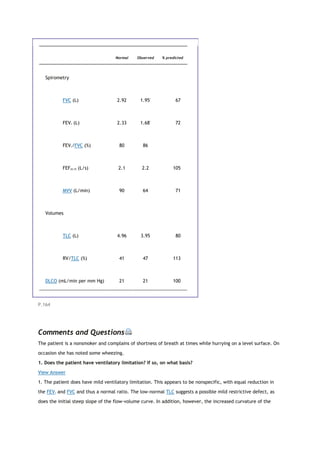

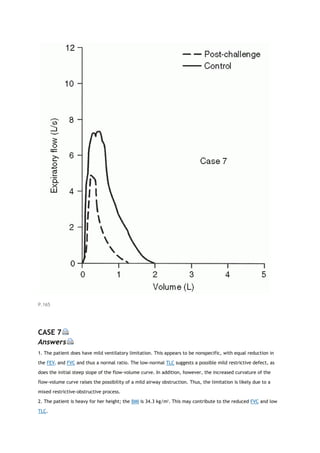
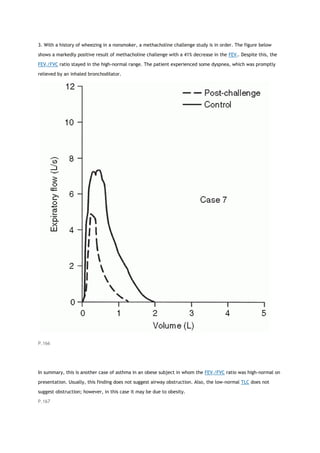
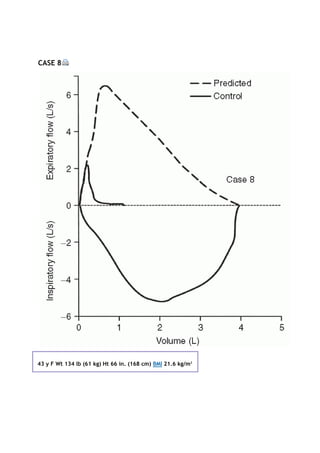
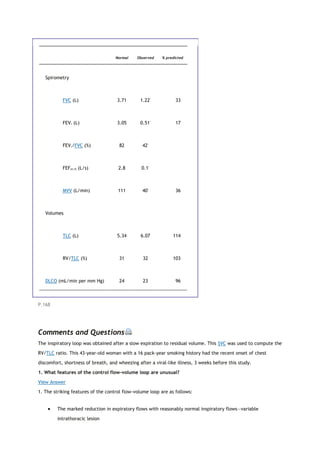

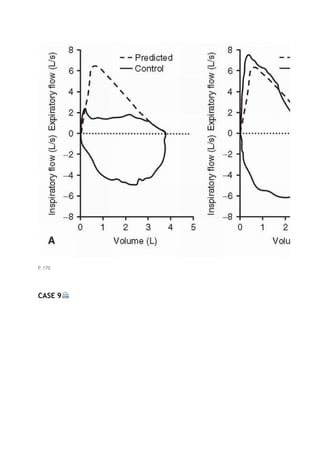
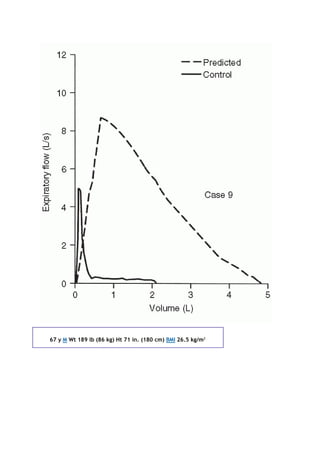
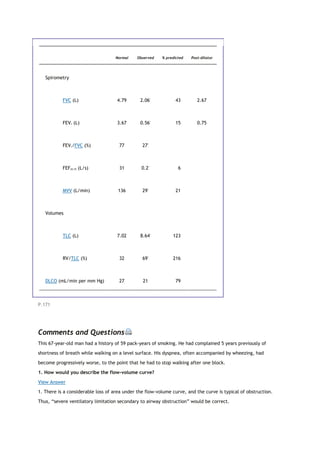

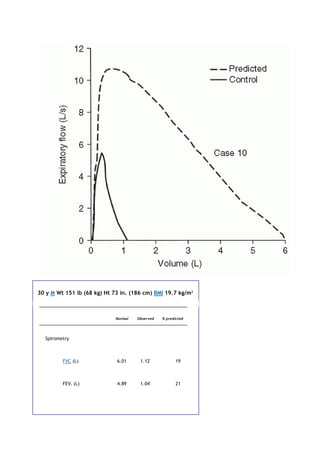
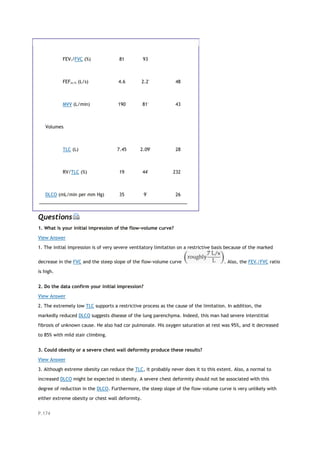
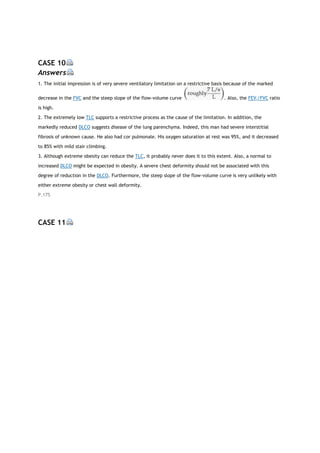
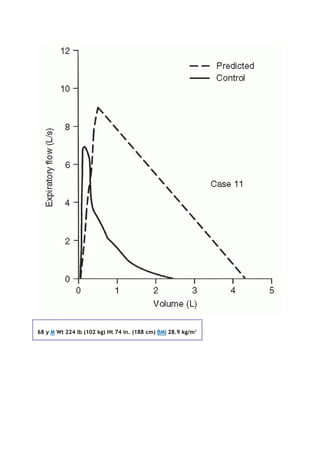


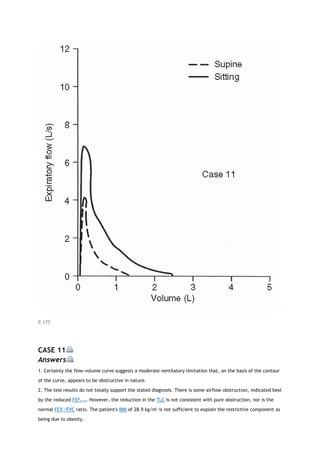

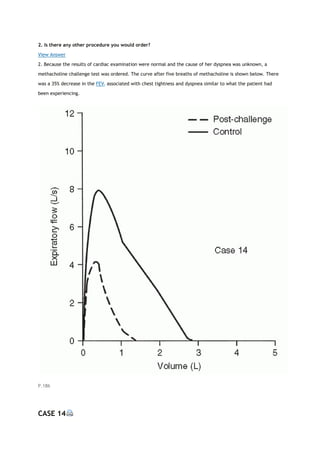
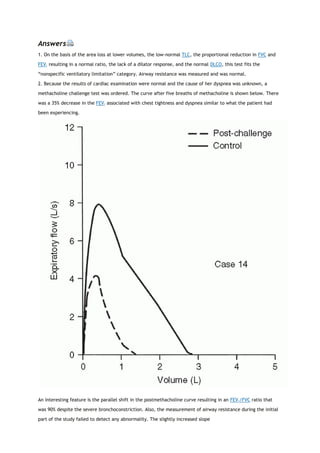
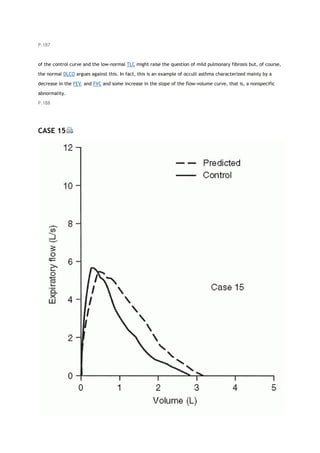
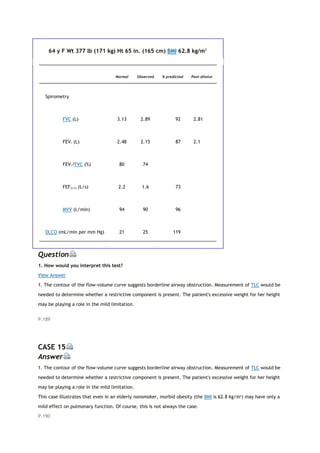
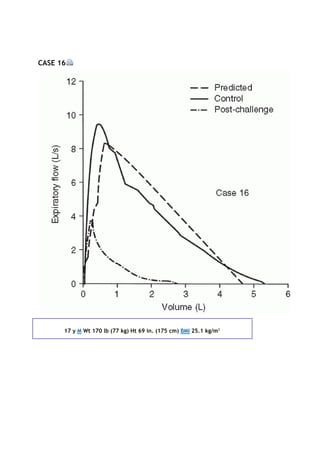
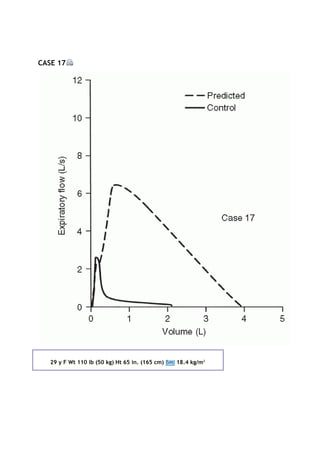
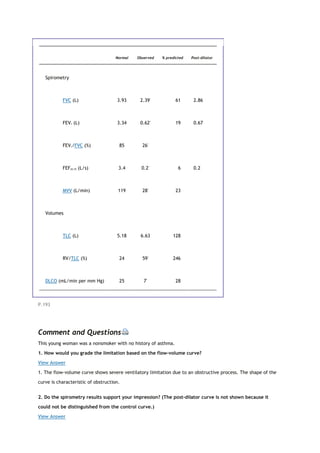
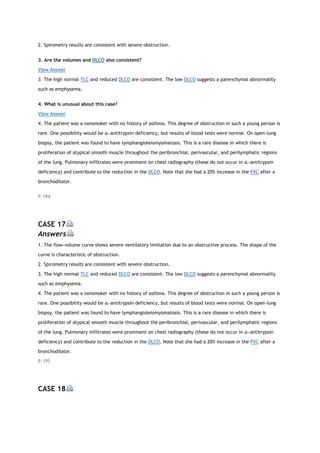
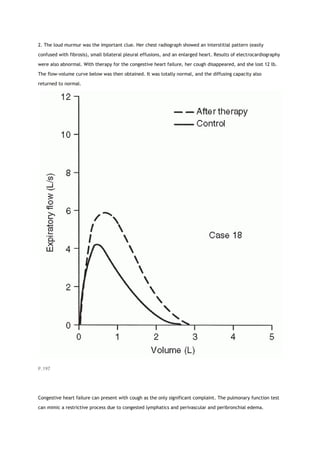
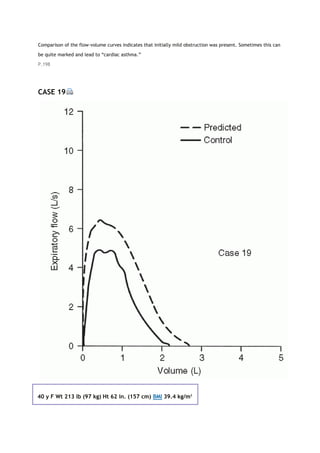
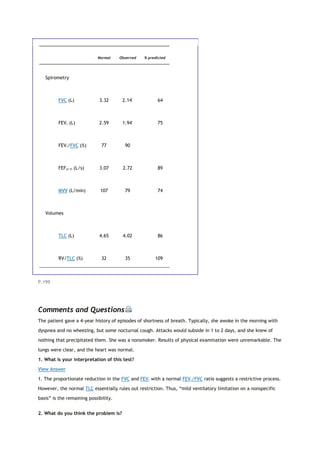
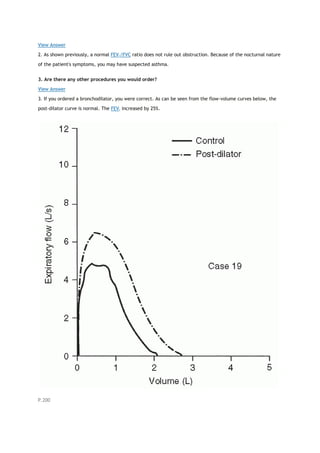
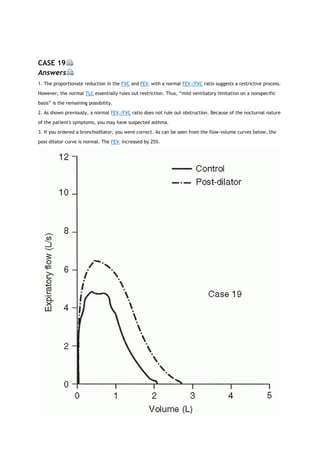

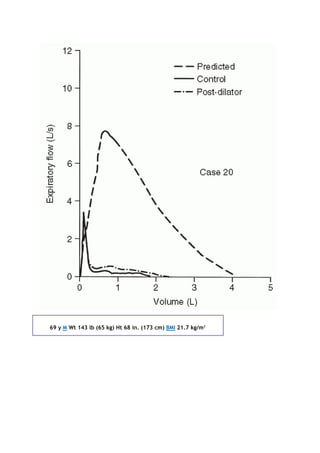
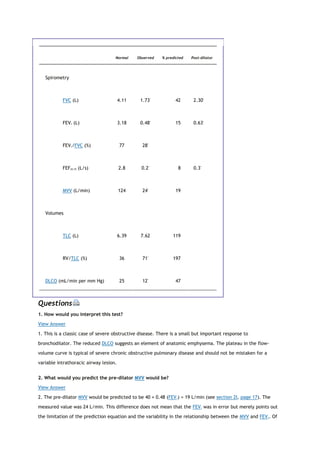

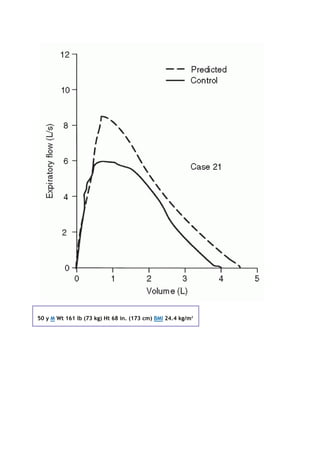

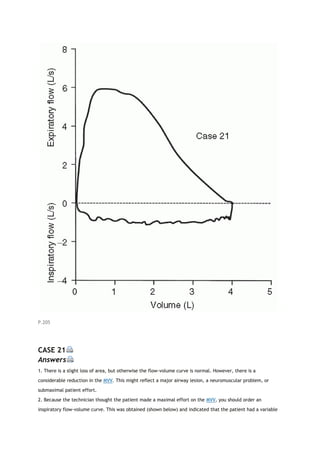
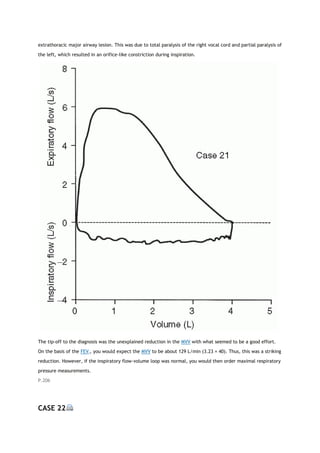
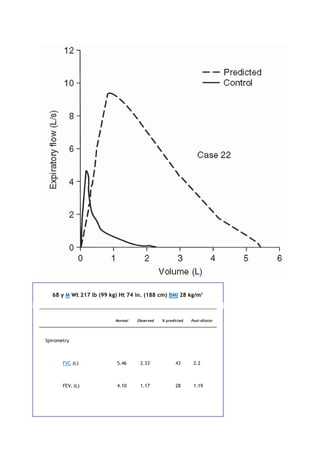
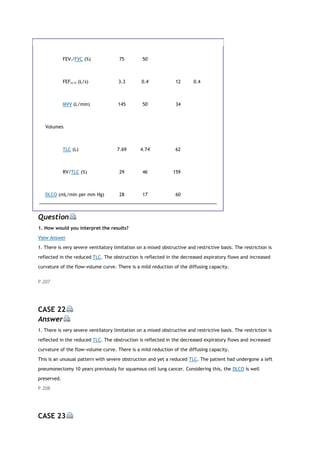
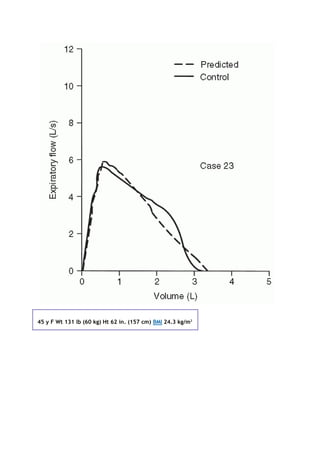
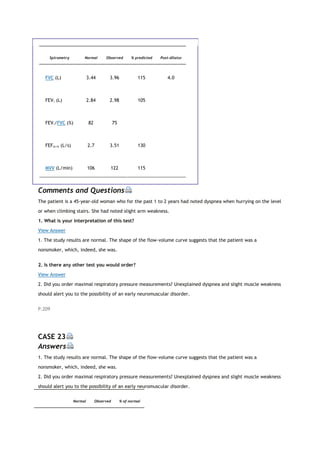
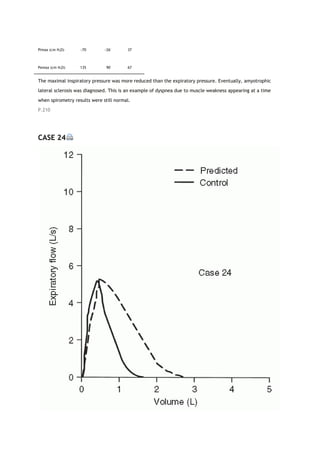
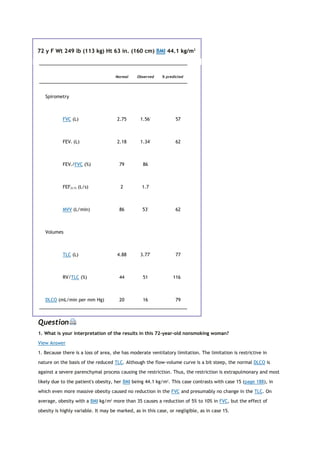

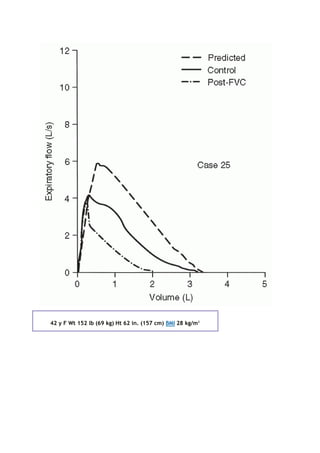
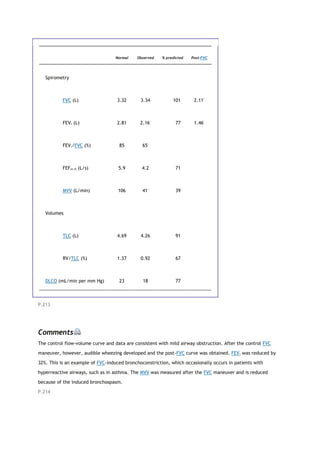
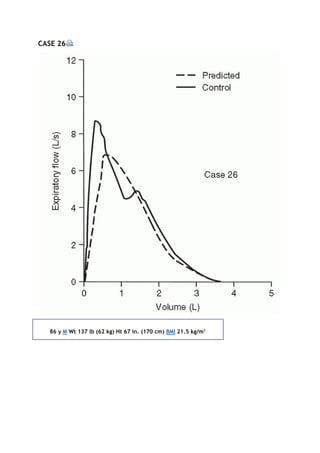
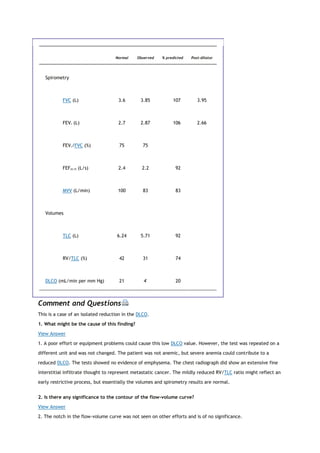

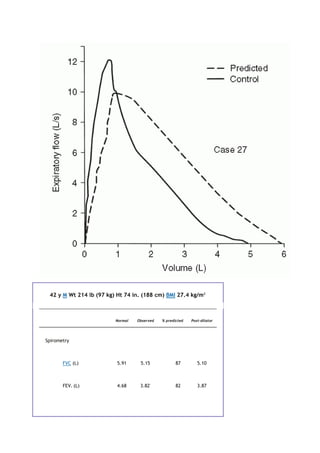
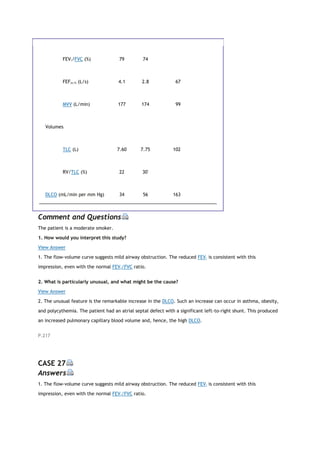
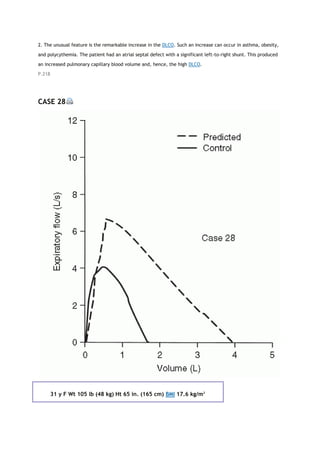
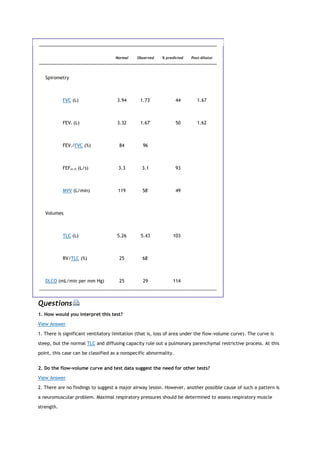

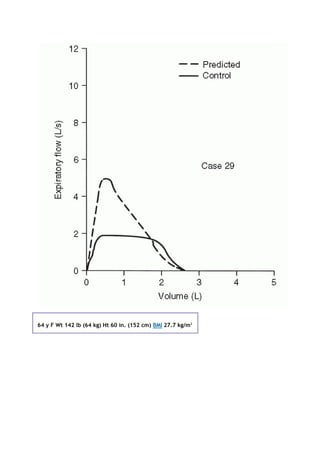
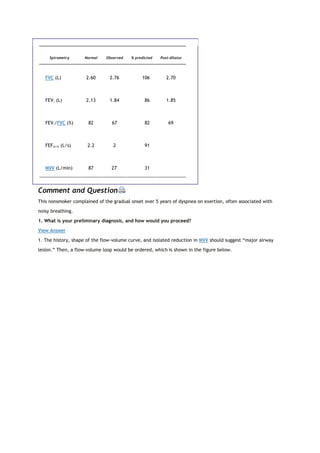
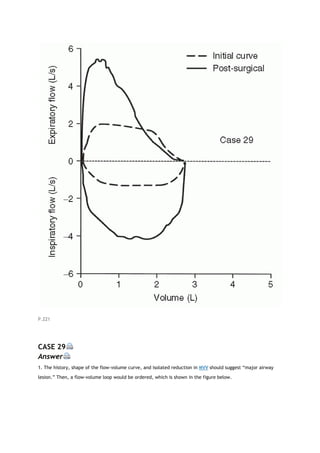
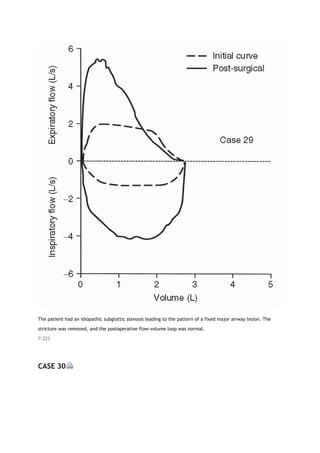
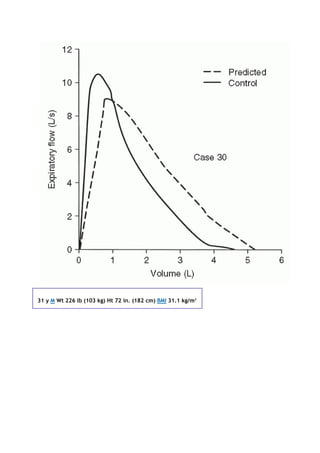
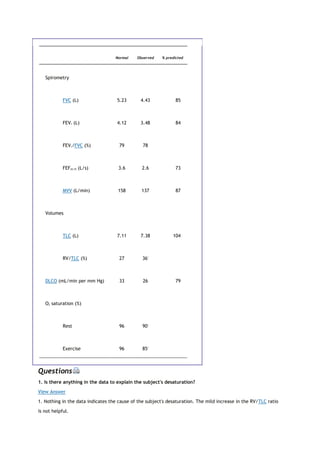

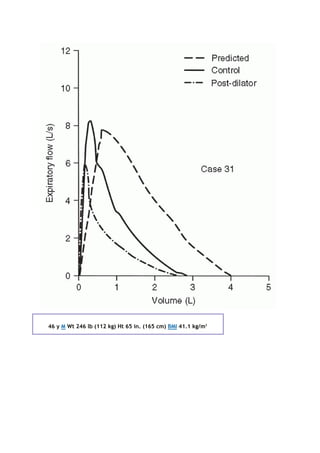
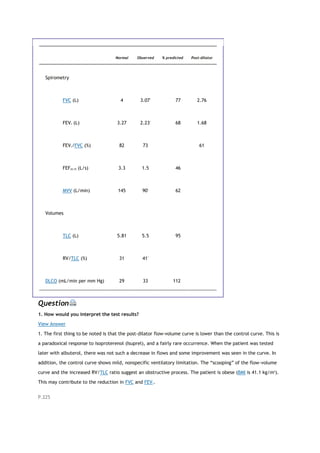
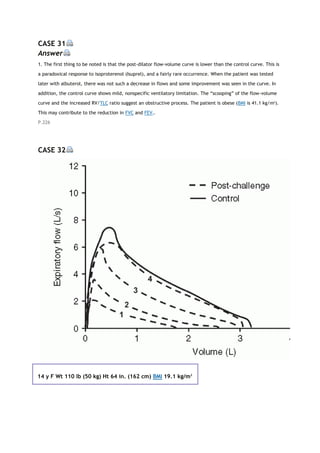
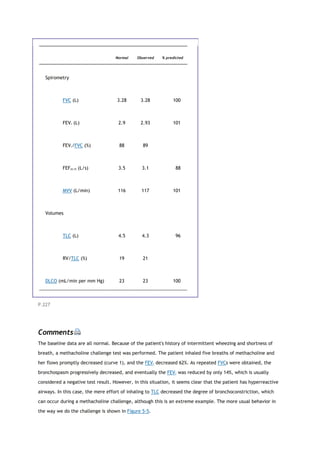
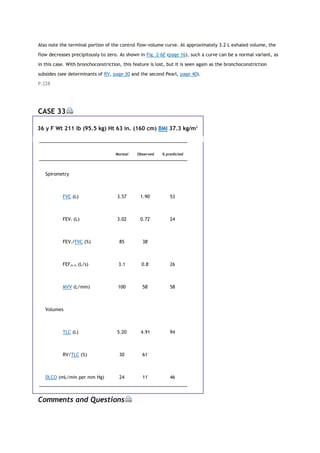
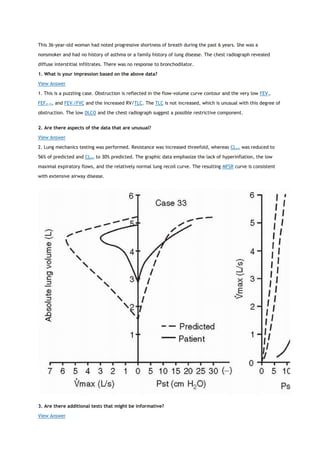
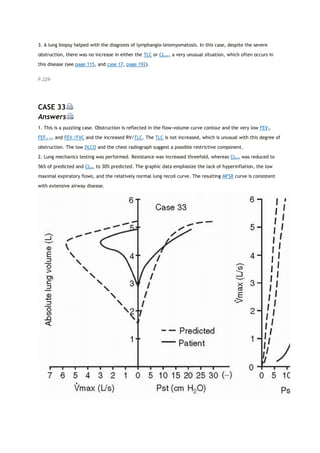
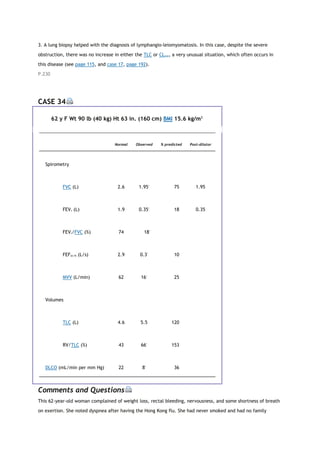
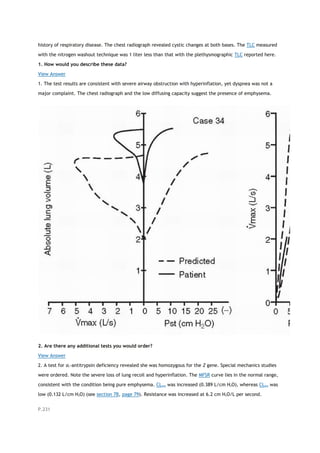
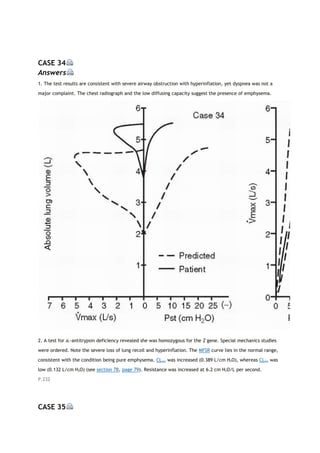
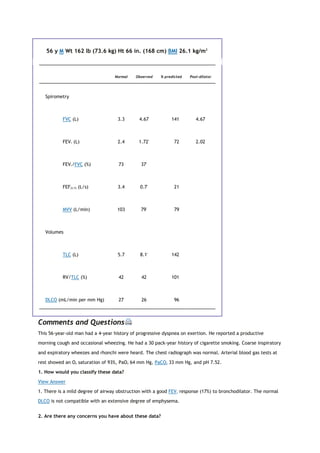
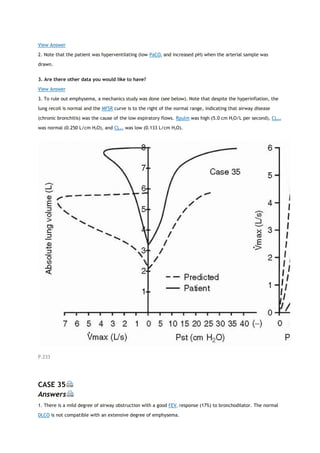
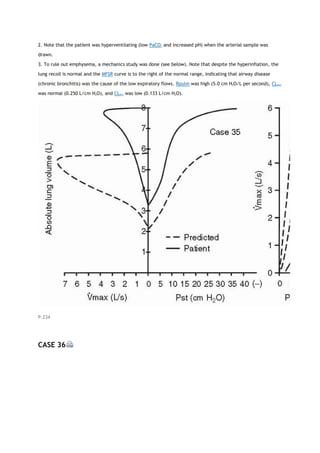
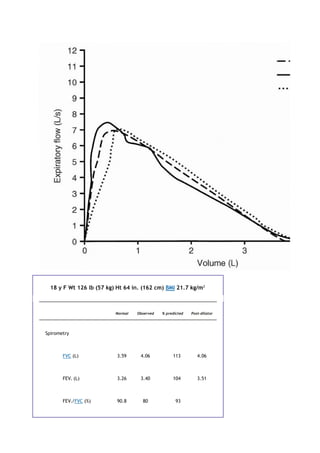
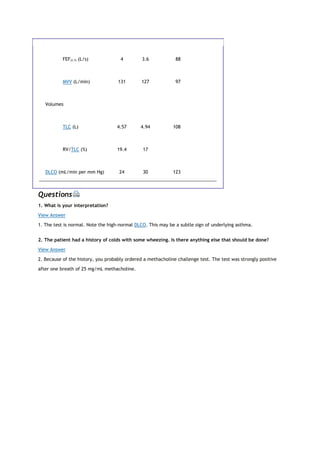
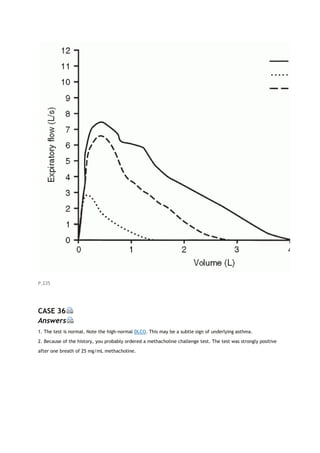
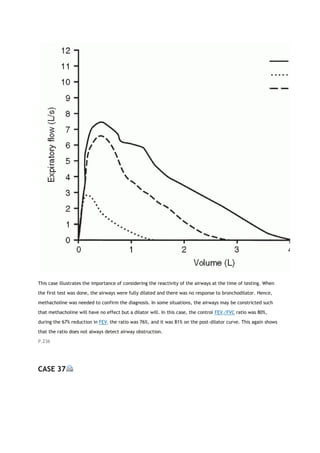
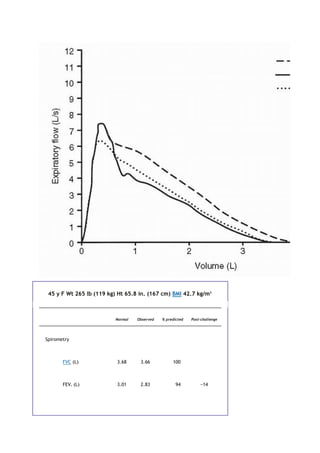
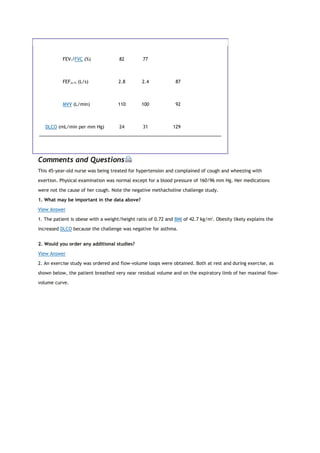
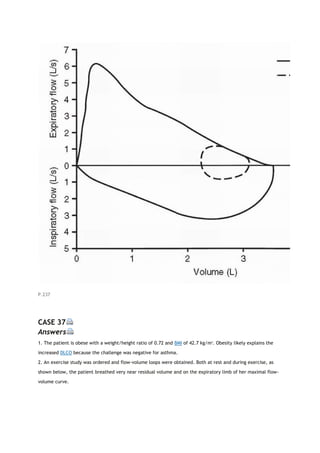
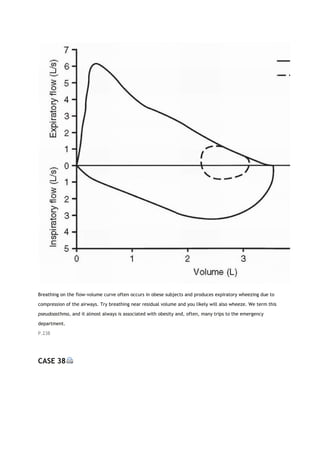
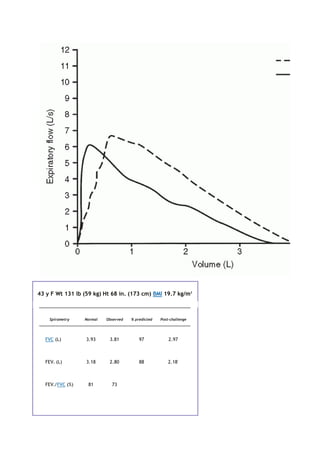

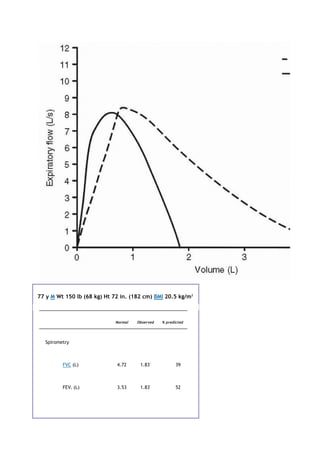
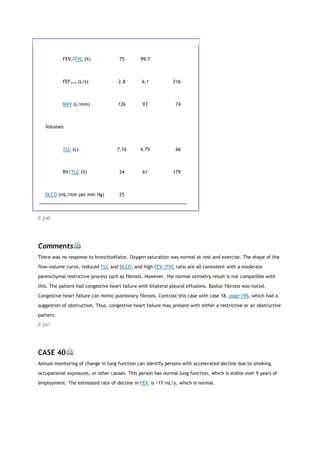
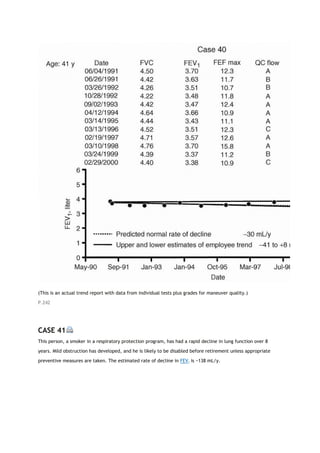
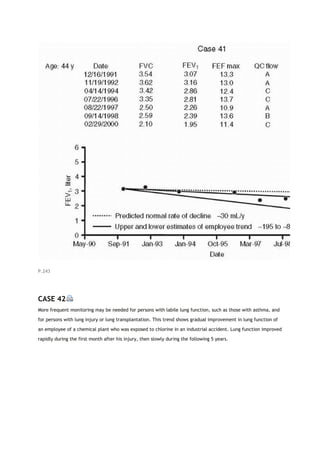
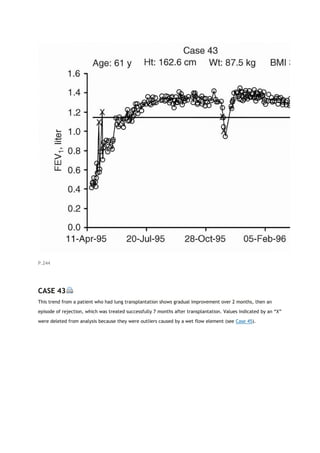
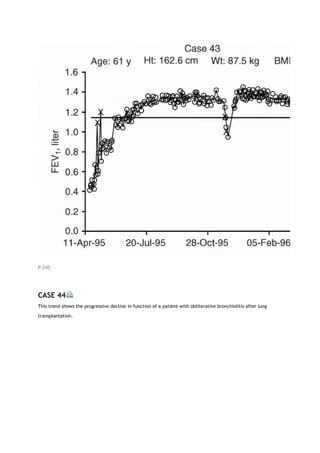
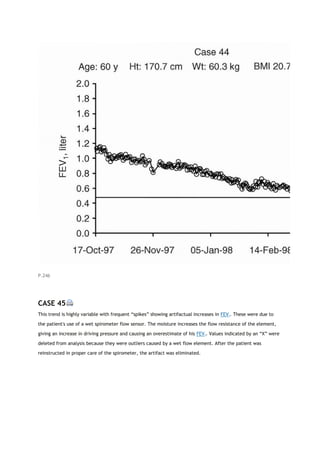
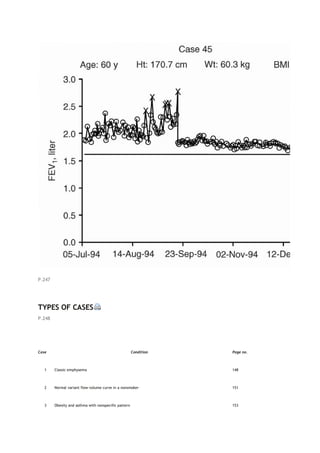

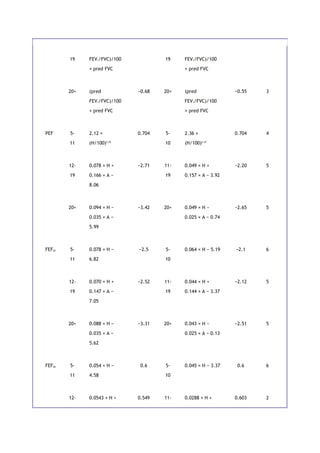
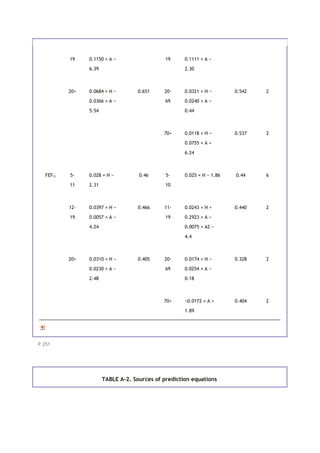
![Total lung capacity
Miller A, Thornton JC, Warshaw R, et al. Single breath diffusing capacity in a representative
sample of the population of Michigan, a large industrial state: Predicted values, lower limits of
normal, and frequencies of abnormality by smoking history. Am Rev Respir Dis 127:270-277, 1983.
Spirometry
Miller A, Thornton JC, Warshaw R, et al. Mean and instantaneous expiratory flows, FVC and FEV1:
prediction equations from a probability sample of Michigan, a large industrial state. Bull Eur
Physiopathol Respir 22:589-597, 1986.
REFERENCES
1. Polgar G, Promadhat V [eds]: Pulmonary Function Testing in Children: Techniques and Standards.
Philadelphia: Saunders, 1971.
2. Knudson RJ, Lebowitz MD, Holberg CJ, Burrows B. Changes in the normal maximal expiratory flow-volume
curve with growth and aging. Am Rev Respir Dis 127: 725-734, 1983.
3. Miller A, Thornton JC, Warshaw R, et al. Mean and instantaneous expiratory flows, FVC and FEV1: prediction
equations from a probability sample of Michigan, a large industrial state. Bull Eur Physiopathol Respir 22: 589-
597, 1986.
4. Hsu KH, Jenkins DE, Hsi BP, et al. Ventilatory functions of normal children and young adults: Mexican-
American, white, and black. I. Spirometry. J Pediatr 95: 14-23, 1979.
5. Knudson RJ, Slatin RC, Lebowitz MD, Burrows B. The maximal expiratory flow-volume curve: Normal
standards, variability, and effects of age. Am Rev Respir Dis 113: 587-600, 1976.
6. Zapletal A, Motoyama EK, Van De Woestijne KP, et al. Maximum expiratory flow-volume curves and airway
conductance in children and adolescents. J Appl Physiol 26: 308-316, 1969.](https://image.slidesharecdn.com/interpretationofpulmonaryfunctiontests-170711145442/85/Interpretation-of-pulmonary-function-tests-a-practical-guide-256-320.jpg)


This document summarizes a third edition of the book "Interpretation of Pulmonary Function Tests". It provides brief biographies of the authors and acknowledges those who assisted in the publication. It also includes a preface describing some of the additions and updates made for this new edition, as well as a list of common abbreviations used within pulmonary function literature.


